
WEEKLY COMMENTARY July 27, 2020

Looking at Strategic Management Through a Financial Lens

I’ve been teaching two MBA courses in Strategic Management this summer at California Baptist University. While teaching these courses, I’ve been trying out different ways to explore the concept of strategic management and to explain it to the students. In doing so, I have been using a financial model lens that I created to explain the enterprise value creation process (Wendee, 2011a, 2011b) in order to now explore strategic management.

A financial lens model is appropriate for exploring strategic management as many scholars believe that the ultimate goal of any corporate manager is to create shareholder value (Brigham & Erhardt, 2017; Damodaran, 2011; Wendee, 2011a, 2011b), which is mostly a financial concept. This can be seen in The Value Creation Process chart below in Charts for Review and Thought. Even for those who believe that corporate managers should focus on creating value for all of the stakeholders, not just the shareholders (see for example, Mackey, 2014, 2019), the financial lens model is still appropriate.

Referring to The Value Creation Process chart (Wendee, 2011a, 2011b), the basic idea is that managers use management tools to: (1) explore the enterprise’s environment; (2) plan strategy; and (3) solve specific problems or plan to reach specific goals. Accordingly, managers consider the various value drivers (Wendee, 2011a, 2011b) that are available to them. Managers then use management tools to help identify and consider the appropriate value drivers. Management tools are also used to implement the general strategies, the problem-solving strategies, and value creation strategies identified in the review of the value creation process. This process continues as one “works up the value driver chain” (Wendee, 2011a, 2011b). While this describes the value creation process, which is a financial concept, it is the essence of strategic management as well. Each of the components that are normally considered in strategic management studies are incorporated in some way in the value creation process. And again, the ultimate goal of strategic management is to create value for shareholders. Strategic management, and all of its components, is how that is done. Indeed, because shareholder value creation is the ultimate goal that every manager pursues, the purpose of strategic management is to help managers reach the value creation goal – it is why we do strategic management. And it is why we should view strategic management through a financial lens.

This is a very brief, introductory overview of the concept. I am working on this concept for possible inclusion in a journal or other publication. I will provide more information on this new framework for Strategic Management as it develops.

References

Damodaran, A. (2011). The Little Book of Valuation: How to Value a Company, Pick a Stock, and Profit. Hoboken, New Jersey, John Wiley & Sons, Inc.

Ehrhardt, M. C. and E. F. Brigham (2017). Financial Management: Theory and Practice. Mason OH, South-Western Cengage Learning.

Mackey, J. and K. O’Leary (2019). Libertarian Duel in the Vegas Sun. FreedomFest, Las Vegas.

Mackey, J. and R. Sisodia (2014). Conscious capitalism: Liberating the heroic spirit of business. Boston, Harvard Business School Publishing Corporation.

Wendee, P. M. (2011). A theory of value drivers: A grounded theory study. School of Advanced Studies. Phoenix, University of Phoenix. DBA: 311.

Wendee, P. M. (2011). “Think strategically, think Value: The complete handbook for creating, sustaining, analyzing, and investing in enterprise value.” 2019, from http://ivwealthreport.com/.

Economic and Investment Highlights

Last Week

Business executives and banks have become less hopeful of a quick economic recovery, now expecting the recovery to take years instead of months.

Many colleges are cutting varsity teams as they experience financial strains.

Cities across America are facing increasing pressure from Covid-19, anger over policing practices, and strained budgets.

LinkedIn is cutting 6% of its workforce.

Trump urged Americans to wear masks in remarks where he said the pandemic is likely to worsen.

The U.S. housing market is showing signs of recovery as consumers take advantage of record-low mortgage rates.

The U.S. ordered China to close its embassy in Houston over allegations of economic espionage and visa fraud. China retaliated by ordering a U.S. consulate in China to close. Both sides called for an end to this feud.

Many small businesses are cutting staff or closing their doors as a result of the pandemic.

Initial jobless claims last week rose for the first time in 4 months.

Ann Taylor parent Ascena filed for bankruptcy.

South Korea fell into a recession in the second quarter.

U.S. coronavirus cases rose above 4 million. The death toll from the coronavirus exceeded 145,000.

Schlumberger is cutting 21,000 jobs.

Gold prices hit a record close of $1,897.50.

The Dow, the S&P 500, and the Nasdaq all fell for the week. The Dow was down 0.8%; the S&P 500 was down 0.28%; and the Nasdaq was down 1.3%. The 10-year treasury yield ended the week at 0.589%. Gold closed at $1,897.30 for the week. Oil closed at $41.29 for the week.

The Week Ahead

This link takes you to Econoday’s Economic Calendar and Economic Events and Analysis which shows the upcoming economic reporting events scheduled in the week and months ahead.

Summary

Note: The models below may not capture the impact of COVID-19 beyond their impact on GDP source data and relevant economic reports that have already been released. They may not anticipate the impact of COVID-19 on forthcoming economic reports beyond the standard internal dynamics of the models.

Note: The comments that follow are derived from the economic indicators referenced in the Resources section of this newsletter and other sources in this report.

The Aruoba-Diebold-Scotti Business Conditions Index (ALS) had been trending up for several weeks from having dipped in 2019. Recently with the advent of the economic collapse, the index crashed. It has now been generally trending up again, but fluctuating within a narrow band. This is a positive indicator for the economy on a short-term basis.

The GDPNow model estimate for real GDP growth (seasonally adjusted annual rate) in the second quarter of 2020 is -34.5 percent. This reading differs from the ALS model assessment of an improving short-term economic environment.

The New York Fed Staff Nowcast stands at -14.3% for 2020:Q2 and 13.2 for 2020:Q3.

The Chicago Fed National Activity Index (CFNAI) showed a decrease in economic activity in April. The Chicago Fed National Activity Index (CFNAI) was +4.11 in June, up from +3.50 in May.

All told, these short-term economic indicators are a mixed analysis for the economy, at least on a short-term basis.

Expectations that stock prices will rise over the next six months is now at 30.8% in a recent AAII Sentiment Survey. The historical average is 38.0% for the survey. 23.8% of the investors in the survey described their short-term outlook as neutral and 45.4% were bearish. Please see the AAII Sentiment Survey for the complete results.

The latest Gross Output (GO) reading (July 6, 2020) showed that Gross Output slowed significantly in the first quarter of 2020.

On a longer-term basis, the forecasters in the Philadelphia Fed’s Survey of Professional Forecasters (as of May 15, 2020) predict real GDP will contract at an annual rate of -32.2 percent for the second quarter of 2020; and increase at 10.6 percent for the third quarter of 2020, 6.5 percent in the fourth quarter of 2020, 6.8 percent in the first quarter of 2021, and 4.1 percent in the second quarter of 2021. On an annual-average over annual-average basis, the forecasters predict real GDP to contract -5.6 percent in 2020; and grow 3.1 percent in 2021, 4.1 percent in 2022 and 2.2 percent in 2023. The forecasters predict the unemployment rate will be above 10.0 percent over the next three quarters (16.1 percent in Q2, 12.9 percent in Q3, and 11.0 percent in Q4); will be 10.8 percent in 2020; 8.1 percent in 2021, 6.2 percent in 2022, and 5.1 percent in 2023. The next survey release date is August 14, 2020.

The National Association for Business Economics (NABE) released an Outlook Flash Survey on April 10, 2020. The NABE panel expects GDP declines in Q1 2020 and Q2 2020, and upticks in Q3 2020 and Q4 2020. The panel believes the U.S. economy is already in a recession and predicts real GDP will grow at an annual rate of -2.4 percent for the first quarter of 2020, -26.5 percent for the second quarter of 2020, 2.0 percent in the third quarter of 2020, 5.8 percent in the fourth quarter of 2020, and 6.0 percent in the first quarter of 2021. The forecasters expect unemployment to average 3.8% in Q1 2020. The median unemployment rate projection for Q2 2020 is 12.0%. The unemployment rate is expected to fall back to 9.5% at the end of 2020, and to 6.0% at year-end 2021. The panel’s forecast for the PCE price index less food and energy calls for a slowdown in the annual rate of change from 1.7% in Q1 to 0.8% in Q2 2020. The panel expects the rate to increase gradually to 1.7% in the last half of 2021.

For a more in-depth review and analysis of the economy, please see our mini-book on economic analysis and forecasting entitled: Simple and Effective Economic Forecasting.

Stock Market Valuations

Our estimates of the market valuations for two stock market indices, the Dow Jones Industrial Average (DJIA) and the Standard & Poor’s 500 (S&P 500), can be found in the file below:

Conclusion

During this time of global flux due to the coronavirus, I am leaving the Conclusion discussion below the same as was posted on March 23, 2020. The March 23, 2020 discussion still adequately reflects my thinking on the current state of affairs.

Important Note: While I don’t believe it is time to jump back into the stock market in a big way because of the market’s overvaluation, I have been advising the last few of weeks in this Commentary and in my weekly podcast, Intrinsic Value Wealth Report Radio, that investors can continue building their investment portfolios by selecting individual securities that offer growth and value opportunities.

Reprinted from March 23, 2020

Up until the past week, the economy had been in a stable but somewhat vulnerable state. Nonetheless, it had remained fairly strong. In fact, robust consumer spending and strong labor market conditions had given us confidence that the economy, which had been in its tenth year of expansion, could continue to grow. But we were cautious on this outlook. There were several reasons for our caution. U.S. business growth had been mixed. And global economic growth had been mixed as well. The new coronavirus was becoming a global economic threat, although it was still too early to tell how much of an effect it would ultimately have. Debt is at high levels for consumers, businesses, and government (at all levels of government). Finally, this is an election year that will likely have significant consequences either positively or negatively depending on the outcome of the elections. And of course, it is still too early to tell what the outcome of the elections will be.

In just a few days, the coronavirus’s effect on the economy and the markets went from a ripple to a tsunami. Businesses are shuttering, events are being cancelled or postponed, grocery store shelves are empty, and people are being asked or ordered to stay home. The markets are now deep in bear market territory. The effects on the economy, even given the short time that the economy has been retreating, may be with us for a long time. There is now a much greater risk of a recession, and there has even been some talk of a depression. The government, the Fed, Republicans, and Democrats, and pretty much the entire country, is trying to get the virus under control and is coming up with plans to mitigate the long-term economic effects caused by the virus. But the virus has impacted the economy – in a significant way – in just a short time. How long lasting the effects will be no one can tell right now. The economy has been largely shut down and remains so today. It takes time to restart the economy after a situation such as what is occurring at the present time.

Given these events and the rapidly deteriorating situation, as I said last week, I would caution not to panic. The economy and the markets will get better. The situation is bad – there is no doubt about that – but it will turn around. The real question is when will it turn around? No one knows that at the present time. But it will turn around.

For now, review your investment portfolios. It is highly likely that all or most of your stocks are down. You should not consider selling the bulk of your stocks – only consider selling companies that are not sound companies. But do recognize that as the economy deteriorates, even good companies will be affected.

For stock market value hunters, we believe it is still too early to jump back in. We will be closely monitoring the markets using the many tools and models that we have developed over the years to assess the economy and the markets. We will use our best judgement and thoughts to let you know when we believe things are turning around. The turnaround hasn’t happened yet.

We believe it is important to maintain a long-term view toward investing. But for now, just sit tight. Eventually, this means that you should continue building your investment portfolio using the Cassandra Stock Selection Model to select individual securities that offer growth and value opportunities.

Chart for Review and Thought

Gold Prices

Simple and Effective Economic Forecasting Model

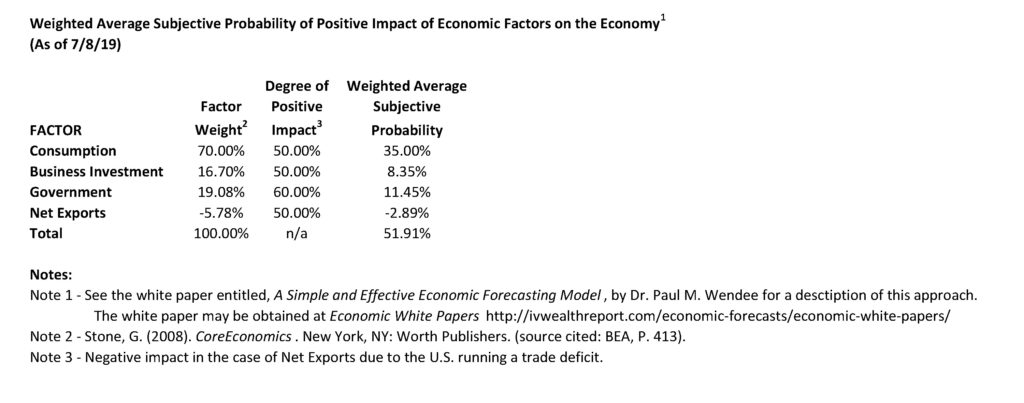
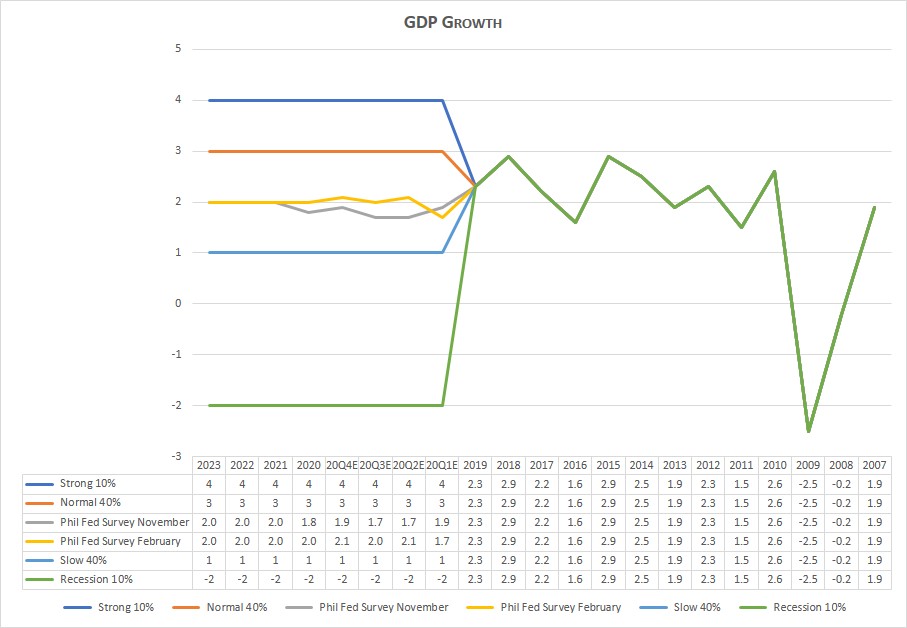
Note: The table and chart below have not been updated. However, we believe that a recession is quite likely. In the chart below, the bottom green line shows what a recession could look like.
Notes (GDP Growth Chart):

  1. See the July 8, 2019 Commentary for an introduction to this model.
  2. Actual numbers 2007 through 2019; forecasted numbers thereafter.
  3. Normal GDP growth is typically in the 2% to 3% range.
  4. A recession is generally defined as two consecutive quarters of negative economic growth as measured by a country’s gross domestic product (GDP).

Thought for the Week

Referring to the coronavirus: “Florida is catching up, but California is still ahead of them. Go Bears!!!” ~ Anonymous

Announcements

The Intrinsic Value Wealth Report has started a new YouTube channel called Intrinsic Value Wealth Report TV. You can view the YouTube channel at Intrinsic Value Wealth Report TV.

The Intrinsic Value Wealth Report has started a new podcast called Intrinsic Value Wealth Report Radio. You can listen to the podcast at Intrinsic Value Wealth Report Radio.

Dr. Wendee spoke at the Investment Club of America’s annual economic summit, called Econosummit, on Sunday March 1, 2020 in Las Vegas.

Dr. Wendee attended the The National Due Diligence Alliance (TNDDA) investment banking conference, which was held March 6-8, 2020 at the Four Seasons Resort in Dallas, Texas. This is a conference held several times throughout the year for investment bankers and registered investment advisers to learn about new opportunities in the Alternative Investment asset classes.

TNDDA Meeting in Dallas, Texas

We have been researching the use of crowdsourcing for investment ideas. We will be sending a survey out in the next few weeks to get your input on the economy and the markets; and to get any investment ideas that you would like to share. We will compile this input and distribute the results to you and our other subscribers. We have been testing our crowdsourcing models with students and have been having good success and results.

Dr. Wendee has been researching and writing a new theory of economics known as, The Value Creation Theory of the Economy (also known as, Intrinsinomics). The full paper on Intrinsinomics will be published in the near future.

Finance 3350: Personal Finance-Portfolio & Risk Management– Dr. Wendee started teaching Finance 3350 – Portfolio & Risk Management at California State University, Los Angeles (CSULA) for the Summer term starting May 2020. Dr. Wendee teaches courses in Management and Finance at CSULA.

Business 548: Strategy and Decision Making – Dr. Wendee will be teaching Business 548 – Strategy and Decision Making at California Baptist University (CBU) starting at the end of June 2020. Dr. Wendee teaches courses in Finance, Business, Strategy & Decision Making, and Economics at CBU.

Dr. Wendee presented a paper on his new theory of economics known as, The Value Creation Theory of the Economy (also known as, Intrinsinomics), at the International Leadership Association’s annual global conference which was held in Ottawa, Canada last Fall.

Dr. Wendee will present an updated paper on his new theory of economics known as, The Value Creation Theory of the Economy (also known as, Intrinsinomics), at the International Leadership Association’s annual global conference which will be held in San Francisco, California in November.

Dr. Wendee is working on a financial planning modeling program which will be available in the near future. The modeling program is designed to assist anyone in creating a financial plan and is customizable for each person’s unique financial planning goals. A working draft of the model is currently in beta test with students. Click this link, schematic, to go to the clickable document under the subheading Financial Planning Process (Draft) in the Intrinsic Value Wealth Report to see a draft of the schematic for the new financial planning process.

Dr. Wendee has been developing an econometric model specifically designed to monitor and forecast the global economy as this current economic crisis unfolds. This new econometric model is based on other econometric models that he has designed and have used for many years. You can find some of these earlier models in Book # 6 – Simple and Effective Economic Forecasting in the sister website to this website which is called the Intrinsic Value Wealth Report. The new econometric model has been constructed with some additional tools and methods that he has learned and some that he has developed over the last several years. He will be talking more about this new econometric model in this Commentary over the next few months. His comments and forecasts on the economy and the markets going forward will be based to a significant extent on this new model.

We have begun raising capital for our fund-of-funds investment, Northwest Quadrant Opportunity Fund, LLC. The fund engineers and constructs an investment vehicle consisting of Alternative Asset investments. The fund’s objective is to build a diversified portfolio of strong, solid, steady- performing assets, with highly qualified asset managers who have proven track records that meet our underwriting requirements. To learn more about the Northwest Quadrant Opportunity Fund, LLC and to obtain an offering memorandum, please click Northwest Quadrant Opportunity Fund, LLC.

Intrinsic Value Wealth Creation pyramid

We always conclude our commentary with a discussion of the Intrinsic Value Wealth Creation Pyramid. The Intrinsic Value Wealth Creation Pyramid is designed to show some of the major categories for building wealth. It is the result of many years of study of the wealth building process; experience working with clients who have built considerable wealth; and my own personal experience building wealth. Newsletter subscribers should consult the Intrinsic Value Wealth Creation Pyramid as one of many useful investment tools while considering their investment plans.

The chart in this section is an expanded version of the Intrinsic Value Wealth Creation Pyramid Chart referenced in the Forbes.com article entitled, Nine Of The Best Ways To Build Wealth.

RESOURCES

See our Resources section for links to economic and other resources used in the preparation of this Commentary.

Posted in Economic & Business Chart Room, Economic Outlook, Entrepreneurship, Focus List, Investment Recommendations, Investments, Notes From The Field, Special Situations, Uncategorized, VDI/REEP, Visionary Ideas | Tagged , , , , , , , , , , , , , , , , , , , , , , , , , , , , , , , , , | Comments Off on WEEKLY COMMENTARY July 27, 2020

WEEKLY COMMENTARY July 20, 2020

Can Business Solve the Covid-19 Containment Problem?

People around the world have taken sides on the Covid-19 issue. Most health experts and most governments contend that Covid-19 is a real problem. Those that believe it is a real problem agree for the most part that preventative measures must be taken to contain the spread of the virus. But to be fair, not everyone agrees that Covid-19 is a real problem; and not everyone is in agreement about the best way to stop the spread.

What to do about Covid-19 has become an enormous political battle across the globe. For those in the camp that believe that Covid-19 is a significant health threat, the consensus is that masks and social distancing are the answer, along with a variety of other measures. For many people though, the Covid-19 issue is more complex. There are many who believe that governments are encroaching on the freedoms and rights of citizens. Along these lines, some even believe in conspiracy theories. Many believe that standing up to the virus is a demonstration of one’s masculinity. And there are a host of other beliefs and opinions about the Covid-19 situation.

Regardless of where one stands on the Covid-19 issue, what is obvious by the increasing number of new cases of the virus and the demonstrated lack of compliance and respect for the safeguards that have been mandated, what governments have been doing is not working in many places around the world. This is particularly true for many places in the United States. The U.S. alone just passed 3 million cases and is nearing the 4 million mark. Here in California, compliance is a major problem. California Governor Newsome has reinstituted closures and other measures in an attempt to get California’s case count under control. But I’m not sure that is the answer, as people haven’t been complying enough with the measures that had been and are currently in place. So what is the answer?

As I was contemplating all of this, I began to wonder if business might be the answer. According to Mankiw (2018): “The invisible hand [Adam Smith] takes all the information about buyers and sellers into account and guides everyone in the market to the best outcome as judged by the standard of economic efficiency. It is truly a remarkable feat. That is why economists so often advocate free markets as the best way to organize economic activity” (p. 146). Containing the virus certainly can be considered an economic activity, particularly as the pandemic has had the greatest negative effect on the economy in probably one hundred years. Furthermore, in a debate at FreedomFest (Mackey & O’Leary, 2019) last year with Kevin O’Leary, John Mackey, CEO and co-founder of Whole Foods, noted that businesses should take on more of a societal problem-solving role because businesses are good at solving problems.

To help explore this avenue of inquiry, I am sending out a survey. If you would like to participate in the survey, go to this link: https://www.surveymonkey.com/r/ZLKSBK6. You can also contact me at pwendee@pmwassoc.com (please put “Survey on Business Solutions to Coronavirus” in the subject line). We will report the results of the survey in a future lead article in this newsletter.

References

Mackey, J. and K. O’Leary (2019). Libertarian Duel in the Vegas Sun. FreedomFest, Las Vegas.

Mankiw, N. G. (2018). Principles of Microeconomics. Boston, Cengage.

Economic and Investment Highlights

Last Week

The biggest U.S. banks are expecting a big hit to earnings from their lending operations and are preparing for a wave of loan defaults.

Violent crime is spiking in several large cities across the U.S.

The U.S. budget deficit was $3 trillion in the twelve months ended in June. This puts the budget deficit on track to be the largest since World War II.

The Fed’s Kaplan said recent economic data point to a slowing recovery as Covid-19 cases surge.

California imposed new restrictions as the number of Covid-19 cases surges in the State.

Ford and GM are struggling with worker absences as the coronavirus surges.

Inflation picked up in June, rising 0.6%. Prices had been declining, causing fears of deflation as the economy deteriorates.

Chinese imports from the U.S. rose in June, the first time since the coronavirus began.

China’s economy grew 3.2% in the second quarter from a year earlier, the first major country to resume growth since the pandemic began.

The average mortgage rate on 30-year fixed rate mortgages fell to a 50-year low (the lowest on record) of 2.98%.

Retail sales rose 7.5% in June amid concerns that a rise in covid-19 cases will curb job growth and retail sales going forward.

The U.S. labor market is showing signs of losing momentum amid a rise in Covid-19 cases.

The Dow and the S&P 500 rose for the week, while the Nasdaq declined. The Dow was up 2.3%; the S&P 500 was up 1.25%; and the Nasdaq was down 1.1%. The 10-year treasury yield ended the week at 0.628%. Gold closed at $1,808.30 for the week. Oil closed at $40.59 for the week.

The Week Ahead

This link takes you to Econoday’s Economic Calendar and Economic Events and Analysis which shows the upcoming economic reporting events scheduled in the week and months ahead.

Summary

Note: The models below may not capture the impact of COVID-19 beyond their impact on GDP source data and relevant economic reports that have already been released. They may not anticipate the impact of COVID-19 on forthcoming economic reports beyond the standard internal dynamics of the models.

Note: The comments that follow are derived from the economic indicators referenced in the Resources section of this newsletter and other sources in this report.

The Aruoba-Diebold-Scotti Business Conditions Index (ALS) had been trending up for several weeks from having dipped in 2019. Recently with the advent of the economic collapse, the index crashed. It has now been generally trending up again, but fluctuating within a narrow band. This is a positive indicator for the economy on a short-term basis.

The GDPNow model estimate for real GDP growth (seasonally adjusted annual rate) in the second quarter of 2020 is -34.5 percent. This reading differs from the ALS model assessment of an improving short-term economic environment.

The New York Fed Staff Nowcast stands at -14.3% for 2020:Q2 and 13.2 for 2020:Q3.

The Chicago Fed National Activity Index (CFNAI) showed a decrease in economic activity in April. The Chicago Fed National Activity Index (CFNAI) was 2.61 in May, up from -17.89 in April.

All told, these short-term economic indicators are a mixed analysis for the economy, at least on a short-term basis.

Expectations that stock prices will rise over the next six months is now at 30.8% in a recent AAII Sentiment Survey. The historical average is 38.0% for the survey. 23.8% of the investors in the survey described their short-term outlook as neutral and 45.4% were bearish. Please see the AAII Sentiment Survey for the complete results.

The latest Gross Output (GO) reading (July 6, 2020) showed that Gross Output slowed significantly in the first quarter of 2020.

On a longer-term basis, the forecasters in the Philadelphia Fed’s Survey of Professional Forecasters (as of May 15, 2020) predict real GDP will contract at an annual rate of -32.2 percent for the second quarter of 2020; and increase at 10.6 percent for the third quarter of 2020, 6.5 percent in the fourth quarter of 2020, 6.8 percent in the first quarter of 2021, and 4.1 percent in the second quarter of 2021. On an annual-average over annual-average basis, the forecasters predict real GDP to contract -5.6 percent in 2020; and grow 3.1 percent in 2021, 4.1 percent in 2022 and 2.2 percent in 2023. The forecasters predict the unemployment rate will be above 10.0 percent over the next three quarters (16.1 percent in Q2, 12.9 percent in Q3, and 11.0 percent in Q4); will be 10.8 percent in 2020; 8.1 percent in 2021, 6.2 percent in 2022, and 5.1 percent in 2023. The next survey release date is August 14, 2020.

The National Association for Business Economics (NABE) released an Outlook Flash Survey on April 10, 2020. The NABE panel expects GDP declines in Q1 2020 and Q2 2020, and upticks in Q3 2020 and Q4 2020. The panel believes the U.S. economy is already in a recession and predicts real GDP will grow at an annual rate of -2.4 percent for the first quarter of 2020, -26.5 percent for the second quarter of 2020, 2.0 percent in the third quarter of 2020, 5.8 percent in the fourth quarter of 2020, and 6.0 percent in the first quarter of 2021. The forecasters expect unemployment to average 3.8% in Q1 2020. The median unemployment rate projection for Q2 2020 is 12.0%. The unemployment rate is expected to fall back to 9.5% at the end of 2020, and to 6.0% at year-end 2021. The panel’s forecast for the PCE price index less food and energy calls for a slowdown in the annual rate of change from 1.7% in Q1 to 0.8% in Q2 2020. The panel expects the rate to increase gradually to 1.7% in the last half of 2021.

For a more in-depth review and analysis of the economy, please see our mini-book on economic analysis and forecasting entitled: Simple and Effective Economic Forecasting.

Stock Market Valuations

Our estimates of the market valuations for two stock market indices, the Dow Jones Industrial Average (DJIA) and the Standard & Poor’s 500 (S&P 500), can be found in the file below:

Conclusion

During this time of global flux due to the coronavirus, I am leaving the Conclusion discussion below the same as was posted on March 23, 2020. The March 23, 2020 discussion still adequately reflects my thinking on the current state of affairs.

Important Note: While I don’t believe it is time to jump back into the stock market in a big way because of the market’s overvaluation, I have been advising the last few of weeks in this Commentary and in my weekly podcast, Intrinsic Value Wealth Report Radio, that investors can continue building their investment portfolios by selecting individual securities that offer growth and value opportunities.

Reprinted from March 23, 2020

Up until the past week, the economy had been in a stable but somewhat vulnerable state. Nonetheless, it had remained fairly strong. In fact, robust consumer spending and strong labor market conditions had given us confidence that the economy, which had been in its tenth year of expansion, could continue to grow. But we were cautious on this outlook. There were several reasons for our caution. U.S. business growth had been mixed. And global economic growth had been mixed as well. The new coronavirus was becoming a global economic threat, although it was still too early to tell how much of an effect it would ultimately have. Debt is at high levels for consumers, businesses, and government (at all levels of government). Finally, this is an election year that will likely have significant consequences either positively or negatively depending on the outcome of the elections. And of course, it is still too early to tell what the outcome of the elections will be.

In just a few days, the coronavirus’s effect on the economy and the markets went from a ripple to a tsunami. Businesses are shuttering, events are being cancelled or postponed, grocery store shelves are empty, and people are being asked or ordered to stay home. The markets are now deep in bear market territory. The effects on the economy, even given the short time that the economy has been retreating, may be with us for a long time. There is now a much greater risk of a recession, and there has even been some talk of a depression. The government, the Fed, Republicans, and Democrats, and pretty much the entire country, is trying to get the virus under control and is coming up with plans to mitigate the long-term economic effects caused by the virus. But the virus has impacted the economy – in a significant way – in just a short time. How long lasting the effects will be no one can tell right now. The economy has been largely shut down and remains so today. It takes time to restart the economy after a situation such as what is occurring at the present time.

Given these events and the rapidly deteriorating situation, as I said last week, I would caution not to panic. The economy and the markets will get better. The situation is bad – there is no doubt about that – but it will turn around. The real question is when will it turn around? No one knows that at the present time. But it will turn around.

For now, review your investment portfolios. It is highly likely that all or most of your stocks are down. You should not consider selling the bulk of your stocks – only consider selling companies that are not sound companies. But do recognize that as the economy deteriorates, even good companies will be affected.

For stock market value hunters, we believe it is still too early to jump back in. We will be closely monitoring the markets using the many tools and models that we have developed over the years to assess the economy and the markets. We will use our best judgement and thoughts to let you know when we believe things are turning around. The turnaround hasn’t happened yet.

We believe it is important to maintain a long-term view toward investing. But for now, just sit tight. Eventually, this means that you should continue building your investment portfolio using the Cassandra Stock Selection Model to select individual securities that offer growth and value opportunities.

Chart for Review and Thought

Some People Are Complying, Others Not

Simple and Effective Economic Forecasting Model

Note: The table and chart below have not been updated. However, we believe that a recession is quite likely. In the chart below, the bottom green line shows what a recession could look like.

Notes (GDP Growth Chart):

  1. See the July 8, 2019 Commentary for an introduction to this model.
  2. Actual numbers 2007 through 2019; forecasted numbers thereafter.
  3. Normal GDP growth is typically in the 2% to 3% range.
  4. A recession is generally defined as two consecutive quarters of negative economic growth as measured by a country’s gross domestic product (GDP).

Thought for the Week

“Face coverings work. It’s our major defense to prevent ourselves from getting this infection. If all of us would put on a face covering now for the next four to six weeks, I think we could drive this epidemic to the ground in this country” ~ Robert Redfield, Director of the CDC

Announcements

The Intrinsic Value Wealth Report has started a new YouTube channel called Intrinsic Value Wealth Report TV. You can view the YouTube channel at Intrinsic Value Wealth Report TV.

The Intrinsic Value Wealth Report has started a new podcast called Intrinsic Value Wealth Report Radio. You can listen to the podcast at Intrinsic Value Wealth Report Radio.

Dr. Wendee spoke at the Investment Club of America’s annual economic summit, called Econosummit, on Sunday March 1, 2020 in Las Vegas.

Dr. Wendee attended the The National Due Diligence Alliance (TNDDA) investment banking conference, which was held March 6-8, 2020 at the Four Seasons Resort in Dallas, Texas. This is a conference held several times throughout the year for investment bankers and registered investment advisers to learn about new opportunities in the Alternative Investment asset classes.

TNDDA Meeting in Dallas, Texas

We have been researching the use of crowdsourcing for investment ideas. We will be sending a survey out in the next few weeks to get your input on the economy and the markets; and to get any investment ideas that you would like to share. We will compile this input and distribute the results to you and our other subscribers. We have been testing our crowdsourcing models with students and have been having good success and results.

Dr. Wendee has been researching and writing a new theory of economics known as, The Value Creation Theory of the Economy (also known as, Intrinsinomics). The full paper on Intrinsinomics will be published in the near future.

Finance 3350: Personal Finance-Portfolio & Risk Management– Dr. Wendee started teaching Finance 3350 – Portfolio & Risk Management at California State University, Los Angeles (CSULA) for the Summer term starting May 2020. Dr. Wendee teaches courses in Management and Finance at CSULA.

Business 548: Strategy and Decision Making – Dr. Wendee will be teaching Business 548 – Strategy and Decision Making at California Baptist University (CBU) starting at the end of June 2020. Dr. Wendee teaches courses in Finance, Business, Strategy & Decision Making, and Economics at CBU.

Dr. Wendee presented a paper on his new theory of economics known as, The Value Creation Theory of the Economy (also known as, Intrinsinomics), at the International Leadership Association’s annual global conference which was held in Ottawa, Canada last Fall.

Dr. Wendee will present an updated paper on his new theory of economics known as, The Value Creation Theory of the Economy (also known as, Intrinsinomics), at the International Leadership Association’s annual global conference which will be held in San Francisco, California in November.

Dr. Wendee is working on a financial planning modeling program which will be available in the near future. The modeling program is designed to assist anyone in creating a financial plan and is customizable for each person’s unique financial planning goals. A working draft of the model is currently in beta test with students. Click this link, schematic, to go to the clickable document under the subheading Financial Planning Process (Draft) in the Intrinsic Value Wealth Report to see a draft of the schematic for the new financial planning process.

Dr. Wendee has been developing an econometric model specifically designed to monitor and forecast the global economy as this current economic crisis unfolds. This new econometric model is based on other econometric models that he has designed and have used for many years. You can find some of these earlier models in Book # 6 – Simple and Effective Economic Forecasting in the sister website to this website which is called the Intrinsic Value Wealth Report. The new econometric model has been constructed with some additional tools and methods that he has learned and some that he has developed over the last several years. He will be talking more about this new econometric model in this Commentary over the next few months. His comments and forecasts on the economy and the markets going forward will be based to a significant extent on this new model.

We have begun raising capital for our fund-of-funds investment, Northwest Quadrant Opportunity Fund, LLC. The fund engineers and constructs an investment vehicle consisting of Alternative Asset investments. The fund’s objective is to build a diversified portfolio of strong, solid, steady- performing assets, with highly qualified asset managers who have proven track records that meet our underwriting requirements. To learn more about the Northwest Quadrant Opportunity Fund, LLC and to obtain an offering memorandum, please click Northwest Quadrant Opportunity Fund, LLC.

Intrinsic Value Wealth Creation pyramid

We always conclude our commentary with a discussion of the Intrinsic Value Wealth Creation Pyramid. The Intrinsic Value Wealth Creation Pyramid is designed to show some of the major categories for building wealth. It is the result of many years of study of the wealth building process; experience working with clients who have built considerable wealth; and my own personal experience building wealth. Newsletter subscribers should consult the Intrinsic Value Wealth Creation Pyramid as one of many useful investment tools while considering their investment plans.

The chart in this section is an expanded version of the Intrinsic Value Wealth Creation Pyramid Chart referenced in the Forbes.com article entitled, Nine Of The Best Ways To Build Wealth.

RESOURCES

See our Resources section for links to economic and other resources used in the preparation of this Commentary.

Posted in Economic & Business Chart Room, Economic Outlook, Entrepreneurship, Focus List, Investment Recommendations, Investments, Notes From The Field, Special Situations, Uncategorized, VDI/REEP, Visionary Ideas | Tagged , , , , , , , , , , , , , , , , , , , , , , , , , , , , , , , , , | Comments Off on WEEKLY COMMENTARY July 20, 2020

WEEKLY COMMENTARY July 13, 2020

Is the Stock Market a System 1 Thinker?

In my class on Strategy and Decision Making that I teach at California Baptist University, we have been studying the System 1 and System 2 thinking that characterizes the way that people think. According to Tetlock (2015), “System 2 is the familiar realm of conscious thought. It consists of everything we choose to focus on. By contrast, System 1 is largely a stranger to us. It is the realm of automatic perceptual and cognitive operations…System 1 comes first. It is fast and constantly running in the background. If a question is asked and you instantly know the answer, it sprang from System 1. System 2 is charged with interrogating that answer.” In his research on forecasting, Tetlock is particularly interested in System 1 and System 2 thinking because: “Forecasters often use conscious System 2 reflection to catch mistakes arising from a rapid, unconscious System 1 operations” (Tetlock, 2015).

Psychologist Daniel Kahneman (2011), who won the Nobel Prize in Economics for his work in the realm of System 1 and System 2 thinking, describes this type of thinking as “a two-system approach to judgement and choice…[which] elaborates the distinction between the automatic operations of System 1 and the controlled operations of System 2” (p. 13).

While discussing with the class one evening the valuation of the stock market and in a separate discussion that evening how System 1 and System 2 thinking works, it occurred to me that the stock market is a reflection of the dichotomy of System 1 and System 2 thinking. As I show in the chart below under Charts for Review and Thought, the long-term calculation of the market’s Intrinsic Value Line, with the market price fluctuating around the Intrinsic Value Line, graphically depicts that dichotomy. The calculation of the Intrinsic Value Line reflects System 2 thinking, whereas the daily market fluctuations around that line reflect System 1 thinking.  This dichotomy exists whether it is for the market as a whole or for an individual stock. Please click Intrinsic Value Line for a discussion of the Intrinsic Value Line concept. This attribution of System 1 and System 2 thinking to the stock market is a new concept that I am currently exploring, but the more I think about it, I believe it at least in part explains how the markets work from a psychological perspective.

References

Kahneman, D. (2011). Thinking, fast and slow. New York, Farrar, Straus and Giroux.

Tetlock, P. E. and D. Gardner (2015). Superforecasting: The art and science of prediction. New York, Crown Publishing.

Economic and Investment Highlights

Last Week

Duke Energy and Dominion Energy are abandoning the proposed $8 billion Atlantic Coast Pipeline, citing regulatory delays and uncertainty.

The used-car market is doing better than it was before the pandemic.

Clothing retailer Lucky Brand filed for bankruptcy.

Airlines are preparing to cut thousands of workers. United Airlines is exploring the possibility of cutting half of its U.S. workforce.

The U.S. formally notified the WHO it is withdrawing from the U.N. agency.

Brazil’s President Jair Bolsonaro has tested positive for Covid-19.

Brooks Brothers filed for bankruptcy while it seeks a new owner.

The U.S. budget deficit totaled $863 billion in June. This was almost as much as the entire deficit for all of fiscal 2019.

The U.S. passed 3 million cases of coronavirus and continued at an accelerating pace.

Unemployment claims fell slightly last week.

Walgreens Boots plans to cut 4,000 jobs in the U.K.

Carnival expects to reduce its fleet by 13 ships, representing 9 percent of its capacity.

AMC’s investors agreed to put $300 million of new money into the company to help it restart its business.

The Dow, the S&P 500, and the Nasdaq rose for the week. The Dow was up 1.0%; the S&P 500 was up 1.76%; and the Nasdaq was up 4.0%. The 10-year treasury yield ended the week at 0.633%. Gold closed at $1,798.20 for the week. Oil closed at $40.55 for the week.

The Week Ahead

This link takes you to Econoday’s Economic Calendar and Economic Events and Analysis which shows the upcoming economic reporting events scheduled in the week and months ahead.

Summary

Note: The models below may not capture the impact of COVID-19 beyond their impact on GDP source data and relevant economic reports that have already been released. They may not anticipate the impact of COVID-19 on forthcoming economic reports beyond the standard internal dynamics of the models.

Note: The comments that follow are derived from the economic indicators referenced in the Resources section of this newsletter and other sources in this report.

The Aruoba-Diebold-Scotti Business Conditions Index (ALS) had been trending up for several weeks from having dipped in 2019. Recently with the advent of the economic collapse, the index crashed. It has now been trending up again.This is a positive indicator for the economy on a short-term basis.

The GDPNow model estimate for real GDP growth (seasonally adjusted annual rate) in the second quarter of 2020 is -34.5 percent. This reading differs from the ALS model assessment of an improving short-term economic environment.

The New York Fed Staff Nowcast stands at -14.3% for 2020:Q2 and 13.2 for 2020:Q3.

The Chicago Fed National Activity Index (CFNAI) showed a decrease in economic activity in April. The Chicago Fed National Activity Index (CFNAI) was 2.61 in May, up from -17.89 in April.

All told, these short-term economic indicators are a mixed analysis for the economy, at least on a short-term basis.

Expectations that stock prices will rise over the next six months is now at 30.8% in a recent AAII Sentiment Survey. The historical average is 38.0% for the survey. 23.8% of the investors in the survey described their short-term outlook as neutral and 45.4% were bearish. Please see the AAII Sentiment Survey for the complete results.

The latest Gross Output (GO) reading (April 6, 2020) showed that Gross Output slowed significantly in the fourth quarter of 2019.

On a longer-term basis, the forecasters in the Philadelphia Fed’s Survey of Professional Forecasters (as of May 15, 2020) predict real GDP will contract at an annual rate of -32.2 percent for the second quarter of 2020; and increase at 10.6 percent for the third quarter of 2020, 6.5 percent in the fourth quarter of 2020, 6.8 percent in the first quarter of 2021, and 4.1 percent in the second quarter of 2021. On an annual-average over annual-average basis, the forecasters predict real GDP to contract -5.6 percent in 2020; and grow 3.1 percent in 2021, 4.1 percent in 2022 and 2.2 percent in 2023. The forecasters predict the unemployment rate will be above 10.0 percent over the next three quarters (16.1 percent in Q2, 12.9 percent in Q3, and 11.0 percent in Q4); will be 10.8 percent in 2020; 8.1 percent in 2021, 6.2 percent in 2022, and 5.1 percent in 2023. The next survey release date is August 14, 2020.

The National Association for Business Economics (NABE) released an Outlook Flash Survey on April 10, 2020. The NABE panel expects GDP declines in Q1 2020 and Q2 2020, and upticks in Q3 2020 and Q4 2020. The panel believes the U.S. economy is already in a recession and predicts real GDP will grow at an annual rate of -2.4 percent for the first quarter of 2020, -26.5 percent for the second quarter of 2020, 2.0 percent in the third quarter of 2020, 5.8 percent in the fourth quarter of 2020, and 6.0 percent in the first quarter of 2021. The forecasters expect unemployment to average 3.8% in Q1 2020. The median unemployment rate projection for Q2 2020 is 12.0%. The unemployment rate is expected to fall back to 9.5% at the end of 2020, and to 6.0% at year-end 2021. The panel’s forecast for the PCE price index less food and energy calls for a slowdown in the annual rate of change from 1.7% in Q1 to 0.8% in Q2 2020. The panel expects the rate to increase gradually to 1.7% in the last half of 2021.

For a more in-depth review and analysis of the economy, please see our mini-book on economic analysis and forecasting entitled: Simple and Effective Economic Forecasting.

Stock Market Valuations

Our estimates of the market valuations for two stock market indices, the Dow Jones Industrial Average (DJIA) and the Standard & Poor’s 500 (S&P 500), can be found in the file below:

Conclusion

During this time of global flux due to the coronavirus, I am leaving the Conclusion discussion below the same as was posted on March 23, 2020. The March 23, 2020 discussion still adequately reflects my thinking on the current state of affairs.

Important Note: While I don’t believe it is time to jump back into the stock market in a big way because of the market’s overvaluation, I have been advising the last few of weeks in this Commentary and in my weekly podcast, Intrinsic Value Wealth Report Radio, that investors can continue building their investment portfolios by selecting individual securities that offer growth and value opportunities.

Reprinted from March 23, 2020

Up until the past week, the economy had been in a stable but somewhat vulnerable state. Nonetheless, it had remained fairly strong. In fact, robust consumer spending and strong labor market conditions had given us confidence that the economy, which had been in its tenth year of expansion, could continue to grow. But we were cautious on this outlook. There were several reasons for our caution. U.S. business growth had been mixed. And global economic growth had been mixed as well. The new coronavirus was becoming a global economic threat, although it was still too early to tell how much of an effect it would ultimately have. Debt is at high levels for consumers, businesses, and government (at all levels of government). Finally, this is an election year that will likely have significant consequences either positively or negatively depending on the outcome of the elections. And of course, it is still too early to tell what the outcome of the elections will be.

In just a few days, the coronavirus’s effect on the economy and the markets went from a ripple to a tsunami. Businesses are shuttering, events are being cancelled or postponed, grocery store shelves are empty, and people are being asked or ordered to stay home. The markets are now deep in bear market territory. The effects on the economy, even given the short time that the economy has been retreating, may be with us for a long time. There is now a much greater risk of a recession, and there has even been some talk of a depression. The government, the Fed, Republicans, and Democrats, and pretty much the entire country, is trying to get the virus under control and is coming up with plans to mitigate the long-term economic effects caused by the virus. But the virus has impacted the economy – in a significant way – in just a short time. How long lasting the effects will be no one can tell right now. The economy has been largely shut down and remains so today. It takes time to restart the economy after a situation such as what is occurring at the present time.

Given these events and the rapidly deteriorating situation, as I said last week, I would caution not to panic. The economy and the markets will get better. The situation is bad – there is no doubt about that – but it will turn around. The real question is when will it turn around? No one knows that at the present time. But it will turn around.

For now, review your investment portfolios. It is highly likely that all or most of your stocks are down. You should not consider selling the bulk of your stocks – only consider selling companies that are not sound companies. But do recognize that as the economy deteriorates, even good companies will be affected.

For stock market value hunters, we believe it is still too early to jump back in. We will be closely monitoring the markets using the many tools and models that we have developed over the years to assess the economy and the markets. We will use our best judgement and thoughts to let you know when we believe things are turning around. The turnaround hasn’t happened yet.

We believe it is important to maintain a long-term view toward investing. But for now, just sit tight. Eventually, this means that you should continue building your investment portfolio using the Cassandra Stock Selection Model to select individual securities that offer growth and value opportunities.

Chart for Review and Thought

Intrinsic Value Line, System 1, and System 2 Thinking

Intrinsic Value Line = System 2 Thinking; Market Price = System 1 Thinking

Simple and Effective Economic Forecasting Model

Note: The table and chart below have not been updated. However, we believe that a recession is quite likely. In the chart below, the bottom green line shows what a recession could look like.

Notes (GDP Growth Chart):

  1. See the July 8, 2019 Commentary for an introduction to this model.
  2. Actual numbers 2007 through 2019; forecasted numbers thereafter.
  3. Normal GDP growth is typically in the 2% to 3% range.
  4. A recession is generally defined as two consecutive quarters of negative economic growth as measured by a country’s gross domestic product (GDP).

Thought for the Week

“The difference between stupidity and genius is that genius has its limits.” ~ Albert Einstein

Announcements

The Intrinsic Value Wealth Report has started a new YouTube channel called Intrinsic Value Wealth Report TV. You can view the YouTube channel at Intrinsic Value Wealth Report TV.

The Intrinsic Value Wealth Report has started a new podcast called Intrinsic Value Wealth Report Radio. You can listen to the podcast at Intrinsic Value Wealth Report Radio.

Dr. Wendee spoke at the Investment Club of America’s annual economic summit, called Econosummit, on Sunday March 1, 2020 in Las Vegas.

Dr. Wendee attended the The National Due Diligence Alliance (TNDDA) investment banking conference, which was held March 6-8, 2020 at the Four Seasons Resort in Dallas, Texas. This is a conference held several times throughout the year for investment bankers and registered investment advisers to learn about new opportunities in the Alternative Investment asset classes.

TNDDA Meeting in Dallas, Texas

We have been researching the use of crowdsourcing for investment ideas. We will be sending a survey out in the next few weeks to get your input on the economy and the markets; and to get any investment ideas that you would like to share. We will compile this input and distribute the results to you and our other subscribers. We have been testing our crowdsourcing models with students and have been having good success and results.

Dr. Wendee has been researching and writing a new theory of economics known as, The Value Creation Theory of the Economy (also known as, Intrinsinomics). The full paper on Intrinsinomics will be published in the near future.

Finance 3350: Personal Finance-Portfolio & Risk Management– Dr. Wendee started teaching Finance 3350 – Portfolio & Risk Management at California State University, Los Angeles (CSULA) for the Summer term starting May 2020. Dr. Wendee teaches courses in Management and Finance at CSULA.

Business 548: Strategy and Decision Making – Dr. Wendee will be teaching Business 548 – Strategy and Decision Making at California Baptist University (CBU) starting at the end of June 2020. Dr. Wendee teaches courses in Finance, Business, Strategy & Decision Making, and Economics at CBU.

Dr. Wendee presented a paper on his new theory of economics known as, The Value Creation Theory of the Economy (also known as, Intrinsinomics), at the International Leadership Association’s annual global conference which was held in Ottawa, Canada last Fall.

Dr. Wendee will present an updated paper on his new theory of economics known as, The Value Creation Theory of the Economy (also known as, Intrinsinomics), at the International Leadership Association’s annual global conference which will be held in San Francisco, California in November.

Dr. Wendee is working on a financial planning modeling program which will be available in the near future. The modeling program is designed to assist anyone in creating a financial plan and is customizable for each person’s unique financial planning goals. A working draft of the model is currently in beta test with students. Click this link, schematic, to go to the clickable document under the subheading Financial Planning Process (Draft) in the Intrinsic Value Wealth Report to see a draft of the schematic for the new financial planning process.

Dr. Wendee has been developing an econometric model specifically designed to monitor and forecast the global economy as this current economic crisis unfolds. This new econometric model is based on other econometric models that he has designed and have used for many years. You can find some of these earlier models in Book # 6 – Simple and Effective Economic Forecasting in the sister website to this website which is called the Intrinsic Value Wealth Report. The new econometric model has been constructed with some additional tools and methods that he has learned and some that he has developed over the last several years. He will be talking more about this new econometric model in this Commentary over the next few months. His comments and forecasts on the economy and the markets going forward will be based to a significant extent on this new model.

We have begun raising capital for our fund-of-funds investment, Northwest Quadrant Opportunity Fund, LLC. The fund engineers and constructs an investment vehicle consisting of Alternative Asset investments. The fund’s objective is to build a diversified portfolio of strong, solid, steady- performing assets, with highly qualified asset managers who have proven track records that meet our underwriting requirements. To learn more about the Northwest Quadrant Opportunity Fund, LLC and to obtain an offering memorandum, please click Northwest Quadrant Opportunity Fund, LLC.

Intrinsic Value Wealth Creation pyramid

We always conclude our commentary with a discussion of the Intrinsic Value Wealth Creation Pyramid. The Intrinsic Value Wealth Creation Pyramid is designed to show some of the major categories for building wealth. It is the result of many years of study of the wealth building process; experience working with clients who have built considerable wealth; and my own personal experience building wealth. Newsletter subscribers should consult the Intrinsic Value Wealth Creation Pyramid as one of many useful investment tools while considering their investment plans.

The chart in this section is an expanded version of the Intrinsic Value Wealth Creation Pyramid Chart referenced in the Forbes.com article entitled, Nine Of The Best Ways To Build Wealth.

RESOURCES

See our Resources section for links to economic and other resources used in the preparation of this Commentary.

Posted in Economic & Business Chart Room, Economic Outlook, Entrepreneurship, Focus List, Investment Recommendations, Investments, Notes From The Field, Special Situations, Uncategorized, VDI/REEP, Visionary Ideas | Tagged , , , , , , , , , , , , , , , , , , , , , , , , , , , , , , , , , | Comments Off on WEEKLY COMMENTARY July 13, 2020

WEEKLY COMMENTARY July 6, 2020

Maybe Not ‘Irrationally Exuberant’ – But Definitely Overvalued

Is the market “irrationally exuberant”? That was a question posed in December 1996 by Alan Greenspan, who was the Chairman of the Federal Reserve at the time. In an article written today by Mark Hulbert (2020), a columnist for the Wall Street Journal, Mr. Hulbert recalls this famous Greenspan speech and asks the same question about today’s market: “Are stock investors ‘irrationally exuberant again?”

To help answer this question, Hulbert reviews a 2006 paper written by Malcom Baker and Jeffrey Wurgler (Baker and Wurgler, 2006), two university professors who tried to quantify investor sentiment and its effect on the markets. Their research, conducted at the end of the internet bubble, identified five variables that might characterize investor exuberance. The five variables are: (1) the number of initial public offerings (IPOs); (2) the first day average return of those initial public offerings; (3) how public companies raised their capital – equity or debt; (4) the relative valuations of dividend versus non-dividend paying stocks; and (5) the average closed-end fund discount.

Here is how today compares with the years in the study, according to Hulbert (2020). In calendar year 1999 (the last full year before the top of the internet bubble), there were 476 IPOs whereas there have only been 44 IPOs so far this year. In 1999, the average first-day IPO return was 71% versus 34% for this year. The equity percentage of capital raised in 1999 was 18%; today it stands at 7.5%. The relative valuation of dividend paying stocks is 44% higher than non-dividend paying stocks, a reversal from the 1999 period, suggesting that investors are not chasing growth stocks as much as they did in 1999. And finally, the discount on closed-end funds is deep by historical standards, suggesting there is a great deal of fear in the market. Given this data, Hulbert concludes that the market is not irrationally exuberant at the present time.

While the stock market may not be acting in an irrationally exuberant manner, we believe that the market is definitely overvalued. As of Thursday, July 3rd, the Dow Jones Industrial Average was trading at a price-to-earnings ratio of 21.74 and the S&P 500 was trading at a price-to-earnings ratio of 22.44. Those are overvalued markets. Based on our research, a normal range for price-to-earnings ratios is in the range of 15 to 18. We refer again, as we have done in the past, to the chart on the S&P 500 Forward P/E and Annualized 10-Year Returns chart (please sign up for the free account at this link to view this chart if you don’t already have an account – the chart is near the bottom of this page). As you can see in this chart, around 20 percent of the returns were in the negative area of the chart. These were periods of time when investors were probably very irrationally exuberant and buying in very overpriced markets. Overpriced markets are prime examples of when investors are wrong in their assessment of the prospects for these markets. And as the results show, these are times when the markets were comprised of investors that were indeed wrong in their assessment.

References

Baker, M. and J. Wurgler (2006). “Investor sentiment and the cross-section of stock returns.” The Journal of Finance LXI(4).

Hulbert, M. (2020). Are stock investors ‘Irrationally Exuberant’ again? The Wall Street Journal. New York: Dow Jones & Company Inc.

Economic and Investment Highlights

Last Week

Chesapeake filed for bankruptcy.

Private equity firms have a huge stockpile of cash, totaling $1.45 trillion as of June.

Delta is set to send notices to 2500 pilots warning of possible furloughs.

More than 40% of S&P 500 companies have suspended their earnings guidance.

Banks have pulled back lending to U.S. consumers.

The Fed opened its $500 billion program to support debt issuance by large corporations.

There are an increasing number of regions in the U.S. pausing or rolling back reopenings due to the surge in coronavirus cases.

U.S. stocks ended the quarter with the best quarter gain in percentage terms in 20 years.

Airbus is cutting 15,000 jobs, which is 11% of its workforce.

China’s economic recovery accelerated in June with government support.

Fauci warned that new coronavirus cases in the U.S. could reach 100,000 per day if people continue to ignore social distancing and face mask precautions.

Americans will continue to be barred from entering the EU except for essential matters.

China continued to tighten its grip on Hong Kong. Thousands of people in Hong Kong protested.

Major auto makers posted sharp drops in second quarter U.S. auto sales.

Unemployment fell in June but faces the possibility of rising again as the number of coronavirus cases surges.

The CBO said that the U.S. economic downturn will be more severe than previously forecast, with unemployment remaining in double-digits through year-end.

The Dow, the S&P 500, and the Nasdaq rose for the week. The Dow was up 3.2%; the S&P 500 was up 4.02%; and the Nasdaq was up 4.6%. The 10-year treasury yield ended the week at 0.670%. Gold closed at $1,784.00 (Thursday) for the week. Oil closed at $40.65 for the week.

The Week Ahead

This link takes you to Econoday’s Economic Calendar and Economic Events and Analysis which shows the upcoming economic reporting events scheduled in the week and months ahead.

Summary

Note: The models below may not capture the impact of COVID-19 beyond their impact on GDP source data and relevant economic reports that have already been released. They may not anticipate the impact of COVID-19 on forthcoming economic reports beyond the standard internal dynamics of the models.

Note: The comments that follow are derived from the economic indicators referenced in the Resources section of this newsletter and other sources in this report.

The Aruoba-Diebold-Scotti Business Conditions Index (ALS) had been trending up for several weeks from having dipped in 2019. Recently with the advent of the economic collapse, the index crashed. It has now been trending up again.This is a positive indicator for the economy on a short-term basis.

The GDPNow model estimate for real GDP growth (seasonally adjusted annual rate) in the second quarter of 2020 is -45.4 percent. This reading differs from the ALS model assessment of an improving short-term economic environment.

The New York Fed Staff Nowcast stands at -25.9% for 2020:Q2 and -12.5 for 2020:Q3.

The Chicago Fed National Activity Index (CFNAI) showed a decrease in economic activity in April. The Chicago Fed National Activity Index (CFNAI) was 2.61 in May, up from -17.89 in April.

All told, these short-term economic indicators are a mixed analysis for the economy, at least on a short-term basis.

Expectations that stock prices will rise over the next six months is now at 24.4% in a recent AAII Sentiment Survey. The historical average is 38.0% for the survey. 27.8% of the investors in the survey described their short-term outlook as neutral and 47.8% were bearish. Please see the AAII Sentiment Survey for the complete results.

The latest Gross Output (GO) reading (April 6, 2020) showed that Gross Output slowed significantly in the fourth quarter of 2019.

On a longer-term basis, the forecasters in the Philadelphia Fed’s Survey of Professional Forecasters (as of May 15, 2020) predict real GDP will contract at an annual rate of -32.2 percent for the second quarter of 2020; and increase at 10.6 percent for the third quarter of 2020, 6.5 percent in the fourth quarter of 2020, 6.8 percent in the first quarter of 2021, and 4.1 percent in the second quarter of 2021. On an annual-average over annual-average basis, the forecasters predict real GDP to contract -5.6 percent in 2020; and grow 3.1 percent in 2021, 4.1 percent in 2022 and 2.2 percent in 2023. The forecasters predict the unemployment rate will be above 10.0 percent over the next three quarters (16.1 percent in Q2, 12.9 percent in Q3, and 11.0 percent in Q4); will be 10.8 percent in 2020; 8.1 percent in 2021, 6.2 percent in 2022, and 5.1 percent in 2023. The next survey release date is August 14, 2020.

The National Association for Business Economics (NABE) released an Outlook Flash Survey on April 10, 2020. The NABE panel expects GDP declines in Q1 2020 and Q2 2020, and upticks in Q3 2020 and Q4 2020. The panel believes the U.S. economy is already in a recession and predicts real GDP will grow at an annual rate of -2.4 percent for the first quarter of 2020, -26.5 percent for the second quarter of 2020, 2.0 percent in the third quarter of 2020, 5.8 percent in the fourth quarter of 2020, and 6.0 percent in the first quarter of 2021. The forecasters expect unemployment to average 3.8% in Q1 2020. The median unemployment rate projection for Q2 2020 is 12.0%. The unemployment rate is expected to fall back to 9.5% at the end of 2020, and to 6.0% at year-end 2021. The panel’s forecast for the PCE price index less food and energy calls for a slowdown in the annual rate of change from 1.7% in Q1 to 0.8% in Q2 2020. The panel expects the rate to increase gradually to 1.7% in the last half of 2021.

For a more in-depth review and analysis of the economy, please see our mini-book on economic analysis and forecasting entitled: Simple and Effective Economic Forecasting.

Stock Market Valuations

Our estimates of the market valuations for two stock market indices, the Dow Jones Industrial Average (DJIA) and the Standard & Poor’s 500 (S&P 500), can be found in the file below:

Conclusion

During this time of global flux due to the coronavirus, I am leaving the Conclusion discussion below the same as was posted on March 23, 2020. The March 23, 2020 discussion still adequately reflects my thinking on the current state of affairs.

Important Note: While I don’t believe it is time to jump back into the stock market in a big way because of the market’s overvaluation, I have been advising the last few of weeks in this Commentary and in my weekly podcast, Intrinsic Value Wealth Report Radio, that investors can continue building their investment portfolios by selecting individual securities that offer growth and value opportunities.

Reprinted from March 23, 2020

Up until the past week, the economy had been in a stable but somewhat vulnerable state. Nonetheless, it had remained fairly strong. In fact, robust consumer spending and strong labor market conditions had given us confidence that the economy, which had been in its tenth year of expansion, could continue to grow. But we were cautious on this outlook. There were several reasons for our caution. U.S. business growth had been mixed. And global economic growth had been mixed as well. The new coronavirus was becoming a global economic threat, although it was still too early to tell how much of an effect it would ultimately have. Debt is at high levels for consumers, businesses, and government (at all levels of government). Finally, this is an election year that will likely have significant consequences either positively or negatively depending on the outcome of the elections. And of course, it is still too early to tell what the outcome of the elections will be.

In just a few days, the coronavirus’s effect on the economy and the markets went from a ripple to a tsunami. Businesses are shuttering, events are being cancelled or postponed, grocery store shelves are empty, and people are being asked or ordered to stay home. The markets are now deep in bear market territory. The effects on the economy, even given the short time that the economy has been retreating, may be with us for a long time. There is now a much greater risk of a recession, and there has even been some talk of a depression. The government, the Fed, Republicans, and Democrats, and pretty much the entire country, is trying to get the virus under control and is coming up with plans to mitigate the long-term economic effects caused by the virus. But the virus has impacted the economy – in a significant way – in just a short time. How long lasting the effects will be no one can tell right now. The economy has been largely shut down and remains so today. It takes time to restart the economy after a situation such as what is occurring at the present time.

Given these events and the rapidly deteriorating situation, as I said last week, I would caution not to panic. The economy and the markets will get better. The situation is bad – there is no doubt about that – but it will turn around. The real question is when will it turn around? No one knows that at the present time. But it will turn around.

For now, review your investment portfolios. It is highly likely that all or most of your stocks are down. You should not consider selling the bulk of your stocks – only consider selling companies that are not sound companies. But do recognize that as the economy deteriorates, even good companies will be affected.

For stock market value hunters, we believe it is still too early to jump back in. We will be closely monitoring the markets using the many tools and models that we have developed over the years to assess the economy and the markets. We will use our best judgement and thoughts to let you know when we believe things are turning around. The turnaround hasn’t happened yet.

We believe it is important to maintain a long-term view toward investing. But for now, just sit tight. Eventually, this means that you should continue building your investment portfolio using the Cassandra Stock Selection Model to select individual securities that offer growth and value opportunities.

Chart for Review and Thought

S & P 500

Simple and Effective Economic Forecasting Model

Note: The table and chart below have not been updated. However, we believe that a recession is quite likely. In the chart below, the bottom green line shows what a recession could look like.

Notes (GDP Growth Chart):

  1. See the July 8, 2019 Commentary for an introduction to this model.
  2. Actual numbers 2007 through 2019; forecasted numbers thereafter.
  3. Normal GDP growth is typically in the 2% to 3% range.
  4. A recession is generally defined as two consecutive quarters of negative economic growth as measured by a country’s gross domestic product (GDP).

Thought for the Week

“How do we know when irrational exuberance has unduly escalated asset values?” ~ Alan Greenspan (December 1996)

Announcements

The Intrinsic Value Wealth Report has started a new YouTube channel called Intrinsic Value Wealth Report TV. You can view the YouTube channel at Intrinsic Value Wealth Report TV.

The Intrinsic Value Wealth Report has started a new podcast called Intrinsic Value Wealth Report Radio. You can listen to the podcast at Intrinsic Value Wealth Report Radio.

Dr. Wendee spoke at the Investment Club of America’s annual economic summit, called Econosummit, on Sunday March 1, 2020 in Las Vegas.

Dr. Wendee attended the The National Due Diligence Alliance (TNDDA) investment banking conference, which was held March 6-8, 2020 at the Four Seasons Resort in Dallas, Texas. This is a conference held several times throughout the year for investment bankers and registered investment advisers to learn about new opportunities in the Alternative Investment asset classes.

TNDDA Meeting in Dallas, Texas

We have been researching the use of crowdsourcing for investment ideas. We will be sending a survey out in the next few weeks to get your input on the economy and the markets; and to get any investment ideas that you would like to share. We will compile this input and distribute the results to you and our other subscribers. We have been testing our crowdsourcing models with students and have been having good success and results.

Dr. Wendee has been researching and writing a new theory of economics known as, The Value Creation Theory of the Economy (also known as, Intrinsinomics). The full paper on Intrinsinomics will be published in the near future.

Finance 3350: Personal Finance-Portfolio & Risk Management– Dr. Wendee started teaching Finance 3350 – Portfolio & Risk Management at California State University, Los Angeles (CSULA) for the Summer term starting May 2020. Dr. Wendee teaches courses in Management and Finance at CSULA.

Business 548: Strategy and Decision Making – Dr. Wendee will be teaching Business 548 – Strategy and Decision Making at California Baptist University (CBU) starting at the end of June 2020. Dr. Wendee teaches courses in Finance, Business, Strategy & Decision Making, and Economics at CBU.

Dr. Wendee presented a paper on his new theory of economics known as, The Value Creation Theory of the Economy (also known as, Intrinsinomics), at the International Leadership Association’s annual global conference which was held in Ottawa, Canada last Fall.

Dr. Wendee will present an updated paper on his new theory of economics known as, The Value Creation Theory of the Economy (also known as, Intrinsinomics), at the International Leadership Association’s annual global conference which will be held in San Francisco, California in November.

Dr. Wendee is working on a financial planning modeling program which will be available in the near future. The modeling program is designed to assist anyone in creating a financial plan and is customizable for each person’s unique financial planning goals. A working draft of the model is currently in beta test with students. Click this link, schematic, to go to the clickable document under the subheading Financial Planning Process (Draft) in the Intrinsic Value Wealth Report to see a draft of the schematic for the new financial planning process.

Dr. Wendee has been developing an econometric model specifically designed to monitor and forecast the global economy as this current economic crisis unfolds. This new econometric model is based on other econometric models that he has designed and have used for many years. You can find some of these earlier models in Book # 6 – Simple and Effective Economic Forecasting in the sister website to this website which is called the Intrinsic Value Wealth Report. The new econometric model has been constructed with some additional tools and methods that he has learned and some that he has developed over the last several years. He will be talking more about this new econometric model in this Commentary over the next few months. His comments and forecasts on the economy and the markets going forward will be based to a significant extent on this new model.

We have begun raising capital for our fund-of-funds investment, Northwest Quadrant Opportunity Fund, LLC. The fund engineers and constructs an investment vehicle consisting of Alternative Asset investments. The fund’s objective is to build a diversified portfolio of strong, solid, steady- performing assets, with highly qualified asset managers who have proven track records that meet our underwriting requirements. To learn more about the Northwest Quadrant Opportunity Fund, LLC and to obtain an offering memorandum, please click Northwest Quadrant Opportunity Fund, LLC.

Intrinsic Value Wealth Creation pyramid

We always conclude our commentary with a discussion of the Intrinsic Value Wealth Creation Pyramid. The Intrinsic Value Wealth Creation Pyramid is designed to show some of the major categories for building wealth. It is the result of many years of study of the wealth building process; experience working with clients who have built considerable wealth; and my own personal experience building wealth. Newsletter subscribers should consult the Intrinsic Value Wealth Creation Pyramid as one of many useful investment tools while considering their investment plans.

The chart in this section is an expanded version of the Intrinsic Value Wealth Creation Pyramid Chart referenced in the Forbes.com article entitled, Nine Of The Best Ways To Build Wealth.

RESOURCES

See our Resources section for links to economic and other resources used in the preparation of this Commentary.

Posted in Economic & Business Chart Room, Economic Outlook, Entrepreneurship, Focus List, Investment Recommendations, Investments, Notes From The Field, Special Situations, Uncategorized, VDI/REEP, Visionary Ideas | Tagged , , , , , , , , , , , , , , , , , , , , , , , , , , , , , , , , , | Comments Off on WEEKLY COMMENTARY July 6, 2020

WEEKLY COMMENTARY June 29, 2020

Read, Study, Model, Forecast, Repeat

Over the years, my forecasts have been correct more often than not. On Wall Street, that is usually good enough because most forecasters are not right even that much of the time. Furthermore, if you have confidence in your forecasts and invest in them, that will pay off as well. It has for me!

What makes a good forecaster? The first thing to realize is that good forecasting is not “rocket Science.” It is mostly just plain hard work. Yes, it is important for a good forecaster to know a lot about a lot of things (i.e., have common sense and good general knowledge and awareness of what’s going on in the world). And it is important for forecasters to have some good forecasting tools. It has also been shown that good forecasters generally have above average intelligence; but they are not necessarily off the charts in terms of intelligence and they are often not experts in the field in which they are making the forecasts. While not an exhaustive list, the best forecasters do have some common traits as follows:

  1. they think in terms of probabilities;
  2. they are open minded;
  3. they revise their forecasts when necessary;
  4. they are self-critical;
  5. they are System 2 thinkers*; and,
  6. they work very hard at their forecasts.

As Tetlock (2015) notes about superforecasters: “They score higher than average on measures of intelligence and open-mindedness, although they are not off the charts. What makes them so good is less what they are than what they do—the hard work of research, the careful thought and self-criticism, the gathering and synthesizing of other perspectives, the granular judgments and relentless updating. But how long can they sustain it? As we saw, people can, in principle, use conscious System 2 reflection to catch mistakes arising from a rapid, unconscious System 1 operations. Superforecasters put enormous effort into doing just that.”

What do I do that makes me a good forecaster? In addition to the above traits of good forecasters, which I try to cultivate and practice at all times, I do the following:

  1. Read – I am always reading, learning, and being aware of what is going on in a number of different disciplines and in the world in general. See the picture below in Charts for Review and Thought. The Wall Street Journal is just one of the many resources I use for my research.
  2. Study – I just don’t read – I study. I use System 2 thinking. I research.
  3. Model – modeling is an important way to understand what we read and study. For more on models, see my article in the Business Forum (Wendee, 2019) which is based on work by Page (2018).
  4. Forecast – after reading, studying, and modeling, then finally the forecast is made.
  5. Repeat – this is an iterative process. It is never complete. Forecasts must be revised, and new forecasts made.

* According to Tetlock (2015), “System 2 is the familiar realm of conscious thought. It consists of everything we choose to focus on. By contrast, System 1 is largely a stranger to us. It is the realm of automatic perceptual and cognitive operations…System 1 comes first. It is fast and constantly running in the background. If a question is asked and you instantly know the answer, it sprang from System 1. System 2 is charged with interrogating that answer.”

References:

Page, S. E. (2018). The model thinker: What you need to know to make data work for you. New York, Basic Books.

Tetlock, P. E. and D. Gardner (2015). Superforecasting: The art and science of prediction. New York, Crown Publishing.

Wendee, P. M. (2019). “Book review – The model thinker: What you need to know to make data work for you by Scott E. Page, Ph.D.” Business Forum 27(2): 63-65.

Economic and Investment Highlights

Last Week

Large companies are holding cash while they wait to see how and when the recovery takes place.

Existing home sales fell 9.7% in May from the prior month.

New jobless claims have remained steady at around 1.5 million each week so far in June.

Macy’s is laying off about 3% of its workforce.

The Fed said a prolonged economic downturn could cost the biggest banks around $700 billion in losses.

Coronavirus cases in the U.S. have surged to very high levels, causing many states and cities to begin reversing openings.

Household spending in the U.S. rose 8.2% in May but faces strong headwinds as the coronavirus begins to spread at an accelerating rate again.

Gun maker Remington Arms is preparing to file for Chapter 11 bankruptcy.

The Dow, the S&P 500, and the Nasdaq fell for the week. The Dow was down 3.3%; the S&P 500 was down 2.86%; and the Nasdaq was down 1.9%. The 10-year treasury yield ended the week at 0.636%. Gold closed at $1,772.50 for the week. Oil closed at $38.49 for the week.

The Week Ahead

This link takes you to Econoday’s Economic Calendar and Economic Events and Analysis which shows the upcoming economic reporting events scheduled in the week and months ahead.

Summary

Note: The models below may not capture the impact of COVID-19 beyond their impact on GDP source data and relevant economic reports that have already been released. They may not anticipate the impact of COVID-19 on forthcoming economic reports beyond the standard internal dynamics of the models.

Note: The comments that follow are derived from the economic indicators referenced in the Resources section of this newsletter and other sources in this report.

The Aruoba-Diebold-Scotti Business Conditions Index (ALS) had been trending up for several weeks from having dipped in 2019. Recently with the advent of the economic collapse, the index crashed. It has now been trending up again.This is a positive indicator for the economy on a short-term basis.

The GDPNow model estimate for real GDP growth (seasonally adjusted annual rate) in the second quarter of 2020 is -45.4 percent. This reading differs from the ALS model assessment of an improving short-term economic environment.

The New York Fed Staff Nowcast stands at -25.9% for 2020:Q2 and -12.5 for 2020:Q3.

The Chicago Fed National Activity Index (CFNAI) showed a decrease in economic activity in April. The Chicago Fed National Activity Index (CFNAI) was 2.61 in May, up from -17.89 in April.

All told, these short-term economic indicators are a mixed analysis for the economy, at least on a short-term basis.

Expectations that stock prices will rise over the next six months is now at 24.4% in a recent AAII Sentiment Survey. The historical average is 38.0% for the survey. 27.8% of the investors in the survey described their short-term outlook as neutral and 47.8% were bearish. Please see the AAII Sentiment Survey for the complete results.

The latest Gross Output (GO) reading (April 6, 2020) showed that Gross Output slowed significantly in the fourth quarter of 2019.

On a longer-term basis, the forecasters in the Philadelphia Fed’s Survey of Professional Forecasters (as of May 15, 2020) predict real GDP will contract at an annual rate of -32.2 percent for the second quarter of 2020; and increase at 10.6 percent for the third quarter of 2020, 6.5 percent in the fourth quarter of 2020, 6.8 percent in the first quarter of 2021, and 4.1 percent in the second quarter of 2021. On an annual-average over annual-average basis, the forecasters predict real GDP to contract -5.6 percent in 2020; and grow 3.1 percent in 2021, 4.1 percent in 2022 and 2.2 percent in 2023. The forecasters predict the unemployment rate will be above 10.0 percent over the next three quarters (16.1 percent in Q2, 12.9 percent in Q3, and 11.0 percent in Q4); will be 10.8 percent in 2020; 8.1 percent in 2021, 6.2 percent in 2022, and 5.1 percent in 2023. The next survey release date is August 14, 2020.

The National Association for Business Economics (NABE) released an Outlook Flash Survey on April 10, 2020. The NABE panel expects GDP declines in Q1 2020 and Q2 2020, and upticks in Q3 2020 and Q4 2020. The panel believes the U.S. economy is already in a recession and predicts real GDP will grow at an annual rate of -2.4 percent for the first quarter of 2020, -26.5 percent for the second quarter of 2020, 2.0 percent in the third quarter of 2020, 5.8 percent in the fourth quarter of 2020, and 6.0 percent in the first quarter of 2021. The forecasters expect unemployment to average 3.8% in Q1 2020. The median unemployment rate projection for Q2 2020 is 12.0%. The unemployment rate is expected to fall back to 9.5% at the end of 2020, and to 6.0% at year-end 2021. The panel’s forecast for the PCE price index less food and energy calls for a slowdown in the annual rate of change from 1.7% in Q1 to 0.8% in Q2 2020. The panel expects the rate to increase gradually to 1.7% in the last half of 2021.

For a more in-depth review and analysis of the economy, please see our mini-book on economic analysis and forecasting entitled: Simple and Effective Economic Forecasting.

Stock Market Valuations

Our estimates of the market valuations for two stock market indices, the Dow Jones Industrial Average (DJIA) and the Standard & Poor’s 500 (S&P 500), can be found in the file below:

Conclusion

During this time of global flux due to the coronavirus, I am leaving the Conclusion discussion below the same as was posted on March 23, 2020. The March 23, 2020 discussion still adequately reflects my thinking on the current state of affairs.

Important Note: While I don’t believe it is time to jump back into the stock market in a big way because of the market’s overvaluation, I have been advising the last few of weeks in this Commentary and in my weekly podcast, Intrinsic Value Wealth Report Radio, that investors can continue building their investment portfolios by selecting individual securities that offer growth and value opportunities.

Reprinted from March 23, 2020

Up until the past week, the economy had been in a stable but somewhat vulnerable state. Nonetheless, it had remained fairly strong. In fact, robust consumer spending and strong labor market conditions had given us confidence that the economy, which had been in its tenth year of expansion, could continue to grow. But we were cautious on this outlook. There were several reasons for our caution. U.S. business growth had been mixed. And global economic growth had been mixed as well. The new coronavirus was becoming a global economic threat, although it was still too early to tell how much of an effect it would ultimately have. Debt is at high levels for consumers, businesses, and government (at all levels of government). Finally, this is an election year that will likely have significant consequences either positively or negatively depending on the outcome of the elections. And of course, it is still too early to tell what the outcome of the elections will be.

In just a few days, the coronavirus’s effect on the economy and the markets went from a ripple to a tsunami. Businesses are shuttering, events are being cancelled or postponed, grocery store shelves are empty, and people are being asked or ordered to stay home. The markets are now deep in bear market territory. The effects on the economy, even given the short time that the economy has been retreating, may be with us for a long time. There is now a much greater risk of a recession, and there has even been some talk of a depression. The government, the Fed, Republicans, and Democrats, and pretty much the entire country, is trying to get the virus under control and is coming up with plans to mitigate the long-term economic effects caused by the virus. But the virus has impacted the economy – in a significant way – in just a short time. How long lasting the effects will be no one can tell right now. The economy has been largely shut down and remains so today. It takes time to restart the economy after a situation such as what is occurring at the present time.

Given these events and the rapidly deteriorating situation, as I said last week, I would caution not to panic. The economy and the markets will get better. The situation is bad – there is no doubt about that – but it will turn around. The real question is when will it turn around? No one knows that at the present time. But it will turn around.

For now, review your investment portfolios. It is highly likely that all or most of your stocks are down. You should not consider selling the bulk of your stocks – only consider selling companies that are not sound companies. But do recognize that as the economy deteriorates, even good companies will be affected.

For stock market value hunters, we believe it is still too early to jump back in. We will be closely monitoring the markets using the many tools and models that we have developed over the years to assess the economy and the markets. We will use our best judgement and thoughts to let you know when we believe things are turning around. The turnaround hasn’t happened yet.

We believe it is important to maintain a long-term view toward investing. But for now, just sit tight. Eventually, this means that you should continue building your investment portfolio using the Cassandra Stock Selection Model to select individual securities that offer growth and value opportunities.

Chart for Review and Thought

Read, Study, Model, Forecast, Repeat

Simple and Effective Economic Forecasting Model

Note: The table and chart below have not been updated. However, we believe that a recession is quite likely. In the chart below, the bottom green line shows what a recession could look like.

Notes (GDP Growth Chart):

  1. See the July 8, 2019 Commentary for an introduction to this model.
  2. Actual numbers 2007 through 2019; forecasted numbers thereafter.
  3. Normal GDP growth is typically in the 2% to 3% range.
  4. A recession is generally defined as two consecutive quarters of negative economic growth as measured by a country’s gross domestic product (GDP).

Thought for the Week

When asked if he had made his mind up yet, he replied: “Not that I know of.” ~ Yogi Berra

Announcements

The Intrinsic Value Wealth Report has started a new YouTube channel called Intrinsic Value Wealth Report TV. You can view the YouTube channel at Intrinsic Value Wealth Report TV.

The Intrinsic Value Wealth Report has started a new podcast called Intrinsic Value Wealth Report Radio. You can listen to the podcast at Intrinsic Value Wealth Report Radio.

Dr. Wendee spoke at the Investment Club of America’s annual economic summit, called Econosummit, on Sunday March 1, 2020 in Las Vegas.

Dr. Wendee attended the The National Due Diligence Alliance (TNDDA) investment banking conference, which was held March 6-8, 2020 at the Four Seasons Resort in Dallas, Texas. This is a conference held several times throughout the year for investment bankers and registered investment advisers to learn about new opportunities in the Alternative Investment asset classes.

TNDDA Meeting in Dallas, Texas

We have been researching the use of crowdsourcing for investment ideas. We will be sending a survey out in the next few weeks to get your input on the economy and the markets; and to get any investment ideas that you would like to share. We will compile this input and distribute the results to you and our other subscribers. We have been testing our crowdsourcing models with students and have been having good success and results.

Dr. Wendee has been researching and writing a new theory of economics known as, The Value Creation Theory of the Economy (also known as, Intrinsinomics). The full paper on Intrinsinomics will be published in the near future.

Finance 3350: Personal Finance-Portfolio & Risk Management– Dr. Wendee started teaching Finance 3350 – Portfolio & Risk Management at California State University, Los Angeles (CSULA) for the Summer term starting May 2020. Dr. Wendee teaches courses in Management and Finance at CSULA.

Business 548: Strategy and Decision Making – Dr. Wendee will be teaching Business 548 – Strategy and Decision Making at California Baptist University (CBU) starting at the end of June 2020. Dr. Wendee teaches courses in Finance, Business, Strategy & Decision Making, and Economics at CBU.

Dr. Wendee presented a paper on his new theory of economics known as, The Value Creation Theory of the Economy (also known as, Intrinsinomics), at the International Leadership Association’s annual global conference which was held in Ottawa, Canada last Fall.

Dr. Wendee will present an updated paper on his new theory of economics known as, The Value Creation Theory of the Economy (also known as, Intrinsinomics), at the International Leadership Association’s annual global conference which will be held in San Francisco, California in November.

Dr. Wendee is working on a financial planning modeling program which will be available in the near future. The modeling program is designed to assist anyone in creating a financial plan and is customizable for each person’s unique financial planning goals. A working draft of the model is currently in beta test with students. Click this link, schematic, to go to the clickable document under the subheading Financial Planning Process (Draft) in the Intrinsic Value Wealth Report to see a draft of the schematic for the new financial planning process.

Dr. Wendee has been developing an econometric model specifically designed to monitor and forecast the global economy as this current economic crisis unfolds. This new econometric model is based on other econometric models that he has designed and have used for many years. You can find some of these earlier models in Book # 6 – Simple and Effective Economic Forecasting in the sister website to this website which is called the Intrinsic Value Wealth Report. The new econometric model has been constructed with some additional tools and methods that he has learned and some that he has developed over the last several years. He will be talking more about this new econometric model in this Commentary over the next few months. His comments and forecasts on the economy and the markets going forward will be based to a significant extent on this new model.

We have begun raising capital for our fund-of-funds investment, Northwest Quadrant Opportunity Fund, LLC. The fund engineers and constructs an investment vehicle consisting of Alternative Asset investments. The fund’s objective is to build a diversified portfolio of strong, solid, steady- performing assets, with highly qualified asset managers who have proven track records that meet our underwriting requirements. To learn more about the Northwest Quadrant Opportunity Fund, LLC and to obtain an offering memorandum, please click Northwest Quadrant Opportunity Fund, LLC.

Intrinsic Value Wealth Creation pyramid

We always conclude our commentary with a discussion of the Intrinsic Value Wealth Creation Pyramid. The Intrinsic Value Wealth Creation Pyramid is designed to show some of the major categories for building wealth. It is the result of many years of study of the wealth building process; experience working with clients who have built considerable wealth; and my own personal experience building wealth. Newsletter subscribers should consult the Intrinsic Value Wealth Creation Pyramid as one of many useful investment tools while considering their investment plans.

The chart in this section is an expanded version of the Intrinsic Value Wealth Creation Pyramid Chart referenced in the Forbes.com article entitled, Nine Of The Best Ways To Build Wealth.

RESOURCES

See our Resources section for links to economic and other resources used in the preparation of this Commentary.

Posted in Economic & Business Chart Room, Economic Outlook, Entrepreneurship, Focus List, Investment Recommendations, Investments, Notes From The Field, Special Situations, Uncategorized, VDI/REEP, Visionary Ideas | Tagged , , , , , , , , , , , , , , , , , , , , , , , , , , , , , , , , , | Comments Off on WEEKLY COMMENTARY June 29, 2020

WEEKLY COMMENTARY June 22, 2020

Anyone Can Build Wealth Using Our Wealth Blueprint and Wealth Code

Dr. Wendee is working on a financial planning modeling program which is now available on a work-in-progress basis. The modeling program is designed to assist anyone in creating a financial plan and is customizable for each person’s unique financial planning goals. A working draft of the model is currently in beta test with students and is also available on various parts of the Intrinsic Value Wealth Report Media Group’s publications, including: (1) Intrinsic Value Wealth Report Newsletter; (2) Intrinsic Value Wealth Report (educational site); (3) Intrinsic Value Wealth Report Radio (podcast); and (4) Intrinsic Value Wealth Report TV (YouTube channel). Click this link, schematic, to go to the clickable document under the subheading Financial Planning Process (Draft) in the Intrinsic Value Wealth Report to see a draft of the schematic for the new financial planning process (you will have to complete the free sign-up to access the schematic).

A basic premise of this financial planning model is that anyone can build wealth using the concept of Intrinsic Value. In our various publications, I reveal the secrets of this powerful methodology for building wealth and show you how you can use the Intrinsic Value Wealth Report’s Wealth Blueprint and the Intrinsic Value Wealth Report’s Wealth Code to build your own wealth.

Economic and Investment Highlights

Last Week

China again resumed its position as the U.S.’s largest trading partner.

Auto makers are having to deal with absent workers and Covid-19 cases as their factories open back up.

Parts of Beijing were shut down as the coronavirus had a resurgence in that city.

France declared victory over the virus and laid out plans for reopening.

Retail sales rose 17.7% in May; but remain below pre-pandemic levels.

Industrial output rose slightly in May.

Hilton said it is cutting 22% of its corporate workforce.

Fauci warned of a possible resurgence if states don’t remain vigilant as they reopen.

The Fed said the economy faces potentially significant long-term damage despite the recent signs of a rebound.

HSBC resumed plans to cut 15% of its workforce.

Unemployment claims remain at historically high levels.

Americans have skipped payments on over 100 million student and auto loans and other debt since the onset of the pandemic.

T-Mobile and AT&T are cutting significant portions of their workforce.

The Dow, the S&P 500, and the Nasdaq rose for the week. The Dow was up 1.0%; the S&P 500 was up 1.86%; and the Nasdaq was up 3.7%. The 10-year treasury yield ended the week at 0.696%. Gold closed at $1,745.90 for the week. Oil closed at $39.75 for the week.

The Week Ahead

This link takes you to Econoday’s Economic Calendar and Economic Events and Analysis which shows the upcoming economic reporting events scheduled in the week and months ahead.

Summary

Note: The models below may not capture the impact of COVID-19 beyond their impact on GDP source data and relevant economic reports that have already been released. They may not anticipate the impact of COVID-19 on forthcoming economic reports beyond the standard internal dynamics of the models.

Note: The comments that follow are derived from the economic indicators referenced in the Resources section of this newsletter and other sources in this report.

The Aruoba-Diebold-Scotti Business Conditions Index (ALS) had been trending up for several weeks from having dipped in 2019. Recently with the advent of the economic collapse, the index crashed. It has now been trending up again.This is a positive indicator for the economy on a short-term basis.

The GDPNow model estimate for real GDP growth (seasonally adjusted annual rate) in the second quarter of 2020 is -45.4 percent. This reading differs from the ALS model assessment of an improving short-term economic environment.

The New York Fed Staff Nowcast stands at -25.9% for 2020:Q2 and -12.5 for 2020:Q3.

The Chicago Fed National Activity Index (CFNAI) showed a decrease in economic activity in April. The Chicago Fed National Activity Index (CFNAI) was 2.61 in May, up from -17.89 in April.

All told, these short-term economic indicators are a mixed analysis for the economy, at least on a short-term basis.

Expectations that stock prices will rise over the next six months is now at 24.4% in a recent AAII Sentiment Survey. The historical average is 38.0% for the survey. 27.8% of the investors in the survey described their short-term outlook as neutral and 47.8% were bearish. Please see the AAII Sentiment Survey for the complete results.

The latest Gross Output (GO) reading (April 6, 2020) showed that Gross Output slowed significantly in the fourth quarter of 2019.

On a longer-term basis, the forecasters in the Philadelphia Fed’s Survey of Professional Forecasters (as of May 15, 2020) predict real GDP will contract at an annual rate of -32.2 percent for the second quarter of 2020; and increase at 10.6 percent for the third quarter of 2020, 6.5 percent in the fourth quarter of 2020, 6.8 percent in the first quarter of 2021, and 4.1 percent in the second quarter of 2021. On an annual-average over annual-average basis, the forecasters predict real GDP to contract -5.6 percent in 2020; and grow 3.1 percent in 2021, 4.1 percent in 2022 and 2.2 percent in 2023. The forecasters predict the unemployment rate will be above 10.0 percent over the next three quarters (16.1 percent in Q2, 12.9 percent in Q3, and 11.0 percent in Q4); will be 10.8 percent in 2020; 8.1 percent in 2021, 6.2 percent in 2022, and 5.1 percent in 2023. The next survey release date is August 14, 2020.

The National Association for Business Economics (NABE) released an Outlook Flash Survey on April 10, 2020. The NABE panel expects GDP declines in Q1 2020 and Q2 2020, and upticks in Q3 2020 and Q4 2020. The panel believes the U.S. economy is already in a recession and predicts real GDP will grow at an annual rate of -2.4 percent for the first quarter of 2020, -26.5 percent for the second quarter of 2020, 2.0 percent in the third quarter of 2020, 5.8 percent in the fourth quarter of 2020, and 6.0 percent in the first quarter of 2021. The forecasters expect unemployment to average 3.8% in Q1 2020. The median unemployment rate projection for Q2 2020 is 12.0%. The unemployment rate is expected to fall back to 9.5% at the end of 2020, and to 6.0% at year-end 2021. The panel’s forecast for the PCE price index less food and energy calls for a slowdown in the annual rate of change from 1.7% in Q1 to 0.8% in Q2 2020. The panel expects the rate to increase gradually to 1.7% in the last half of 2021.

For a more in-depth review and analysis of the economy, please see our mini-book on economic analysis and forecasting entitled: Simple and Effective Economic Forecasting.

Stock Market Valuations

Our estimates of the market valuations for two stock market indices, the Dow Jones Industrial Average (DJIA) and the Standard & Poor’s 500 (S&P 500), can be found in the file below:

Conclusion

During this time of global flux due to the coronavirus, I am leaving the Conclusion discussion below the same as was posted on March 23, 2020. The March 23, 2020 discussion still adequately reflects my thinking on the current state of affairs.

Important Note: While I don’t believe it is time to jump back into the stock market in a big way because of the market’s overvaluation, I have been advising the last few of weeks in this Commentary and in my weekly podcast, Intrinsic Value Wealth Report Radio, that investors can continue building their investment portfolios by selecting individual securities that offer growth and value opportunities.

Reprinted from March 23, 2020

Up until the past week, the economy had been in a stable but somewhat vulnerable state. Nonetheless, it had remained fairly strong. In fact, robust consumer spending and strong labor market conditions had given us confidence that the economy, which had been in its tenth year of expansion, could continue to grow. But we were cautious on this outlook. There were several reasons for our caution. U.S. business growth had been mixed. And global economic growth had been mixed as well. The new coronavirus was becoming a global economic threat, although it was still too early to tell how much of an effect it would ultimately have. Debt is at high levels for consumers, businesses, and government (at all levels of government). Finally, this is an election year that will likely have significant consequences either positively or negatively depending on the outcome of the elections. And of course, it is still too early to tell what the outcome of the elections will be.

In just a few days, the coronavirus’s effect on the economy and the markets went from a ripple to a tsunami. Businesses are shuttering, events are being cancelled or postponed, grocery store shelves are empty, and people are being asked or ordered to stay home. The markets are now deep in bear market territory. The effects on the economy, even given the short time that the economy has been retreating, may be with us for a long time. There is now a much greater risk of a recession, and there has even been some talk of a depression. The government, the Fed, Republicans, and Democrats, and pretty much the entire country, is trying to get the virus under control and is coming up with plans to mitigate the long-term economic effects caused by the virus. But the virus has impacted the economy – in a significant way – in just a short time. How long lasting the effects will be no one can tell right now. The economy has been largely shut down and remains so today. It takes time to restart the economy after a situation such as what is occurring at the present time.

Given these events and the rapidly deteriorating situation, as I said last week, I would caution not to panic. The economy and the markets will get better. The situation is bad – there is no doubt about that – but it will turn around. The real question is when will it turn around? No one knows that at the present time. But it will turn around.

For now, review your investment portfolios. It is highly likely that all or most of your stocks are down. You should not consider selling the bulk of your stocks – only consider selling companies that are not sound companies. But do recognize that as the economy deteriorates, even good companies will be affected.

For stock market value hunters, we believe it is still too early to jump back in. We will be closely monitoring the markets using the many tools and models that we have developed over the years to assess the economy and the markets. We will use our best judgement and thoughts to let you know when we believe things are turning around. The turnaround hasn’t happened yet.

We believe it is important to maintain a long-term view toward investing. But for now, just sit tight. Eventually, this means that you should continue building your investment portfolio using the Cassandra Stock Selection Model to select individual securities that offer growth and value opportunities.

Chart for Review and Thought

We Can Do It!

Simple and Effective Economic Forecasting Model

Note: The table and chart below have not been updated. However, we believe that a recession is quite likely. In the chart below, the bottom green line shows what a recession could look like.

Notes (GDP Growth Chart):

  1. See the July 8, 2019 Commentary for an introduction to this model.
  2. Actual numbers 2007 through 2019; forecasted numbers thereafter.
  3. Normal GDP growth is typically in the 2% to 3% range.
  4. A recession is generally defined as two consecutive quarters of negative economic growth as measured by a country’s gross domestic product (GDP).

Thought for the Week

“Those who expect to reap the blessings of freedom, must, like men, undergo the fatigue of supporting it.” ~ Thomas Paine

Announcements

The Intrinsic Value Wealth Report has started a new YouTube channel called Intrinsic Value Wealth Report TV. You can view the YouTube channel at Intrinsic Value Wealth Report TV.

The Intrinsic Value Wealth Report has started a new podcast called Intrinsic Value Wealth Report Radio. You can listen to the podcast at Intrinsic Value Wealth Report Radio.

Dr. Wendee spoke at the Investment Club of America’s annual economic summit, called Econosummit, on Sunday March 1, 2020 in Las Vegas.

Dr. Wendee attended the The National Due Diligence Alliance (TNDDA) investment banking conference, which was held March 6-8, 2020 at the Four Seasons Resort in Dallas, Texas. This is a conference held several times throughout the year for investment bankers and registered investment advisers to learn about new opportunities in the Alternative Investment asset classes.

TNDDA Meeting in Dallas, Texas

We have been researching the use of crowdsourcing for investment ideas. We will be sending a survey out in the next few weeks to get your input on the economy and the markets; and to get any investment ideas that you would like to share. We will compile this input and distribute the results to you and our other subscribers. We have been testing our crowdsourcing models with students and have been having good success and results.

Dr. Wendee has been researching and writing a new theory of economics known as, The Value Creation Theory of the Economy (also known as, Intrinsinomics). The full paper on Intrinsinomics will be published in the near future.

Finance 3350: Personal Finance-Portfolio & Risk Management– Dr. Wendee started teaching Finance 3350 – Portfolio & Risk Management at California State University, Los Angeles (CSULA) for the Summer term starting May 2020. Dr. Wendee teaches courses in Management and Finance at CSULA.

Business 548: Strategy and Decision Making – Dr. Wendee will be teaching Business 548 – Strategy and Decision Making at California Baptist University (CBU) starting at the end of June 2020. Dr. Wendee teaches courses in Finance, Business, Strategy & Decision Making, and Economics at CBU.

Dr. Wendee presented a paper on his new theory of economics known as, The Value Creation Theory of the Economy (also known as, Intrinsinomics), at the International Leadership Association’s annual global conference which was held in Ottawa, Canada last Fall.

Dr. Wendee will present an updated paper on his new theory of economics known as, The Value Creation Theory of the Economy (also known as, Intrinsinomics), at the International Leadership Association’s annual global conference which will be held in San Francisco, California in November.

Dr. Wendee is working on a financial planning modeling program which will be available in the near future. The modeling program is designed to assist anyone in creating a financial plan and is customizable for each person’s unique financial planning goals. A working draft of the model is currently in beta test with students. Click this link, schematic, to go to the clickable document under the subheading Financial Planning Process (Draft) in the Intrinsic Value Wealth Report to see a draft of the schematic for the new financial planning process.

Dr. Wendee has been developing an econometric model specifically designed to monitor and forecast the global economy as this current economic crisis unfolds. This new econometric model is based on other econometric models that he has designed and have used for many years. You can find some of these earlier models in Book # 6 – Simple and Effective Economic Forecasting in the sister website to this website which is called the Intrinsic Value Wealth Report. The new econometric model has been constructed with some additional tools and methods that he has learned and some that he has developed over the last several years. He will be talking more about this new econometric model in this Commentary over the next few months. His comments and forecasts on the economy and the markets going forward will be based to a significant extent on this new model.

We have begun raising capital for our fund-of-funds investment, Northwest Quadrant Opportunity Fund, LLC. The fund engineers and constructs an investment vehicle consisting of Alternative Asset investments. The fund’s objective is to build a diversified portfolio of strong, solid, steady- performing assets, with highly qualified asset managers who have proven track records that meet our underwriting requirements. To learn more about the Northwest Quadrant Opportunity Fund, LLC and to obtain an offering memorandum, please click Northwest Quadrant Opportunity Fund, LLC.

Intrinsic Value Wealth Creation pyramid

We always conclude our commentary with a discussion of the Intrinsic Value Wealth Creation Pyramid. The Intrinsic Value Wealth Creation Pyramid is designed to show some of the major categories for building wealth. It is the result of many years of study of the wealth building process; experience working with clients who have built considerable wealth; and my own personal experience building wealth. Newsletter subscribers should consult the Intrinsic Value Wealth Creation Pyramid as one of many useful investment tools while considering their investment plans.

The chart in this section is an expanded version of the Intrinsic Value Wealth Creation Pyramid Chart referenced in the Forbes.com article entitled, Nine Of The Best Ways To Build Wealth.

RESOURCES

See our Resources section for links to economic and other resources used in the preparation of this Commentary.
Posted in Economic & Business Chart Room, Economic Outlook, Entrepreneurship, Focus List, Investment Recommendations, Investments, Notes From The Field, Special Situations, Uncategorized, VDI/REEP, Visionary Ideas | Tagged , , , , , , , , , , , , , , , , , , , , , , , , , , , , , , , , , | Comments Off on WEEKLY COMMENTARY June 22, 2020

WEEKLY COMMENTARY June 15, 2020

Not So Bullish, But Still Overvalued

The number of Coronavirus cases across the U.S. and globally is on the rise; the U.S. and global economies continue to be adversely impacted by the Coronavirus and the economic effect is getting worse in most cases; and U.S. states and many global countries appear to be reopening too soon. And yet despite this bad news on the Coronavirus and its effects on the worldwide economy, the stock market, as measured by the Standard & Poor’s 500 (S&P 500), has risen from its March lows, although it remains below the highs set in February. What is happening here?

There are several factors to consider regarding “The Market.” The first factor is to ask, what is “The Market”? There are many gauges, or indices, which people use to refer to “The Market” – the S&P 500 is only one such gauge. Another popular gauge for “The Market” is the Dow Jones Industrial Average. There are other indices for “The Market,” but these are the two that are most often used by investors and referred to in the popular press.

The next question is to ask, what is the composition of these indices? The S&P 500 is a market-capitalization-weighted index of the 500 largest U.S. publicly traded companies. The Dow Jones Industrial Average (Dow 30) is a price-weighted index that gives companies with higher stock prices a higher index weighting. The Dow Jones Industrial Average is composed of 30 large, publicly-traded, blue-chip companies trading on the New York Stock Exchange and the Nasdaq.

Another factor, and an important insight, is that if one is using the S&P500 as the gauge for the “The Market,” as many institutional investors do, it must be recognized that there may be a few very large capitalization stocks that dominate the index and that may be distorting the true performance of the entire index. That is, in fact, what is happening. The S&P 500 is currently dominated by Apple, Amazon, Microsoft, Alphabet, and Facebook. Together these stocks comprise approximately 20% of the market capitalization weighting of the index. And those companies have been performing well in this market largely due to them being technology companies that have products and services that are in high demand during this crisis. This has been a significant factor in the surge in “The Market.”

“The Market,” as measured by both the S&P 500 and the Dow Jones Industrial Average, is overvalued. As of Friday, the S&P 500 had a trailing P/E ratio of 21.81; and the Dow Jones Industrial Average had a trailing P/E ratio of 21.41. That is an overvalued market! Our research shows that a fair-value P/E ratio over the long-term should be in the range of 15 to 18.

In my April 27, 2020 Commentary, I summed up market valuation this way: “The bottom line is that the stock market is sometimes wrong. This can be seen quite clearly in the S&P 500 Forward P/E and Annualized 10-Year Returns chart (please sign up for the free account at this link to view this chart if you don’t already have an account – the chart is near the bottom of this page). As you can see in this chart, around 20 percent of the returns were in the negative area of the chart. These were periods of time when investors were buying in very overpriced markets. Overpriced markets are prime examples of when investors are wrong in their assessment of the prospects for these markets. And as the results show, these are times when the markets were comprised of investors that were indeed wrong.”

For investors in the current market environment, the bottom line is that there is still a pandemic that is on the rise; a global economy that has suffered irreparable damage; and market indices that are indicating an overvalued market. All of these situations will improve at some point in time, but we are not there yet. As I have been advising over the past few weeks, I believe that investors should continue building their investment portfolios by selecting individual securities that offer growth and value opportunities. Now is not the time to jump back into the market in a big way though.

Economic and Investment Highlights

Last Week

Some U.S. states are reporting a rise in coronavirus cases as they begin to reopen. At the same time, Europe and Asia have avoided a significant resurgence so far despite reopening a large portion of their economies.

India is struggling with a high number of cases in Mumbai.

The U.S. economy officially entered into a recession in February.

The World Bank expects the global economy to contract by about 5.2% in 2020.

BP plans to cut 14% of its workforce.

The U.S. budget gap more than doubled in May reaching a deficit of nearly $2 trillion for the fiscal year amid massive spending and significantly reduced revenue.

The Nasdaq reached records this week, topping the 10000 level.

The Fed signaled it plans to keep interest rates near zero for years to come.

The Dow and the Nasdaq fell for the week, while the S&P 500 rose. The Dow was down 5.6%; the S&P 500 was up 4.91%; and the Nasdaq was down 2.3%. The 10-year treasury yield ended the week at 0.698%. Gold closed at $1,729.30 for the week. Oil closed at $36.26 for the week.

The Week Ahead

This link takes you to Econoday’s Economic Calendar and Economic Events and Analysis which shows the upcoming economic reporting events scheduled in the week and months ahead.

Summary

Note: The models below may not capture the impact of COVID-19 beyond their impact on GDP source data and relevant economic reports that have already been released. They may not anticipate the impact of COVID-19 on forthcoming economic reports beyond the standard internal dynamics of the models.

Note: The comments that follow are derived from the economic indicators referenced in the Resources section of this newsletter and other sources in this report.

The Aruoba-Diebold-Scotti Business Conditions Index (ALS) had been trending up for several weeks from having dipped in 2019. Recently with the advent of the economic collapse, the index crashed. This is an extremely negative indicator for the economy on a short-term basis.

The GDPNow model estimate for real GDP growth (seasonally adjusted annual rate) in the second quarter of 2020 is -45.4 percent. This reading continues to support the ALS model assessment of a deteriorating short-term economic environment.

The New York Fed Staff Nowcast stands at -25.9% for 2020:Q2 and -12.5 for 2020:Q3.

The Chicago Fed National Activity Index (CFNAI) showed a decrease in economic activity in April. The Chicago Fed National Activity Index (CFNAI) was -16.74 in April, down from -4.97 in March.

All told, these short-term economic indicators are a negative analysis for the economy, at least on a short-term basis.

Expectations that stock prices will rise over the next six months is now at 24.4% in a recent AAII Sentiment Survey. The historical average is 38.0% for the survey. 27.8% of the investors in the survey described their short-term outlook as neutral and 47.8% were bearish. Please see the AAII Sentiment Survey for the complete results.

The latest Gross Output (GO) reading (April 6, 2020) showed that Gross Output slowed significantly in the fourth quarter of 2019.

On a longer-term basis, the forecasters in the Philadelphia Fed’s Survey of Professional Forecasters (as of May 15, 2020) predict real GDP will contract at an annual rate of -32.2 percent for the second quarter of 2020; and increase at 10.6 percent for the third quarter of 2020, 6.5 percent in the fourth quarter of 2020, 6.8 percent in the first quarter of 2021, and 4.1 percent in the second quarter of 2021. On an annual-average over annual-average basis, the forecasters predict real GDP to contract -5.6 percent in 2020; and grow 3.1 percent in 2021, 4.1 percent in 2022 and 2.2 percent in 2023. The forecasters predict the unemployment rate will be above 10.0 percent over the next three quarters (16.1 percent in Q2, 12.9 percent in Q3, and 11.0 percent in Q4); will be 10.8 percent in 2020; 8.1 percent in 2021, 6.2 percent in 2022, and 5.1 percent in 2023. The next survey release date is August 14, 2020.

The National Association for Business Economics (NABE) released an Outlook Flash Survey on April 10, 2020. The NABE panel expects GDP declines in Q1 2020 and Q2 2020, and upticks in Q3 2020 and Q4 2020. The panel believes the U.S. economy is already in a recession and predicts real GDP will grow at an annual rate of -2.4 percent for the first quarter of 2020, -26.5 percent for the second quarter of 2020, 2.0 percent in the third quarter of 2020, 5.8 percent in the fourth quarter of 2020, and 6.0 percent in the first quarter of 2021. The forecasters expect unemployment to average 3.8% in Q1 2020. The median unemployment rate projection for Q2 2020 is 12.0%. The unemployment rate is expected to fall back to 9.5% at the end of 2020, and to 6.0% at year-end 2021. The panel’s forecast for the PCE price index less food and energy calls for a slowdown in the annual rate of change from 1.7% in Q1 to 0.8% in Q2 2020. The panel expects the rate to increase gradually to 1.7% in the last half of 2021.

For a more in-depth review and analysis of the economy, please see our mini-book on economic analysis and forecasting entitled: Simple and Effective Economic Forecasting.

Stock Market Valuations

Our estimates of the market valuations for two stock market indices, the Dow Jones Industrial Average (DJIA) and the Standard & Poor’s 500 (S&P 500), can be found in the file below:

Conclusion

During this time of global flux due to the coronavirus, I am leaving the Conclusion discussion below the same as was posted on March 23, 2020. The March 23, 2020 discussion still adequately reflects my thinking on the current state of affairs.

Important Note: While I don’t believe it is time to jump back into the stock market in a big way because of the market’s overvaluation, I have been advising the last few of weeks in this Commentary and in my weekly podcast, Intrinsic Value Wealth Report Radio, that investors can continue building their investment portfolios by selecting individual securities that offer growth and value opportunities.

Reprinted from March 23, 2020

Up until the past week, the economy had been in a stable but somewhat vulnerable state. Nonetheless, it had remained fairly strong. In fact, robust consumer spending and strong labor market conditions had given us confidence that the economy, which had been in its tenth year of expansion, could continue to grow. But we were cautious on this outlook. There were several reasons for our caution. U.S. business growth had been mixed. And global economic growth had been mixed as well. The new coronavirus was becoming a global economic threat, although it was still too early to tell how much of an effect it would ultimately have. Debt is at high levels for consumers, businesses, and government (at all levels of government). Finally, this is an election year that will likely have significant consequences either positively or negatively depending on the outcome of the elections. And of course, it is still too early to tell what the outcome of the elections will be.

In just a few days, the coronavirus’s effect on the economy and the markets went from a ripple to a tsunami. Businesses are shuttering, events are being cancelled or postponed, grocery store shelves are empty, and people are being asked or ordered to stay home. The markets are now deep in bear market territory. The effects on the economy, even given the short time that the economy has been retreating, may be with us for a long time. There is now a much greater risk of a recession, and there has even been some talk of a depression. The government, the Fed, Republicans, and Democrats, and pretty much the entire country, is trying to get the virus under control and is coming up with plans to mitigate the long-term economic effects caused by the virus. But the virus has impacted the economy – in a significant way – in just a short time. How long lasting the effects will be no one can tell right now. The economy has been largely shut down and remains so today. It takes time to restart the economy after a situation such as what is occurring at the present time.

Given these events and the rapidly deteriorating situation, as I said last week, I would caution not to panic. The economy and the markets will get better. The situation is bad – there is no doubt about that – but it will turn around. The real question is when will it turn around? No one knows that at the present time. But it will turn around.

For now, review your investment portfolios. It is highly likely that all or most of your stocks are down. You should not consider selling the bulk of your stocks – only consider selling companies that are not sound companies. But do recognize that as the economy deteriorates, even good companies will be affected.

For stock market value hunters, we believe it is still too early to jump back in. We will be closely monitoring the markets using the many tools and models that we have developed over the years to assess the economy and the markets. We will use our best judgement and thoughts to let you know when we believe things are turning around. The turnaround hasn’t happened yet.

We believe it is important to maintain a long-term view toward investing. But for now, just sit tight. Eventually, this means that you should continue building your investment portfolio using the Cassandra Stock Selection Model to select individual securities that offer growth and value opportunities.

Chart for Review and Thought

S&P 500

Simple and Effective Economic Forecasting Model

Note: The table and chart below have not been updated. However, we believe that a recession is quite likely. In the chart below, the bottom green line shows what a recession could look like.

Notes (GDP Growth Chart):

  1. See the July 8, 2019 Commentary for an introduction to this model.
  2. Actual numbers 2007 through 2019; forecasted numbers thereafter.
  3. Normal GDP growth is typically in the 2% to 3% range.
  4. A recession is generally defined as two consecutive quarters of negative economic growth as measured by a country’s gross domestic product (GDP).

Thought for the Week

As an investor, it is wise to be “Fearful when others are greedy and greedy when others are fearful.” ~ Warren Buffett

Announcements

The Intrinsic Value Wealth Report has started a new YouTube channel called Intrinsic Value Wealth Report TV. You can view the YouTube channel at Intrinsic Value Wealth Report TV.

The Intrinsic Value Wealth Report has started a new podcast called Intrinsic Value Wealth Report Radio. You can listen to the podcast at Intrinsic Value Wealth Report Radio.

Dr. Wendee spoke at the Investment Club of America’s annual economic summit, called Econosummit, on Sunday March 1, 2020 in Las Vegas.

Dr. Wendee attended the The National Due Diligence Alliance (TNDDA) investment banking conference, which was held March 6-8, 2020 at the Four Seasons Resort in Dallas, Texas. This is a conference held several times throughout the year for investment bankers and registered investment advisers to learn about new opportunities in the Alternative Investment asset classes.

TNDDA Meeting in Dallas, Texas

We have been researching the use of crowdsourcing for investment ideas. We will be sending a survey out in the next few weeks to get your input on the economy and the markets; and to get any investment ideas that you would like to share. We will compile this input and distribute the results to you and our other subscribers. We have been testing our crowdsourcing models with students and have been having good success and results.

Dr. Wendee has been researching and writing a new theory of economics known as, The Value Creation Theory of the Economy (also known as, Intrinsinomics). The full paper on Intrinsinomics will be published in the near future.

Finance 3350: Personal Finance-Portfolio & Risk Management– Dr. Wendee started teaching Finance 3350 – Portfolio & Risk Management at California State University, Los Angeles (CSULA) for the Summer term starting May 2020. Dr. Wendee teaches courses in Management and Finance at CSULA.

Business 548: Strategy and Decision Making – Dr. Wendee will be teaching Business 548 – Strategy and Decision Making at California Baptist University (CBU) starting at the end of June 2020. Dr. Wendee teaches courses in Finance, Business, Strategy & Decision Making, and Economics at CBU.

Dr. Wendee presented a paper on his new theory of economics known as, The Value Creation Theory of the Economy (also known as, Intrinsinomics), at the International Leadership Association’s annual global conference which was held in Ottawa, Canada last Fall.

Dr. Wendee will present an updated paper on his new theory of economics known as, The Value Creation Theory of the Economy (also known as, Intrinsinomics), at the International Leadership Association’s annual global conference which will be held in San Francisco, California in November.

Dr. Wendee is working on a financial planning modeling program which will be available in the near future. The modeling program is designed to assist anyone in creating a financial plan and is customizable for each person’s unique financial planning goals. A working draft of the model is currently in beta test with students. Click this link, schematic, to go to the clickable document under the subheading Financial Planning Process (Draft) in the Intrinsic Value Wealth Report to see a draft of the schematic for the new financial planning process.

Dr. Wendee has been developing an econometric model specifically designed to monitor and forecast the global economy as this current economic crisis unfolds. This new econometric model is based on other econometric models that he has designed and have used for many years. You can find some of these earlier models in Book # 6 – Simple and Effective Economic Forecasting in the sister website to this website which is called the Intrinsic Value Wealth Report. The new econometric model has been constructed with some additional tools and methods that he has learned and some that he has developed over the last several years. He will be talking more about this new econometric model in this Commentary over the next few months. His comments and forecasts on the economy and the markets going forward will be based to a significant extent on this new model.

We have begun raising capital for our fund-of-funds investment, Northwest Quadrant Opportunity Fund, LLC. The fund engineers and constructs an investment vehicle consisting of Alternative Asset investments. The fund’s objective is to build a diversified portfolio of strong, solid, steady- performing assets, with highly qualified asset managers who have proven track records that meet our underwriting requirements. To learn more about the Northwest Quadrant Opportunity Fund, LLC and to obtain an offering memorandum, please click Northwest Quadrant Opportunity Fund, LLC.

Intrinsic Value Wealth Creation pyramid

We always conclude our commentary with a discussion of the Intrinsic Value Wealth Creation Pyramid. The Intrinsic Value Wealth Creation Pyramid is designed to show some of the major categories for building wealth. It is the result of many years of study of the wealth building process; experience working with clients who have built considerable wealth; and my own personal experience building wealth. Newsletter subscribers should consult the Intrinsic Value Wealth Creation Pyramid as one of many useful investment tools while considering their investment plans.

The chart in this section is an expanded version of the Intrinsic Value Wealth Creation Pyramid Chart referenced in the Forbes.com article entitled, Nine Of The Best Ways To Build Wealth.

RESOURCES

See our Resources section for links to economic and other resources used in the preparation of this Commentary.

Posted in Economic & Business Chart Room, Economic Outlook, Entrepreneurship, Focus List, Investment Recommendations, Investments, Notes From The Field, Special Situations, Uncategorized, VDI/REEP, Visionary Ideas | Tagged , , , , , , , , , , , , , , , , , , , , , , , , , , , , , , , , , | Comments Off on WEEKLY COMMENTARY June 15, 2020

WEEKLY COMMENTARY June 8, 2020

Coronavirus Resurgence – It’s All in the Numbers

We have been warning the last few weeks that we believe the states have begun reopening too soon. The numbers now support our concerns.

California, Utah, Arizona, North Carolina, Florida, Arkansas and Texas have all reported an increase in the number of cases. These increases have been attributed to the reopenings, relaxed restrictions, activities over the Memorial Day weekend, and the protests, among other factors. This comes at a time when many health experts expected the virus rate to decline because we are coming into the summer season when viruses typically decline in intensity.

In a recent interview with Healthline, Dr. Anthony Fauci had the following comments (excerpted) about the pandemic: “My worst nightmare. To put it bluntly, I’ve been doing this for 36 years, and this is the most unprecedented, disturbing situation we’ve had because of the potential of being what it is and not just potential. It’s a global pandemic…We are still in the middle of an outbreak, and we’ve got to all pull together as a community, as a nation, and as a global population. Because we’re all in the same boat here. This is threatening to all of us, and we cannot forget that. We’ve got to continue to work hard to get control of it.” In addition to what Dr. Faci said, it should be noted that the increase in coronavirus cases is not just limited to the U.S. The head of the World Health Organization also warned that the pandemic is worsening on a global basis.

As investors, our main concern is that a resurgence in the virus will cause the economy to be shut down again with more severe economic consequences than have already been seen. The resurgence in the number of daily cases comes as no surprise to us here at the Intrinsic Value Wealth Report Media Group. We have been forecasting this resurgence for the last few weeks. Having been a professional forecaster in several disciplines over quite a number of years, I can tell you that these are not difficult forecasts to make. One only has to look at the numbers. The forecast that is the most troubling, I believe, is the potential for an exponential increase in the cases. To repeat an example that I have cited several times in this Commentary and in our podcasts: “Here is a good example of what happens in situations with exponential expansion. It goes like this: how long does it take to fill a sports stadium completely to the top with water by starting with just one drop of water and doubling the volume of water every minute? The answer is that it takes less than an hour to completely fill the stadium. Left unchecked, Covid-19 could kill people around the world at a similar exponential rate.”

Economic and Investment Highlights

Last Week

The national meat-supply shortage has begun to ease somewhat, but meat prices remain high.

The pandemic has severely affected the financial condition of cities across the U.S.

SpaceX docked with the International Space Station.

The worst civil unrest in decades erupted in the U.S. over the death of George Floyd. This has impacted many businesses that had anticipated reopening now.

The CBO said the U.S. economy could take a decade to fully recover.

Global manufacturing showed continued weakness.

China’s economic recovery stumbled in May as a result of weak worldwide demand for Chinese goods.

Starbucks said it would continue to limit employee hours.

The ECB raised its bond-buying program to $1.52 trillion.

Unemployment in May unexpectedly fell to 13.3% from 14.7% in April.

Sales of new homes increased 21% in May from a year earlier.

The Dow, the S&P 500, and the Nasdaq all rose for the week. The Dow was up 6.8%; the S&P 500 was up 4.91%; and the Nasdaq was up 3.4%. The 10-year treasury yield ended the week at 0.903%. Gold closed at $1,676.20 for the week. Oil closed at $39.55 for the week.

The Week Ahead

This link takes you to Econoday’s Economic Calendar and Economic Events and Analysis which shows the upcoming economic reporting events scheduled in the week and months ahead.

Summary

Note: The models below may not capture the impact of COVID-19 beyond their impact on GDP source data and relevant economic reports that have already been released. They may not anticipate the impact of COVID-19 on forthcoming economic reports beyond the standard internal dynamics of the models.

Note: The comments that follow are derived from the economic indicators referenced in the Resources section of this newsletter and other sources in this report.

The Aruoba-Diebold-Scotti Business Conditions Index (ALS) had been trending up for several weeks from having dipped in 2019. Recently with the advent of the economic collapse, the index crashed. This is an extremely negative indicator for the economy on a short-term basis.

The GDPNow model estimate for real GDP growth (seasonally adjusted annual rate) in the second quarter of 2020 is -48.5 percent. This reading continues to support the ALS model assessment of a deteriorating short-term economic environment.

The New York Fed Staff Nowcast stands at -25.9% for 2020:Q2 and -12.5 for 2020:Q3.

The Chicago Fed National Activity Index (CFNAI) showed a decrease in economic activity in April. The Chicago Fed National Activity Index (CFNAI) was -16.74 in April, down from -4.97 in March.

All told, these short-term economic indicators are a negative analysis for the economy, at least on a short-term basis.

Expectations that stock prices will rise over the next six months is now at 34.3% in a recent AAII Sentiment Survey. The historical average is 38.0% for the survey. 27.7% of the investors in the survey described their short-term outlook as neutral and 38.1% were bearish. Please see the AAII Sentiment Survey for the complete results.

The latest Gross Output (GO) reading (April 6, 2020) showed that Gross Output slowed significantly in the fourth quarter of 2019.

On a longer-term basis, the forecasters in the Philadelphia Fed’s Survey of Professional Forecasters (as of May 15, 2020) predict real GDP will contract at an annual rate of -32.2 percent for the second quarter of 2020; and increase at 10.6 percent for the third quarter of 2020, 6.5 percent in the fourth quarter of 2020, 6.8 percent in the first quarter of 2021, and 4.1 percent in the second quarter of 2021. On an annual-average over annual-average basis, the forecasters predict real GDP to contract -5.6 percent in 2020; and grow 3.1 percent in 2021, 4.1 percent in 2022 and 2.2 percent in 2023. The forecasters predict the unemployment rate will be above 10.0 percent over the next three quarters (16.1 percent in Q2, 12.9 percent in Q3, and 11.0 percent in Q4); will be 10.8 percent in 2020; 8.1 percent in 2021, 6.2 percent in 2022, and 5.1 percent in 2023. The next survey release date is August 14, 2020.

The National Association for Business Economics (NABE) released an Outlook Flash Survey on April 10, 2020. The NABE panel expects GDP declines in Q1 2020 and Q2 2020, and upticks in Q3 2020 and Q4 2020. The panel believes the U.S. economy is already in a recession and predicts real GDP will grow at an annual rate of -2.4 percent for the first quarter of 2020, -26.5 percent for the second quarter of 2020, 2.0 percent in the third quarter of 2020, 5.8 percent in the fourth quarter of 2020, and 6.0 percent in the first quarter of 2021. The forecasters expect unemployment to average 3.8% in Q1 2020. The median unemployment rate projection for Q2 2020 is 12.0%. The unemployment rate is expected to fall back to 9.5% at the end of 2020, and to 6.0% at year-end 2021. The panel’s forecast for the PCE price index less food and energy calls for a slowdown in the annual rate of change from 1.7% in Q1 to 0.8% in Q2 2020. The panel expects the rate to increase gradually to 1.7% in the last half of 2021.

For a more in-depth review and analysis of the economy, please see our mini-book on economic analysis and forecasting entitled: Simple and Effective Economic Forecasting.

Stock Market Valuations

Our estimates of the market valuations for two stock market indices, the Dow Jones Industrial Average (DJIA) and the Standard & Poor’s 500 (S&P 500), can be found in the file below:

Conclusion

During this time of global flux due to the coronavirus, I am leaving the Conclusion discussion below the same as was posted on March 23, 2020. The March 23, 2020 discussion still adequately reflects my thinking on the current state of affairs.

Important Note: While I don’t believe it is time to jump back into the stock market in a big way because of the market’s overvaluation, I have been advising the last few of weeks in this Commentary and in my weekly podcast, Intrinsic Value Wealth Report Radio, that investors can continue building their investment portfolios by selecting individual securities that offer growth and value opportunities.

Reprinted from March 23, 2020

Up until the past week, the economy had been in a stable but somewhat vulnerable state. Nonetheless, it had remained fairly strong. In fact, robust consumer spending and strong labor market conditions had given us confidence that the economy, which had been in its tenth year of expansion, could continue to grow. But we were cautious on this outlook. There were several reasons for our caution. U.S. business growth had been mixed. And global economic growth had been mixed as well. The new coronavirus was becoming a global economic threat, although it was still too early to tell how much of an effect it would ultimately have. Debt is at high levels for consumers, businesses, and government (at all levels of government). Finally, this is an election year that will likely have significant consequences either positively or negatively depending on the outcome of the elections. And of course, it is still too early to tell what the outcome of the elections will be.

In just a few days, the coronavirus’s effect on the economy and the markets went from a ripple to a tsunami. Businesses are shuttering, events are being cancelled or postponed, grocery store shelves are empty, and people are being asked or ordered to stay home. The markets are now deep in bear market territory. The effects on the economy, even given the short time that the economy has been retreating, may be with us for a long time. There is now a much greater risk of a recession, and there has even been some talk of a depression. The government, the Fed, Republicans, and Democrats, and pretty much the entire country, is trying to get the virus under control and is coming up with plans to mitigate the long-term economic effects caused by the virus. But the virus has impacted the economy – in a significant way – in just a short time. How long lasting the effects will be no one can tell right now. The economy has been largely shut down and remains so today. It takes time to restart the economy after a situation such as what is occurring at the present time.

Given these events and the rapidly deteriorating situation, as I said last week, I would caution not to panic. The economy and the markets will get better. The situation is bad – there is no doubt about that – but it will turn around. The real question is when will it turn around? No one knows that at the present time. But it will turn around.

For now, review your investment portfolios. It is highly likely that all or most of your stocks are down. You should not consider selling the bulk of your stocks – only consider selling companies that are not sound companies. But do recognize that as the economy deteriorates, even good companies will be affected.

For stock market value hunters, we believe it is still too early to jump back in. We will be closely monitoring the markets using the many tools and models that we have developed over the years to assess the economy and the markets. We will use our best judgement and thoughts to let you know when we believe things are turning around. The turnaround hasn’t happened yet.

We believe it is important to maintain a long-term view toward investing. But for now, just sit tight. Eventually, this means that you should continue building your investment portfolio using the Cassandra Stock Selection Model to select individual securities that offer growth and value opportunities.

Chart for Review and Thought

Unemployment Rate

Simple and Effective Economic Forecasting Model

Note: The table and chart below have not been updated. However, we believe that a recession is quite likely. In the chart below, the bottom green line shows what a recession could look like.

Notes (GDP Growth Chart):

  1. See the July 8, 2019 Commentary for an introduction to this model.
  2. Actual numbers 2007 through 2019; forecasted numbers thereafter.
  3. Normal GDP growth is typically in the 2% to 3% range.
  4. A recession is generally defined as two consecutive quarters of negative economic growth as measured by a country’s gross domestic product (GDP).

Thought for the Week

“Necessity Is the Mother of Invention” ~ Unknown

Announcements

The Intrinsic Value Wealth Report has started a new YouTube channel called Intrinsic Value Wealth Report TV. You can view the YouTube channel at Intrinsic Value Wealth Report TV.

The Intrinsic Value Wealth Report has started a new podcast called Intrinsic Value Wealth Report Radio. You can listen to the podcast at Intrinsic Value Wealth Report Radio.

Dr. Wendee spoke at the Investment Club of America’s annual economic summit, called Econosummit, on Sunday March 1, 2020 in Las Vegas.

Dr. Wendee attended the The National Due Diligence Alliance (TNDDA) investment banking conference, which was held March 6-8, 2020 at the Four Seasons Resort in Dallas, Texas. This is a conference held several times throughout the year for investment bankers and registered investment advisers to learn about new opportunities in the Alternative Investment asset classes.

TNDDA Meeting in Dallas, Texas

We have been researching the use of crowdsourcing for investment ideas. We will be sending a survey out in the next few weeks to get your input on the economy and the markets; and to get any investment ideas that you would like to share. We will compile this input and distribute the results to you and our other subscribers. We have been testing our crowdsourcing models with students and have been having good success and results.

Dr. Wendee has been researching and writing a new theory of economics known as, The Value Creation Theory of the Economy (also known as, Intrinsinomics). The full paper on Intrinsinomics will be published in the near future.

Finance 3350: Personal Finance-Portfolio & Risk Management– Dr. Wendee started teaching Finance 3350 – Portfolio & Risk Management at California State University, Los Angeles (CSULA) for the Summer term starting May 2020. Dr. Wendee teaches courses in Management and Finance at CSULA.

Business 548: Strategy and Decision Making – Dr. Wendee will be teaching Business 548 – Strategy and Decision Making at California Baptist University (CBU) starting at the end of June 2020. Dr. Wendee teaches courses in Finance, Business, Strategy & Decision Making, and Economics at CBU.

Dr. Wendee presented a paper on his new theory of economics known as, The Value Creation Theory of the Economy (also known as, Intrinsinomics), at the International Leadership Association’s annual global conference which was held in Ottawa, Canada last Fall.

Dr. Wendee will present an updated paper on his new theory of economics known as, The Value Creation Theory of the Economy (also known as, Intrinsinomics), at the International Leadership Association’s annual global conference which will be held in San Francisco, California in November.

Dr. Wendee is working on a financial planning modeling program which will be available in the near future. The modeling program is designed to assist anyone in creating a financial plan and is customizable for each person’s unique financial planning goals. A working draft of the model is currently in beta test with students. Click this link, schematic, to go to the clickable document under the subheading Financial Planning Process (Draft) in the Intrinsic Value Wealth Report to see a draft of the schematic for the new financial planning process.

Dr. Wendee has been developing an econometric model specifically designed to monitor and forecast the global economy as this current economic crisis unfolds. This new econometric model is based on other econometric models that he has designed and have used for many years. You can find some of these earlier models in Book # 6 – Simple and Effective Economic Forecasting in the sister website to this website which is called the Intrinsic Value Wealth Report. The new econometric model has been constructed with some additional tools and methods that he has learned and some that he has developed over the last several years. He will be talking more about this new econometric model in this Commentary over the next few months. His comments and forecasts on the economy and the markets going forward will be based to a significant extent on this new model.

We have begun raising capital for our fund-of-funds investment, Northwest Quadrant Opportunity Fund, LLC. The fund engineers and constructs an investment vehicle consisting of Alternative Asset investments. The fund’s objective is to build a diversified portfolio of strong, solid, steady- performing assets, with highly qualified asset managers who have proven track records that meet our underwriting requirements. To learn more about the Northwest Quadrant Opportunity Fund, LLC and to obtain an offering memorandum, please click Northwest Quadrant Opportunity Fund, LLC.

Intrinsic Value Wealth Creation pyramid

We always conclude our commentary with a discussion of the Intrinsic Value Wealth Creation Pyramid. The Intrinsic Value Wealth Creation Pyramid is designed to show some of the major categories for building wealth. It is the result of many years of study of the wealth building process; experience working with clients who have built considerable wealth; and my own personal experience building wealth. Newsletter subscribers should consult the Intrinsic Value Wealth Creation Pyramid as one of many useful investment tools while considering their investment plans.

The chart in this section is an expanded version of the Intrinsic Value Wealth Creation Pyramid Chart referenced in the Forbes.com article entitled, Nine Of The Best Ways To Build Wealth.

RESOURCES

See our Resources section for links to economic and other resources used in the preparation of this Commentary.

Posted in Economic & Business Chart Room, Economic Outlook, Entrepreneurship, Focus List, Investment Recommendations, Investments, Notes From The Field, Special Situations, Uncategorized, VDI/REEP, Visionary Ideas | Tagged , , , , , , , , , , , , , , , , , , , , , , , , , , , , , , , , , | Comments Off on WEEKLY COMMENTARY June 8, 2020

WEEKLY COMMENTARY June 1, 2020

Why People Protest (In Search of a Cause)

The violence and destruction that followed the protests that started as a result of the police incident with George Floyd in Minneapolis this past weekend has further hampered the economic recovery nationally and in many regions of the U.S. As investors, it is worthwhile exploring why people protest so that we can better understand this phenomenon and assess the impact that the protests might have on the current economic and investment environment and the likelihood of future such occurrences that impact the economy and the investment climate.

Peaceful protest is a fundamental right that we as Americans have. But why do people protest? The roots of protests and other group behavior are explained by various aspects of crowd theory and individual psychology in a collection of theories studied by sociologists, psychologists, and others. To begin with, humans prefer the status quo and safety. Accordingly, there must be certain conditions to get people to break out of this norm. Those factors are often feelings of helplessness, fear, and frustration. The perceived injustice of an event like the George Floyd incident can be a flashpoint for acting on these feelings and creating collective disorder.

Some of the necessary factors that can create the conditions for protests include shared grievances, lack of trust in government, crowd behavior, social or geographical proximity to others that share the same feelings, the ability of people to remain anonymous in crowds, the feeling of safety by being in a crowd, and a feeling of belonging. Given the need that many people have for association and identification with a crowd, some researchers have suggested that oftentimes people are simply in search of a cause. An interesting aspect of protests is that peaceful protests are often more effective than violent protests, as violence tends to drive people to the opposing viewpoint.

The violence, looting, and other social and economic disruptions that we have seen in the past few days are further hampering the ability of the economy to recover. Unfortunately, some of the hardest hit businesses are the ones in the lower income communities. Furthermore, the protests are taking attention away from the fight against the coronavirus. And the lack of social distancing that many of the protesters have been practicing further exasperates the spread of the virus.

Economic and Investment Highlights

Last Week

Global trade flows had a large decline in the first quarter.

Many people left their homes during the Memorial Day weekend amid warnings of continuing dangers from the coronavirus.

Japan fully lifted its state of emergency on the coronavirus declaring victory over the virus.

New coronavirus outbreaks occurred in Europe.

The U.S. economy is showing some nascent signs of recovery.

Amtrak is preparing to cut up to 20% of its workforce amid slowdown in train travel.

Boeing plans cuts of 13,000 employees.

GE said it is leaving the business of making light bulbs, a business it had been in for almost 100 years.

Disney plans to reopen it Disney World theme park at reduced capacity in July.

The U.S. surpassed 100,000 deaths from the coronavirus this past week.

There is some evidence that layoffs from the pandemic are easing.

China passed a law to impose national security laws on Hong Kong.

New York state drove virus cases down this past week. At the same time, several Southern states had an increase in coronavirus cases this past week.

U.S. consumers spent less and saved more in April.

Renault is planning to cut production capacity by one-fifth and cut more than 14,000 jobs globally.

The Dow, the S&P 500, and the Nasdaq all rose for the week. The Dow was up 3.8%; the S&P 500 was up 3.01%; and the Nasdaq was up 1.8%. The 10-year treasury yield ended the week at 0.650%. Gold closed at $1,736.90 for the week. Oil closed at $35.49 for the week.

The Week Ahead

This link takes you to Econoday’s Economic Calendar and Economic Events and Analysis which shows the upcoming economic reporting events scheduled in the week and months ahead.

Summary

Note: The models below may not capture the impact of COVID-19 beyond their impact on GDP source data and relevant economic reports that have already been released. They may not anticipate the impact of COVID-19 on forthcoming economic reports beyond the standard internal dynamics of the models.

Note: The comments that follow are derived from the economic indicators referenced in the Resources section of this newsletter and other sources in this report.

The Aruoba-Diebold-Scotti Business Conditions Index (ALS) had been trending up for several weeks from having dipped in 2019. Recently with the advent of the economic collapse, the index crashed. This is an extremely negative indicator for the economy on a short-term basis.

The GDPNow model estimate for real GDP growth (seasonally adjusted annual rate) in the second quarter of 2020 is -53.8 percent. This reading continues to support the ALS model assessment of a deteriorating short-term economic environment.

The New York Fed Staff Nowcast stands at -35.5% for 2020:Q2.

The Chicago Fed National Activity Index (CFNAI) showed a decrease in economic activity in April. The Chicago Fed National Activity Index (CFNAI) was -16.74 in April, down from -4.97 in March.

All told, these short-term economic indicators are a negative analysis for the economy, at least on a short-term basis.

Expectations that stock prices will rise over the next six months is now at 33.1% in a recent AAII Sentiment Survey. The historical average is 38.0% for the survey. 24.8% of the investors in the survey described their short-term outlook as neutral and 42.1% were bearish. Please see the AAII Sentiment Survey for the complete results.

The latest Gross Output (GO) reading (April 6, 2020) showed that Gross Output slowed significantly in the fourth quarter of 2019.

On a longer-term basis, the forecasters in the Philadelphia Fed’s Survey of Professional Forecasters (as of May 15, 2020) predict real GDP will contract at an annual rate of -32.2 percent for the second quarter of 2020; and increase at 10.6 percent for the third quarter of 2020, 6.5 percent in the fourth quarter of 2020, 6.8 percent in the first quarter of 2021, and 4.1 percent in the second quarter of 2021. On an annual-average over annual-average basis, the forecasters predict real GDP to contract -5.6 percent in 2020; and grow 3.1 percent in 2021, 4.1 percent in 2022 and 2.2 percent in 2023. The forecasters predict the unemployment rate will be above 10.0 percent over the next three quarters (16.1 percent in Q2, 12.9 percent in Q3, and 11.0 percent in Q4); will be 10.8 percent in 2020; 8.1 percent in 2021, 6.2 percent in 2022, and 5.1 percent in 2023. The next survey release date is August 14, 2020.

The National Association for Business Economics (NABE) released an Outlook Flash Survey on April 10, 2020. The NABE panel expects GDP declines in Q1 2020 and Q2 2020, and upticks in Q3 2020 and Q4 2020. The panel believes the U.S. economy is already in a recession and predicts real GDP will grow at an annual rate of -2.4 percent for the first quarter of 2020, -26.5 percent for the second quarter of 2020, 2.0 percent in the third quarter of 2020, 5.8 percent in the fourth quarter of 2020, and 6.0 percent in the first quarter of 2021. The forecasters expect unemployment to average 3.8% in Q1 2020. The median unemployment rate projection for Q2 2020 is 12.0%. The unemployment rate is expected to fall back to 9.5% at the end of 2020, and to 6.0% at year-end 2021. The panel’s forecast for the PCE price index less food and energy calls for a slowdown in the annual rate of change from 1.7% in Q1 to 0.8% in Q2 2020. The panel expects the rate to increase gradually to 1.7% in the last half of 2021.

For a more in-depth review and analysis of the economy, please see our mini-book on economic analysis and forecasting entitled: Simple and Effective Economic Forecasting.

Stock Market Valuations

Our estimates of the market valuations for two stock market indices, the Dow Jones Industrial Average (DJIA) and the Standard & Poor’s 500 (S&P 500), can be found in the file below:

Conclusion

During this time of global flux due to the coronavirus, I am leaving the Conclusion discussion below the same as was posted on March 23, 2020. The March 23, 2020 discussion still adequately reflects my thinking on the current state of affairs.

Important Note: While I don’t believe it is time to jump back into the stock market in a big way because of the market’s overvaluation, I have been advising the last few of weeks in this Commentary and in my weekly podcast, Intrinsic Value Wealth Report Radio, that investors can continue building their investment portfolios by selecting individual securities that offer growth and value opportunities.

Reprinted from March 23, 2020

Up until the past week, the economy had been in a stable but somewhat vulnerable state. Nonetheless, it had remained fairly strong. In fact, robust consumer spending and strong labor market conditions had given us confidence that the economy, which had been in its tenth year of expansion, could continue to grow. But we were cautious on this outlook. There were several reasons for our caution. U.S. business growth had been mixed. And global economic growth had been mixed as well. The new coronavirus was becoming a global economic threat, although it was still too early to tell how much of an effect it would ultimately have. Debt is at high levels for consumers, businesses, and government (at all levels of government). Finally, this is an election year that will likely have significant consequences either positively or negatively depending on the outcome of the elections. And of course, it is still too early to tell what the outcome of the elections will be.

In just a few days, the coronavirus’s effect on the economy and the markets went from a ripple to a tsunami. Businesses are shuttering, events are being cancelled or postponed, grocery store shelves are empty, and people are being asked or ordered to stay home. The markets are now deep in bear market territory. The effects on the economy, even given the short time that the economy has been retreating, may be with us for a long time. There is now a much greater risk of a recession, and there has even been some talk of a depression. The government, the Fed, Republicans, and Democrats, and pretty much the entire country, is trying to get the virus under control and is coming up with plans to mitigate the long-term economic effects caused by the virus. But the virus has impacted the economy – in a significant way – in just a short time. How long lasting the effects will be no one can tell right now. The economy has been largely shut down and remains so today. It takes time to restart the economy after a situation such as what is occurring at the present time.

Given these events and the rapidly deteriorating situation, as I said last week, I would caution not to panic. The economy and the markets will get better. The situation is bad – there is no doubt about that – but it will turn around. The real question is when will it turn around? No one knows that at the present time. But it will turn around.

For now, review your investment portfolios. It is highly likely that all or most of your stocks are down. You should not consider selling the bulk of your stocks – only consider selling companies that are not sound companies. But do recognize that as the economy deteriorates, even good companies will be affected.

For stock market value hunters, we believe it is still too early to jump back in. We will be closely monitoring the markets using the many tools and models that we have developed over the years to assess the economy and the markets. We will use our best judgement and thoughts to let you know when we believe things are turning around. The turnaround hasn’t happened yet.

We believe it is important to maintain a long-term view toward investing. But for now, just sit tight. Eventually, this means that you should continue building your investment portfolio using the Cassandra Stock Selection Model to select individual securities that offer growth and value opportunities.

Chart for Review and Thought

Real GDP

Simple and Effective Economic Forecasting Model

Note: The table and chart below have not been updated. However, we believe that a recession is quite likely. In the chart below, the bottom green line shows what a recession could look like.

Notes (GDP Growth Chart):

  1. See the July 8, 2019 Commentary for an introduction to this model.
  2. Actual numbers 2007 through 2019; forecasted numbers thereafter.
  3. Normal GDP growth is typically in the 2% to 3% range.
  4. A recession is generally defined as two consecutive quarters of negative economic growth as measured by a country’s gross domestic product (GDP).

Thought for the Week

“Live as if you were to die tomorrow. Learn as if you were to live forever.” ~ Mahatma Gandhi

Announcements

The Intrinsic Value Wealth Report has started a new YouTube channel called Intrinsic Value Wealth Report TV. You can view the YouTube channel at Intrinsic Value Wealth Report TV.

The Intrinsic Value Wealth Report has started a new podcast called Intrinsic Value Wealth Report Radio. You can listen to the podcast at Intrinsic Value Wealth Report Radio.

Dr. Wendee spoke at the Investment Club of America’s annual economic summit, called Econosummit, on Sunday March 1, 2020 in Las Vegas.

Dr. Wendee attended the The National Due Diligence Alliance (TNDDA) investment banking conference, which was held March 6-8, 2020 at the Four Seasons Resort in Dallas, Texas. This is a conference held several times throughout the year for investment bankers and registered investment advisers to learn about new opportunities in the Alternative Investment asset classes.

TNDDA Meeting in Dallas, Texas

We have been researching the use of crowdsourcing for investment ideas. We will be sending a survey out in the next few weeks to get your input on the economy and the markets; and to get any investment ideas that you would like to share. We will compile this input and distribute the results to you and our other subscribers. We have been testing our crowdsourcing models with students and have been having good success and results.

Dr. Wendee has been researching and writing a new theory of economics known as, The Value Creation Theory of the Economy (also known as, Intrinsinomics). The full paper on Intrinsinomics will be published in the near future.

Finance 3350: Personal Finance-Portfolio & Risk Management– Dr. Wendee started teaching Finance 3350 – Portfolio & Risk Management at California State University, Los Angeles (CSULA) for the Summer term starting May 2020. Dr. Wendee teaches courses in Management and Finance at CSULA.

Business 548: Strategy and Decision Making – Dr. Wendee will be teaching Business 548 – Strategy and Decision Making at California Baptist University (CBU) starting at the end of June 2020. Dr. Wendee teaches courses in Finance, Business, Strategy & Decision Making, and Economics at CBU.

Dr. Wendee presented a paper on his new theory of economics known as, The Value Creation Theory of the Economy (also known as, Intrinsinomics), at the International Leadership Association’s annual global conference which was held in Ottawa, Canada last Fall.

Dr. Wendee will present an updated paper on his new theory of economics known as, The Value Creation Theory of the Economy (also known as, Intrinsinomics), at the International Leadership Association’s annual global conference which will be held in San Francisco, California in November.

Dr. Wendee is working on a financial planning modeling program which will be available in the near future. The modeling program is designed to assist anyone in creating a financial plan and is customizable for each person’s unique financial planning goals. A working draft of the model is currently in beta test with students. Click this link, schematic, to go to the clickable document under the subheading Financial Planning Process (Draft) in the Intrinsic Value Wealth Report to see a draft of the schematic for the new financial planning process.

Dr. Wendee has been developing an econometric model specifically designed to monitor and forecast the global economy as this current economic crisis unfolds. This new econometric model is based on other econometric models that he has designed and have used for many years. You can find some of these earlier models in Book # 6 – Simple and Effective Economic Forecasting in the sister website to this website which is called the Intrinsic Value Wealth Report. The new econometric model has been constructed with some additional tools and methods that he has learned and some that he has developed over the last several years. He will be talking more about this new econometric model in this Commentary over the next few months. His comments and forecasts on the economy and the markets going forward will be based to a significant extent on this new model.

We have begun raising capital for our fund-of-funds investment, Northwest Quadrant Opportunity Fund, LLC. The fund engineers and constructs an investment vehicle consisting of Alternative Asset investments. The fund’s objective is to build a diversified portfolio of strong, solid, steady- performing assets, with highly qualified asset managers who have proven track records that meet our underwriting requirements. To learn more about the Northwest Quadrant Opportunity Fund, LLC and to obtain an offering memorandum, please click Northwest Quadrant Opportunity Fund, LLC.

Intrinsic Value Wealth Creation pyramid

We always conclude our commentary with a discussion of the Intrinsic Value Wealth Creation Pyramid. The Intrinsic Value Wealth Creation Pyramid is designed to show some of the major categories for building wealth. It is the result of many years of study of the wealth building process; experience working with clients who have built considerable wealth; and my own personal experience building wealth. Newsletter subscribers should consult the Intrinsic Value Wealth Creation Pyramid as one of many useful investment tools while considering their investment plans.

The chart in this section is an expanded version of the Intrinsic Value Wealth Creation Pyramid Chart referenced in the Forbes.com article entitled, Nine Of The Best Ways To Build Wealth.

RESOURCES

See our Resources section for links to economic and other resources used in the preparation of this Commentary.

Posted in Economic & Business Chart Room, Economic Outlook, Entrepreneurship, Focus List, Investment Recommendations, Investments, Notes From The Field, Special Situations, Uncategorized, VDI/REEP, Visionary Ideas | Tagged , , , , , , , , , , , , , , , , , , , , , , , , , , , , , , , , , | Comments Off on WEEKLY COMMENTARY June 1, 2020

WEEKLY COMMENTARY May 25, 2020

Are We Coming Off the Bottom or Is This a “Dead Cat Bounce”*?

*See the following link for a definition of a “Dead Cat Bounce.”

My comments in this article come from me the scientist – not from me the friend, not from me the business associate, not from me the libertarian, and not from any other “me.” It is strictly a scientific viewpoint that I am sharing after having done a lot of research and having followed the coronavirus situation pretty closely the past few months. I have many friends, business associates, colleagues, and others who will undoubtably disagree with me. But as has often been said: “Reasonable people can disagree.” My basis for this article is strictly an examination of the data. And the data is very clear as I will explain.

I believe that we as a global society are opening up much too quickly. And I believe that too many people have written-off the coronavirus situation as something that really is not very serious. That is a big mistake in my view. Here is my reasoning.

The number of cases worldwide and in the United States continues to rise. It is true that the rate of increase appears to be abating – but that is probably due to the effectiveness of the efforts of social distancing and lockdown that have been in place. In other words, it is not an accident or some chance event that Covid-19 is abating. It is the result of the extensive sacrifice and extreme measures that the world has put in place. Despite these efforts, we do not have a cure, a vaccine, or any real treatments for the virus yet. They will come, but we don’t have them yet. But now we are opening back up without a vaccine or a cure for the virus.

All fifty states have now started opening back up. Will they put into place and enforce the safeguards that have been recommended as necessary for a safe reopening? Or will they succumb to political pressure to do otherwise? Even more importantly, will the citizens of the world follow these guidelines and recommendations? My observations and conversations with people in Southern California and from other places globally that I have had recently, and over this Memorial Day weekend in particular, suggest otherwise. As I have already suggested, many people don’t think we are really in a pandemic situation and some either think the government is misdirected, or worse, trying to use Covid-19 as a way to control the populace.

Please don’t get me wrong. I generally don’t trust government either and I believe that government overreaches in all too many cases. While I do support the lockdowns and other restrictions that have put in place in this very unusual pandemic situation, I fear the all-too-likely “big government” mentality and acceptance of big government that may result from this crisis. But the exponential rate at which the pandemic could and has spread necessitates drastic measures. I summed it up this way in the May 11, 2020 Commentary of this newsletter: “…many people don’t trust government and other authority figures and believe that the government is just trying to control them. By the way, I agree with this conclusion in many situations – but not when it comes to forest fires; severe weather warnings; and pandemics that have reputable health officials giving the warnings.” In other words, these are scientists and professionals with nothing to lose except their credibility. For this reason, I believe they are telling us the truth.

Where do we now stand with respect to the economy. We are at a turning point. We have started to open back up. As I have been chronicling in this newsletter since the pandemic began, there has been very significant damage to the worldwide economy. Are we now at the bottom of the economic crisis and starting back up on the slow road to recovery? I believe the answer to that largely depends upon several factors: (1) how soon we get an actual cure and/or vaccine for the virus; (2) how many effective safeguards will states and other worldwide economies put in place and will they enforce those measures; and (3) how diligently will people follow the safeguards that have been put in place? I am not encouraged by what I have seen in any of these three areas. First, we are getting closer, but not close enough yet, to finding a vaccine and/or cure. Second, states seem to be bowing to political pressures. And finally, too many people have not been taking the virus as seriously as I believe the pandemic warrants. As I will discuss next, a second wave of the pandemic is very likely, especially given where we stand with respect to the aforementioned factors.

During this crisis, there are many people who I have been listening to for insight into the crisis and its consequences. There are two people that I have paid particular attention to – not just because they are very smart people, which they are – but because they are in a better position than most people to see what is happening with the coronavirus situation, and more importantly, because they are in a position to influence the outcomes. These two people are Anthony Fauci, Director of the National Institute of Allergy and Infectious Diseases and Jerome Powell, Chairman of the United States Federal Reserve. Both have warned of the dangers of opening the economy too soon and doing so without proper safeguards in place. Dr. Fauci has repeatedly warned of the danger of a “second wave” of the virus and of its effects on the economy as well as the health of the nation. Chairman Powell has warned of the extreme dangers to the economy if the country is opened too soon and the economy has to be shut down again. The forecasts that these two men and others are making are not difficult forecasts. The data shows very clearly the path of the virus and the adverse effects on the worldwide economy. The real problem is that too many people, including many of the world’s leaders, have not headed the warnings of the scientists, who like Dr. Fauci and Chairman Powell, have the access and the analytical capability to understand the data. Again, the data is very clear in its conclusions.

An additional concern that I have is that while many people, perhaps even most, have been taking the pandemic seriously, it only takes a relatively few people to start the pandemic over again. Remember, it appears to have been just a few people in China that started the pandemic in the first place. And it is worth reviewing again the example that I gave in the May 4, 2020 issue of the Commentary: “Here is a good example of what happens in situations with exponential expansion. It goes like this: how long does it take to fill a sports stadium completely to the top with water by starting with just one drop of water and doubling the volume of water every minute? The answer is that it takes less than an hour to completely fill the stadium. Left unchecked, Covid-19 could kill people around the world at a similar exponential rate. In my view, it is too early to reopen!”

We are at a turning point. Economies have started opening back up. Is it too soon? Only time will tell. If proper safeguards are put into place and enforced as economies open back up, it may go well. People will have to believe that there is still a significant risk from Covid-19 and adhere to the safeguards put into place. There is no strong evidence that either of these things will happen. As economists and investors, we must factor the reality of the situation into our forecasts. The point of this article is not to make a societal judgement. The point is to try to draw an accurate picture of where we now stand in a possible economic recovery and to highlight the very real danger that a second wave of the pandemic might occur and have disastrous results for the economy and the markets. As investors, we need to understand and assess all of the various possibilities. We need to be data scientists. We need to look at this situation from the standpoint of probabilities. And the probabilities do not look favorable in the short run for the health of the world’s population or for a global economic recovery.

I would like to end on this more philosophical note, however. While I support the restrictions that have been put into place to protect our health in this crisis, let us not lose sight of the very real dangers that these restrictions have posed for creating a “big government” mentality that could be difficult to reverse after the crisis. And let us never lose sight of our fundamental freedoms and our right to liberty. This crisis will pass, but our right to freedom and liberty must never pass!

Economic and Investment Highlights

Last Week

Auto makers opened their factories on Monday.

Fed Chair Powell said the U.S. economy could take more than a year to recover.

Saudi Arabia’s sovereign wealth fund has been investing billions of dollars in U.S. companies.

Uber is cutting thousands more jobs and closing 45 offices.

SoftBank recorded the worst results in its history.

J.C. Penney plans to close 242 department stores totaling 30 percent of its stores.

Oil prices have started coming back due to supply cuts and a global pickup in demand.

States are expected to ask the federal government to repay them $45 billion they spent fighting the coronavirus.

IBM is cutting part of its workforce.

Argentina defaulted on its sovereign debt for the ninth time in its history.

Hertz filed for bankruptcy protection.

The Dow, the S&P 500, and the Nasdaq all rose for the week. The Dow was up 3.3%; the S&P 500 was up 3.2%; and the Nasdaq was up 3.4%. The 10-year treasury yield ended the week at 0.659%. Gold closed at $1,734.60 for the week. Oil closed at $33.25 for the week.

The Week Ahead

This link takes you to Econoday’s Economic Calendar and Economic Events and Analysis which shows the upcoming economic reporting events scheduled in the week and months ahead.

Summary

Note: The models below may not capture the impact of COVID-19 beyond their impact on GDP source data and relevant economic reports that have already been released. They may not anticipate the impact of COVID-19 on forthcoming economic reports beyond the standard internal dynamics of the models.

Note: The comments that follow are derived from the economic indicators referenced in the Resources section of this newsletter and other sources in this report.

The Aruoba-Diebold-Scotti Business Conditions Index (ALS) had been trending up for several weeks from having dipped in 2019. Recently with the advent of the economic collapse, the index crashed. This is an extremely negative indicator for the economy on a short-term basis.

The GDPNow model estimate for real GDP growth (seasonally adjusted annual rate) in the second quarter of 2020 is -51.2 percent. This reading continues to support the ALS model assessment of a deteriorating short-term economic environment.

The New York Fed Staff Nowcast stands at -35.5% for 2020:Q2.

The Chicago Fed National Activity Index (CFNAI) showed a decrease in economic activity in April. The Chicago Fed National Activity Index (CFNAI) was -16.74 in April, down from -4.97 in March.

All told, these short-term economic indicators are a negative analysis for the economy, at least on a short-term basis.

Expectations that stock prices will rise over the next six months is now at 33.1% in a recent AAII Sentiment Survey. The historical average is 38.0% for the survey. 24.8% of the investors in the survey described their short-term outlook as neutral and 42.1% were bearish. Please see the AAII Sentiment Survey for the complete results.

The latest Gross Output (GO) reading (April 6, 2020) showed that Gross Output slowed significantly in the fourth quarter of 2019.

On a longer-term basis, the forecasters in the Philadelphia Fed’s Survey of Professional Forecasters (as of May 15, 2020) predict real GDP will contract at an annual rate of -32.2 percent for the second quarter of 2020; and increase at 10.6 percent for the third quarter of 2020, 6.5 percent in the fourth quarter of 2020, 6.8 percent in the first quarter of 2021, and 4.1 percent in the second quarter of 2021. On an annual-average over annual-average basis, the forecasters predict real GDP to contract -5.6 percent in 2020; and grow 3.1 percent in 2021, 4.1 percent in 2022 and 2.2 percent in 2023. The forecasters predict the unemployment rate will be above 10.0 percent over the next three quarters (16.1 percent in Q2, 12.9 percent in Q3, and 11.0 percent in Q4); will be 10.8 percent in 2020; 8.1 percent in 2021, 6.2 percent in 2022, and 5.1 percent in 2023. The next survey release date is August 14, 2020.

The National Association for Business Economics (NABE) released an Outlook Flash Survey on April 10, 2020. The NABE panel expects GDP declines in Q1 2020 and Q2 2020, and upticks in Q3 2020 and Q4 2020. The panel believes the U.S. economy is already in a recession and predicts real GDP will grow at an annual rate of -2.4 percent for the first quarter of 2020, -26.5 percent for the second quarter of 2020, 2.0 percent in the third quarter of 2020, 5.8 percent in the fourth quarter of 2020, and 6.0 percent in the first quarter of 2021. The forecasters expect unemployment to average 3.8% in Q1 2020. The median unemployment rate projection for Q2 2020 is 12.0%. The unemployment rate is expected to fall back to 9.5% at the end of 2020, and to 6.0% at year-end 2021. The panel’s forecast for the PCE price index less food and energy calls for a slowdown in the annual rate of change from 1.7% in Q1 to 0.8% in Q2 2020. The panel expects the rate to increase gradually to 1.7% in the last half of 2021.

For a more in-depth review and analysis of the economy, please see our mini-book on economic analysis and forecasting entitled: Simple and Effective Economic Forecasting.

Stock Market Valuations

Our estimates of the market valuations for two stock market indices, the Dow Jones Industrial Average (DJIA) and the Standard & Poor’s 500 (S&P 500), can be found in the file below:

Conclusion

During this time of global flux due to the coronavirus, I am leaving the Conclusion discussion below the same as was posted on March 23, 2020. The March 23, 2020 discussion still adequately reflects my thinking on the current state of affairs.

Important Note: While I don’t believe it is time to jump back into the stock market in a big way because of the market’s overvaluation, I have been advising the last few of weeks in this Commentary and in my weekly podcast, Intrinsic Value Wealth Report Radio, that investors can continue building their investment portfolios by selecting individual securities that offer growth and value opportunities.

Reprinted from March 23, 2020

Up until the past week, the economy had been in a stable but somewhat vulnerable state. Nonetheless, it had remained fairly strong. In fact, robust consumer spending and strong labor market conditions had given us confidence that the economy, which had been in its tenth year of expansion, could continue to grow. But we were cautious on this outlook. There were several reasons for our caution. U.S. business growth had been mixed. And global economic growth had been mixed as well. The new coronavirus was becoming a global economic threat, although it was still too early to tell how much of an effect it would ultimately have. Debt is at high levels for consumers, businesses, and government (at all levels of government). Finally, this is an election year that will likely have significant consequences either positively or negatively depending on the outcome of the elections. And of course, it is still too early to tell what the outcome of the elections will be.

In just a few days, the coronavirus’s effect on the economy and the markets went from a ripple to a tsunami. Businesses are shuttering, events are being cancelled or postponed, grocery store shelves are empty, and people are being asked or ordered to stay home. The markets are now deep in bear market territory. The effects on the economy, even given the short time that the economy has been retreating, may be with us for a long time. There is now a much greater risk of a recession, and there has even been some talk of a depression. The government, the Fed, Republicans, and Democrats, and pretty much the entire country, is trying to get the virus under control and is coming up with plans to mitigate the long-term economic effects caused by the virus. But the virus has impacted the economy – in a significant way – in just a short time. How long lasting the effects will be no one can tell right now. The economy has been largely shut down and remains so today. It takes time to restart the economy after a situation such as what is occurring at the present time.

Given these events and the rapidly deteriorating situation, as I said last week, I would caution not to panic. The economy and the markets will get better. The situation is bad – there is no doubt about that – but it will turn around. The real question is when will it turn around? No one knows that at the present time. But it will turn around.

For now, review your investment portfolios. It is highly likely that all or most of your stocks are down. You should not consider selling the bulk of your stocks – only consider selling companies that are not sound companies. But do recognize that as the economy deteriorates, even good companies will be affected.

For stock market value hunters, we believe it is still too early to jump back in. We will be closely monitoring the markets using the many tools and models that we have developed over the years to assess the economy and the markets. We will use our best judgement and thoughts to let you know when we believe things are turning around. The turnaround hasn’t happened yet.

We believe it is important to maintain a long-term view toward investing. But for now, just sit tight. Eventually, this means that you should continue building your investment portfolio using the Cassandra Stock Selection Model to select individual securities that offer growth and value opportunities.

Chart for Review and Thought

S & P 500

Simple and Effective Economic Forecasting Model

Note: The table and chart below have not been updated. However, we believe that a recession is quite likely. In the chart below, the bottom green line shows what a recession could look like.

Notes (GDP Growth Chart):

  1. See the July 8, 2019 Commentary for an introduction to this model.
  2. Actual numbers 2007 through 2019; forecasted numbers thereafter.
  3. Normal GDP growth is typically in the 2% to 3% range.
  4. A recession is generally defined as two consecutive quarters of negative economic growth as measured by a country’s gross domestic product (GDP).

Thought for the Week

“A mind is like a parachute. It doesn’t work if it is not open.” ~ Frank Zappa

Announcements

The Intrinsic Value Wealth Report has started a new YouTube channel called Intrinsic Value Wealth Report TV. You can view the YouTube channel at Intrinsic Value Wealth Report TV.

The Intrinsic Value Wealth Report has started a new podcast called Intrinsic Value Wealth Report Radio. You can listen to the podcast at Intrinsic Value Wealth Report Radio.

Dr. Wendee spoke at the Investment Club of America’s annual economic summit, called Econosummit, on Sunday March 1, 2020 in Las Vegas.

Dr. Wendee attended the The National Due Diligence Alliance (TNDDA) investment banking conference, which was held March 6-8, 2020 at the Four Seasons Resort in Dallas, Texas. This is a conference held several times throughout the year for investment bankers and registered investment advisers to learn about new opportunities in the Alternative Investment asset classes.

TNDDA Meeting in Dallas, Texas

We have been researching the use of crowdsourcing for investment ideas. We will be sending a survey out in the next few weeks to get your input on the economy and the markets; and to get any investment ideas that you would like to share. We will compile this input and distribute the results to you and our other subscribers. We have been testing our crowdsourcing models with students and have been having good success and results.

Dr. Wendee has been researching and writing a new theory of economics known as, The Value Creation Theory of the Economy (also known as, Intrinsinomics). The full paper on Intrinsinomics will be published in the near future.

Finance 3350: Personal Finance-Portfolio & Risk Management– Dr. Wendee started teaching Finance 3350 – Portfolio & Risk Management at California State University, Los Angeles (CSULA) starting January 2020. Dr. Wendee teaches courses in Management and Finance at CSULA. He will be teaching Finance 3350 – Portfolio & Risk Management at California State University, Los Angeles (CSULA) during the Summer term of 2020 as well.

Business 4970:Strategic Management – Dr. Wendee started teaching  Business 4970:Strategic Management  at California State University, Los Angeles (CSULA) starting January 2020. Dr. Wendee teaches courses in Management and Finance at CSULA.

Business 218 – Macroeconomics – Dr. Wendee started teaching Business 218 – Macroeconomics at California Baptist University (CBU) starting January 2020. Dr. Wendee teaches courses in Finance and Economics at CBU.

Dr. Wendee presented a paper on his new theory of economics known as, The Value Creation Theory of the Economy (also known as, Intrinsinomics), at the International Leadership Association’s annual global conference which was held in Ottawa, Canada last Fall.

Dr. Wendee is working on a financial planning modeling program which will be available in the near future. The modeling program is designed to assist anyone in creating a financial plan and is customizable for each person’s unique financial planning goals. A working draft of the model is currently in beta test with students. Click this link, schematic, to go to the clickable document under the subheading Financial Planning Process (Draft) in the Intrinsic Value Wealth Report to see a draft of the schematic for the new financial planning process.

Dr. Wendee has been developing an econometric model specifically designed to monitor and forecast the global economy as this current economic crisis unfolds. This new econometric model is based on other econometric models that he has designed and have used for many years. You can find some of these earlier models in Book # 6 – Simple and Effective Economic Forecasting in the sister website to this website which is called the Intrinsic Value Wealth Report. The new econometric model has been constructed with some additional tools and methods that he has learned and some that he has developed over the last several years. He will be talking more about this new econometric model in this Commentary over the next few months. His comments and forecasts on the economy and the markets going forward will be based to a significant extent on this new model.

We have begun raising capital for our fund-of-funds investment, Northwest Quadrant Opportunity Fund, LLC. The fund engineers and constructs an investment vehicle consisting of Alternative Asset investments. The fund’s objective is to build a diversified portfolio of strong, solid, steady- performing assets, with highly qualified asset managers who have proven track records that meet our underwriting requirements. To learn more about the Northwest Quadrant Opportunity Fund, LLC and to obtain an offering memorandum, please click Northwest Quadrant Opportunity Fund, LLC.

Intrinsic Value Wealth Creation pyramid

We always conclude our commentary with a discussion of the Intrinsic Value Wealth Creation Pyramid. The Intrinsic Value Wealth Creation Pyramid is designed to show some of the major categories for building wealth. It is the result of many years of study of the wealth building process; experience working with clients who have built considerable wealth; and my own personal experience building wealth. Newsletter subscribers should consult the Intrinsic Value Wealth Creation Pyramid as one of many useful investment tools while considering their investment plans.

The chart in this section is an expanded version of the Intrinsic Value Wealth Creation Pyramid Chart referenced in the Forbes.com article entitled, Nine Of The Best Ways To Build Wealth.

RESOURCES

See our Resources section for links to economic and other resources used in the preparation of this Commentary.

Posted in Economic & Business Chart Room, Economic Outlook, Entrepreneurship, Focus List, Investment Recommendations, Investments, Notes From The Field, Special Situations, Uncategorized, VDI/REEP, Visionary Ideas | Tagged , , , , , , , , , , , , , , , , , , , , , , , , , , , , , , , , , | Comments Off on WEEKLY COMMENTARY May 25, 2020