
If You Want to Understand the Financial Markets, Read the Bible
I’ve been studying the Bible to gain a better appreciation for its historical and literary significance. Besides being the word of God, it is a fascinating and insightful account of human nature and the history of humanity over thousands of years.
As I was studying the Bible the other night, it occurred to me that if one wants to understand the financial markets, one should read the Bible. How so, you might ask? It is because the Bible is an account of human history and human nature over thousands of years and because of that we can gain an appreciation for the human nature that characterizes and influences the financial markets. In other words, human beings are human beings and they haven’t really changed much in thousands of years. The Bible documents that reality quite well. By the way, to gain this understanding of the psychology and sociology of humanity, it doesn’t matter whether you study the Christian Bible or the Hebrew Bible (the Old Testament). Human nature didn’t change much, if at all, over the timeframe covered by both of those biblical accounts.
The Bible is, among other things, a study of human history, sociology, and psychology. It is insights from those fields that will make one a better investor. To be a good investor, one must understand human history, sociology, and psychology. One particularly important aspect of human behavior that an investor must understand is how people think – i.e., the System 1 and System 2 thinking that we have been discussing in a few of the recent Commentaries. Tetlock (2015) describes it this way: “System 2 is the familiar realm of conscious thought. It consists of everything we choose to focus on. By contrast, System 1 is largely a stranger to us. It is the realm of automatic perceptual and cognitive operations…System 1 comes first. It is fast and constantly running in the background. If a question is asked and you instantly know the answer, it sprang from System 1. System 2 is charged with interrogating that answer.”
In the July 13, 2020 Commentary, I described how System 1 and System 2 thinking applies to the market: “…the stock market is a reflection of the dichotomy of System 1 and System 2 thinking…The calculation of the [stock market’s] Intrinsic Value Line reflects System 2 thinking, whereas the daily market fluctuations around that line reflect System 1 thinking.
Geoghegan and Homan (2003) note: The Bible is “…a collection of works by a variety of authors… The Bible includes legal texts, history, poetry, philosophy, music, personal correspondence, and prophecies… Those who wrote the Bible were also a diverse bunch, and include shepherds, kings, farmers, priests, poets, scribes, prophets, and fishermen…” Because of this, the Bible has a wonderfully diverse but comprehensive perspective on humanity. Whether we are talking about Old Testament times, New Testament times, or the 21st Century, people haven’t really changed all that much, if at all, so we can gain wonderful insights about human nature from the Bible.
One could, and should, also study history and philosophy directly to learn about human nature. But the Bible would be a good place to start in any event. The important thing is for one to gain an understanding of history in general and human nature in particular, regardless of where they get that perspective, because as writer and philosopher George Santayana said: “Those who cannot remember the past are condemned to repeat it.” And repeating past mistakes in the financial markets can be devastating but is avoidable if one has a knowledge of the history of financial markets and human nature in general.
References
Geoghegan, J. and M. Homan (2003). The Bible for Dummies. New Jersey, John Wiley & Sons.
Tetlock, P. E. and D. Gardner (2015). Superforecasting: The art and science of prediction. New York, Crown Publishing.
Economic and Investment Highlights
Last Week
The Nasdaq fell into correction territory last week.
Tesla was passed over for inclusion in the S&P 500. Its shares fell 21%.
The mortgage market was strong in the Spring due to low mortgage rates.
Simon and Brookfield agreed to acquire J.C. Penney out of bankruptcy.
The number of jobs available in the U.S. leveled off in the late summer, a further indication that momentum in the labor market is easing. The number of people getting jobless benefits has remained at historically high levels.
The U.K. placed new restrictions on social gatherings, joining other European countries in imposing new restrictions to curb the pandemic.
Starwood lost seven malls after a bond default.
The Dow, the S&P 500 and the Nasdaq fell for the week. The Dow was down 1.7%; the S&P 500 was down 2.51%; and the Nasdaq was down 4.1%. The 10-year treasury yield ended the week at 0.668%. Gold closed at $1,937.80 for the week. Oil closed at $37.33 for the week.
The Week Ahead
This link takes you to Econoday’s Economic Calendar and Economic Events and Analysis which shows the upcoming economic reporting events scheduled in the week and months ahead.
Summary
Note: The models below may not capture the impact of COVID-19 beyond their impact on GDP source data and relevant economic reports that have already been released. They may not anticipate the impact of COVID-19 on forthcoming economic reports beyond the standard internal dynamics of the models.
Note: The comments that follow are derived from the economic indicators referenced in the Resources section of this newsletter and other sources in this report.
The Aruoba-Diebold-Scotti Business Conditions Index (ALS) had been trending up for several weeks from having dipped in 2019. Recently with the advent of the economic collapse, the index crashed. It has now been generally trending down again, but fluctuating within a narrow band. This is a slightly positive indicator for the economy on a short-term basis.
The GDPNow model estimate for real GDP growth (seasonally adjusted annual rate) in the third quarter of 2020 is 29.6 percent. This reading agrees with the ALS model assessment of an improving short-term economic environment.
The New York Fed Staff Nowcast stands at 15.68 percent for 2020:Q3 and 7.27 percent for 2020:Q4.
The Chicago Fed National Activity Index (CFNAI) showed an increase in economic activity in June. The Chicago Fed National Activity Index (CFNAI) was +1.18 in July, down from +5.33 in June.
All told, these short-term economic indicators are a mixed analysis for the economy, at least on a short-term basis.
Expectations that stock prices will rise over the next six months is now at 23.7% in a recent AAII Sentiment Survey. The historical average is 38.0% for the survey. 27.8% of the investors in the survey described their short-term outlook as neutral and 48.5% were bearish. Please see the AAII Sentiment Survey for the complete results.
The latest Gross Output (GO) reading (July 6, 2020) showed that Gross Output slowed significantly in the first quarter of 2020.
Advisor Perspectives publishes a monthly market valuation update. The following is the update for August (published September 10, 2020): August 2020: Market Valuation, Inflation and Treasury Yields. Advisor Perspectives has other useful and interesting investment information at this website.
On a longer-term basis, the forecasters in the Philadelphia Fed’s Survey of Professional Forecasters (as of August 14, 2020) predict real GDP will increase at 19.1 percent for the third quarter of 2020, 5.8 percent in the fourth quarter of 2020, 5.2 percent in the first quarter of 2021, 3.8 percent in the second quarter of 2021, and 3.6 percent in the third quarter of 2021. On an annual-average over annual-average basis, the forecasters predict real GDP to contract -5.2 percent in 2020; and grow 3.2 percent in 2021, 3.5 percent in 2022 and 2.2 percent in 2023. The forecasters predict the unemployment rate will be 10.0 percent in Q3 and 9.5 percent in Q4; and will be 9.0 percent in 2020; 8.0 percent in 2021, 6.0 percent in 2022, and 5.3 percent in 2023. The next survey release date is November 16, 2020.
The National Association for Business Economics (NABE) released its Economic Policy Survey on August 24, 2020 which is summarized as follows: “Nearly two-thirds of the National Association for Business Economics members who participated in the August 2020 NABE Economic Policy Survey believe the U.S. economy continues to be in a recession that began last February,” said NABE President Constance Hunter, CBE, chief economist, KPMG. “Almost half the respondents expects inflation-adjusted gross domestic product to remain below its fourth-quarter 2019 level until the second half of 2022 or later. And 80% of panelists indicate there is at least a one-in-four chance of a ‘double-dip’ recession.
“The panel is split in its view on Congress’s fiscal response to the recession, with 40% calling the response insufficient, 37% indicating the response is adequate, and 11% saying it is excessive,” Hunter continued. “Nearly three out of four panelists believe the optimal size for the next fiscal package to be $1 trillion or greater, compared to 17% who favor a smaller package.”
“More than three-quarters of panelists believe that the current stance of U.S. monetary policy is appropriate, the largest share holding this view since 2007,” added Survey Chair Gregory Daco, chief U.S. economist, Oxford Economics. “The majority of panelists—58%—expects the federal funds rate range to remain unchanged at 0-0.25%, or even drop lower, by the end of 2021. Most participants—84%—expect that the funds rate target will be higher by year-end 2022, but still within 100 basis points of where it is currently.
“Panelists were asked to select the three most important policy issues that the next presidential administration should address during its first year in office,” Daco added. “Combating COVID-19, promoting economic recovery, and health policy were cited more frequently than a dozen other choices.”
For a more in-depth review and analysis of the economy, please see our mini-book on economic analysis and forecasting entitled: Simple and Effective Economic Forecasting.
Stock Market Valuations
Our estimates of the market valuations for two stock market indices, the Dow Jones Industrial Average (DJIA) and the Standard & Poor’s 500 (S&P 500), can be found in the file below:
Conclusion
During this time of global flux due to the coronavirus, I am leaving the Conclusion discussion below the same as was posted on March 23, 2020. The March 23, 2020 discussion still adequately reflects my thinking on the current state of affairs.
Important Note: While I don’t believe it is time to jump back into the stock market in a big way because of the market’s overvaluation, I have been advising the last few of weeks in this Commentary and in my weekly podcast, Intrinsic Value Wealth Report Radio, that investors can continue building their investment portfolios by selecting individual securities that offer growth and value opportunities.
Reprinted from March 23, 2020
Up until the past week, the economy had been in a stable but somewhat vulnerable state. Nonetheless, it had remained fairly strong. In fact, robust consumer spending and strong labor market conditions had given us confidence that the economy, which had been in its tenth year of expansion, could continue to grow. But we were cautious on this outlook. There were several reasons for our caution. U.S. business growth had been mixed. And global economic growth had been mixed as well. The new coronavirus was becoming a global economic threat, although it was still too early to tell how much of an effect it would ultimately have. Debt is at high levels for consumers, businesses, and government (at all levels of government). Finally, this is an election year that will likely have significant consequences either positively or negatively depending on the outcome of the elections. And of course, it is still too early to tell what the outcome of the elections will be.
In just a few days, the coronavirus’s effect on the economy and the markets went from a ripple to a tsunami. Businesses are shuttering, events are being cancelled or postponed, grocery store shelves are empty, and people are being asked or ordered to stay home. The markets are now deep in bear market territory. The effects on the economy, even given the short time that the economy has been retreating, may be with us for a long time. There is now a much greater risk of a recession, and there has even been some talk of a depression. The government, the Fed, Republicans, and Democrats, and pretty much the entire country, is trying to get the virus under control and is coming up with plans to mitigate the long-term economic effects caused by the virus. But the virus has impacted the economy – in a significant way – in just a short time. How long lasting the effects will be no one can tell right now. The economy has been largely shut down and remains so today. It takes time to restart the economy after a situation such as what is occurring at the present time.
Given these events and the rapidly deteriorating situation, as I said last week, I would caution not to panic. The economy and the markets will get better. The situation is bad – there is no doubt about that – but it will turn around. The real question is when will it turn around? No one knows that at the present time. But it will turn around.
For now, review your investment portfolios. It is highly likely that all or most of your stocks are down. You should not consider selling the bulk of your stocks – only consider selling companies that are not sound companies. But do recognize that as the economy deteriorates, even good companies will be affected.
For stock market value hunters, we believe it is still too early to jump back in. We will be closely monitoring the markets using the many tools and models that we have developed over the years to assess the economy and the markets. We will use our best judgement and thoughts to let you know when we believe things are turning around. The turnaround hasn’t happened yet.
We believe it is important to maintain a long-term view toward investing. But for now, just sit tight. Eventually, this means that you should continue building your investment portfolio using the Cassandra Stock Selection Model to select individual securities that offer growth and value opportunities.
Chart for Review and Thought

Simple and Effective Economic Forecasting Model
Note: The table and chart below have not been updated. However, we believe that a recession is quite likely. In the chart below, the bottom green line shows what a recession could look like.
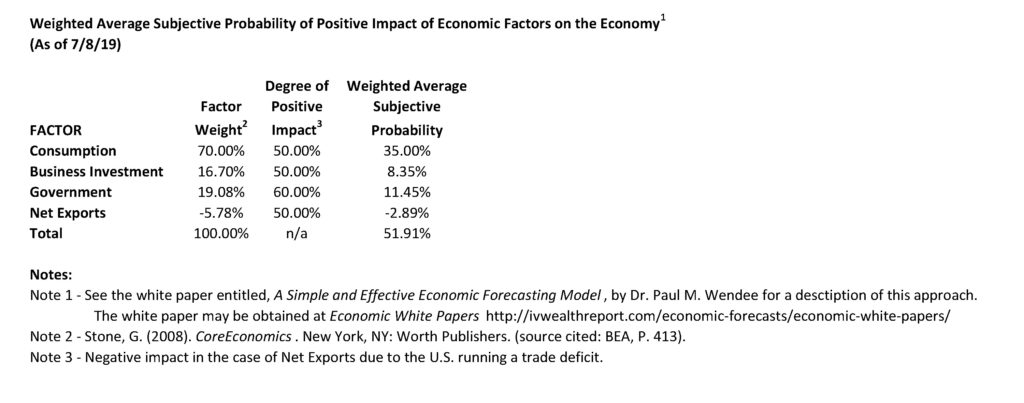
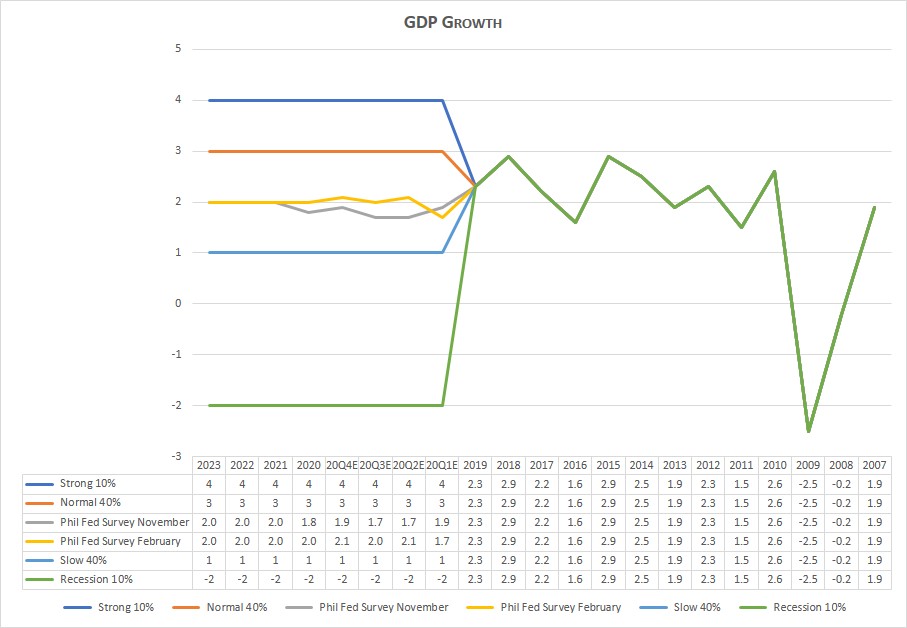
Notes (GDP Growth Chart):
- See the July 8, 2019 Commentary for an introduction to this model.
- Actual numbers 2007 through 2019; forecasted numbers thereafter.
- Normal GDP growth is typically in the 2% to 3% range.
- A recession is generally defined as two consecutive quarters of negative economic growth as measured by a country’s gross domestic product (GDP).
Thought for the Week
“Do what you can, with what you have, where you are.” ~ Theodore Roosevelt
Announcements
The Intrinsic Value Wealth Report has started a new YouTube channel called Intrinsic Value Wealth Report TV. You can view the YouTube channel at Intrinsic Value Wealth Report TV.
The Intrinsic Value Wealth Report has started a new podcast called Intrinsic Value Wealth Report Radio. You can listen to the podcast at Intrinsic Value Wealth Report Radio.
Dr. Wendee spoke at the Investment Club of America’s annual economic summit, called Econosummit, on Sunday March 1, 2020 in Las Vegas.
Dr. Wendee attended the The National Due Diligence Alliance (TNDDA) investment banking conference, which was held March 6-8, 2020 at the Four Seasons Resort in Dallas, Texas. This is a conference held several times throughout the year for investment bankers and registered investment advisers to learn about new opportunities in the Alternative Investment asset classes.

We have been researching the use of crowdsourcing for investment ideas. We will be sending a survey out in the next few weeks to get your input on the economy and the markets; and to get any investment ideas that you would like to share. We will compile this input and distribute the results to you and our other subscribers. We have been testing our crowdsourcing models with students and have been having good success and results.
Dr. Wendee has been researching and writing a new theory of economics known as, The Value Creation Theory of the Economy (also known as, Intrinsinomics). The full paper on Intrinsinomics will be published in the near future.
Finance 3350: Personal Finance-Portfolio & Risk Management– Dr. Wendee taught teaching Finance 3350 – Portfolio & Risk Management at California State University, Los Angeles (CSULA) for the Summer term starting May 2020. Dr. Wendee teaches courses in Management and Finance at CSULA.
Business 548: Strategy and Decision Making – Dr. Wendee taught Business 548 – Strategy and Decision Making at California Baptist University (CBU) starting at the end of June 2020. Dr. Wendee teaches courses in Finance, Business, Strategy & Decision Making, and Economics at CBU.
Business 303: Business Finance – Dr. Wendee will be teaching Business 303 – Business Finance at California Baptist University (CBU) starting at the end of August 2020. Dr. Wendee teaches courses in Finance, Business, Strategy & Decision Making, and Economics at CBU.
Dr. Wendee presented a paper on his new theory of economics known as, The Value Creation Theory of the Economy (also known as, Intrinsinomics), at the International Leadership Association’s annual global conference which was held in Ottawa, Canada last Fall.
Dr. Wendee will present an updated paper on his new theory of economics known as, The Value Creation Theory of the Economy (also known as, Intrinsinomics), at the International Leadership Association’s annual global conference which will be held in San Francisco, California in November.
Dr. Wendee will be delivering a talk entitled: Using Alternative Assets to Increase Portfolio Returns and Decrease Risk at the BrightTalk Q4 2020 Outlook Summit on October 28, 2020. You can access additional information on the summit and Dr. Wendee’s presentation here.
Dr. Wendee is working on a financial planning modeling program which will be available in the near future. The modeling program is designed to assist anyone in creating a financial plan and is customizable for each person’s unique financial planning goals. A working draft of the model is currently in beta test with students. Click this link, schematic, to go to the clickable document under the subheading Financial Planning Process (Draft) in the Intrinsic Value Wealth Report to see a draft of the schematic for the new financial planning process.
Dr. Wendee has been developing an econometric model specifically designed to monitor and forecast the global economy as this current economic crisis unfolds. This new econometric model is based on other econometric models that he has designed and have used for many years. You can find some of these earlier models in Book # 6 – Simple and Effective Economic Forecasting in the sister website to this website which is called the Intrinsic Value Wealth Report. The new econometric model has been constructed with some additional tools and methods that he has learned and some that he has developed over the last several years. He will be talking more about this new econometric model in this Commentary over the next few months. His comments and forecasts on the economy and the markets going forward will be based to a significant extent on this new model.
We have begun raising capital for our fund-of-funds investment, Northwest Quadrant Opportunity Fund, LLC. The fund engineers and constructs an investment vehicle consisting of Alternative Asset investments. The fund’s objective is to build a diversified portfolio of strong, solid, steady- performing assets, with highly qualified asset managers who have proven track records that meet our underwriting requirements. To learn more about the Northwest Quadrant Opportunity Fund, LLC and to obtain an offering memorandum, please click Northwest Quadrant Opportunity Fund, LLC.
Intrinsic Value Wealth Creation pyramid
We always conclude our commentary with a discussion of the Intrinsic Value Wealth Creation Pyramid. The Intrinsic Value Wealth Creation Pyramid is designed to show some of the major categories for building wealth. It is the result of many years of study of the wealth building process; experience working with clients who have built considerable wealth; and my own personal experience building wealth. Newsletter subscribers should consult the Intrinsic Value Wealth Creation Pyramid as one of many useful investment tools while considering their investment plans.
The chart in this section is an expanded version of the Intrinsic Value Wealth Creation Pyramid Chart referenced in the Forbes.com article entitled, Nine Of The Best Ways To Build Wealth.
RESOURCES
See our Resources section for links to economic and other resources used in the preparation of this Commentary.