
WEEKLY COMMENTARY October 6, 2020

The Missing Piece in the Macroeconomic Puzzle

For the first time, the Bureau of Economic Analysis (BEA) has released the “top line” gross output (GO) at the same time as the “bottom line” GDP. The Wall Street Journal has just published an article written by Dr. Mark Skousen on this important milestone: New Stat Augurs Well for Covid Recovery.  Dr. Skousen calls GO the missing piece in the macroeconomic puzzle. According to Wikipedia:

“In economics, gross output (GO) is the measure of total economic activity in the production of new goods and services in an accounting period. It is a much broader measure of the economy than gross domestic product (GDP), which is limited mainly to final output (finished goods and services). As of first-quarter 2019, the Bureau of Economic Analysis estimated gross output in the United States to be $37.2 trillion, compared to $21.1 trillion for GDP.

“GO is defined by the Bureau of Economic Analysis (BEA) as ‘a measure of an industry’s sales or receipts, which can include sales to final users in the economy (GDP) or sales to other industries (intermediate inputs). Gross output can also be measured as the sum of an industry’s value added and intermediate inputs.’

“It is equal to the value of net output or GDP (also known as gross value added) plus intermediate consumption.

“Gross output represents, roughly speaking, the total value of sales by producing enterprises (their turnover) in an accounting period (e.g. a quarter or a year), before subtracting the value of intermediate goods used up in production.

“Starting in April 2014, the BEA began publishing gross output and gross output-by-industry on a quarterly basis, along with GDP.

“Economists regard GO and GDP as complementary aggregate measures of the economy. Many analysts view GO as a more comprehensive way to analyze the economy and the business cycle. Gross output (GO) is the natural measure of the production sector, while net output (GDP) is appropriate as a measure of welfare. Both are required in a complete system of accounts.”

Dr. Skousen also issued a press release with more detail and some very interesting charts on GO at www.grossoutput.com.  Steve Forbes also did a three-minute video on GO:  https://www.youtube.com/watch?v=WoYF-ous_mU

In celebration of this special occasion (the first time the government has released GO and GDP on the same day), Dr. Skousen hosted a one hour webinar on GO Day with panelists Steve Forbes, Sean Flynn (Scripps College and primary writer of the McConnell Brue Flynn textbook), David Ranson (chief economist, HCWE, Inc.), and Steve Hanke (Johns Hopkins University).  The webinar was courtesy of Chapman University.  You can watch it here:  https://chapman.zoom.us/rec/share/KJ17YjuR_6zthmgOA5fNprv2e65F-jICOsf430bJvnu8qWzdPYPfTohPC48qRLe9.Q8rmnlXynnTN74Tv?startTime=1601488807000

More economic analysts, including David Ranson (HCWE, Inc.) and Jerry Bowyer, CEO of Bowyer Research, are now using GO to forecast economic growth. We have been using GO at the Intrinsic Value Wealth Report Newsletter, along with other economic indicators, to forecast economic growth for several years.

Economic and Investment Highlights

Last Week

Grocery stores and food companies are preparing for a possible surge in pandemic related sales as Covid-19 cases rise.

President Trump nominated Judge Amy Barrett to fill the vacancy on the Supreme Court.

The death toll from the coronavirus reached 1 million on a global basis.

Disney said it would lay off 28,000 workers at its domestic theme parks. California’s Disneyland will likely remain closed for the foreseeable future.

Retail store closings in the U.S. reached a record in the first half of 2020. The industry is on pace for record bankruptcies and liquidations for the year.

Consumer confidence rose in September.

Employees in Manhattan are returning to their offices at a slow pace, causing concerns that New York City may face a much slower recovery than much of the rest of the country.

U.S. stocks notched record gains in the second quarter. For the quarter, the S&P 500 was up 8.5%; the Dow was up 7.6%; and the Nasdaq was up 11%.

Palantir and Asana both completed direct listings on the NYSE.

China’s government has been involved in a wave of acquisitions in Europe over the past decade according to new research.

Shell said it will cut 9,000 jobs.

Allstate plans to lay off 3,800 employees.

California set diversity quotas for boards.

Personal income fell 2.7% in August. Layoffs and unemployment levels remain high suggesting the U.S. economic recovery is losing momentum. A growing number of layoffs have turned permanent.

Major oil companies signaled they remain under severe financial pressure.

The U.S. auto industry showed signs of recovery in the third quarter.

Trump tested positive for Covid-19 and was hospitalized.

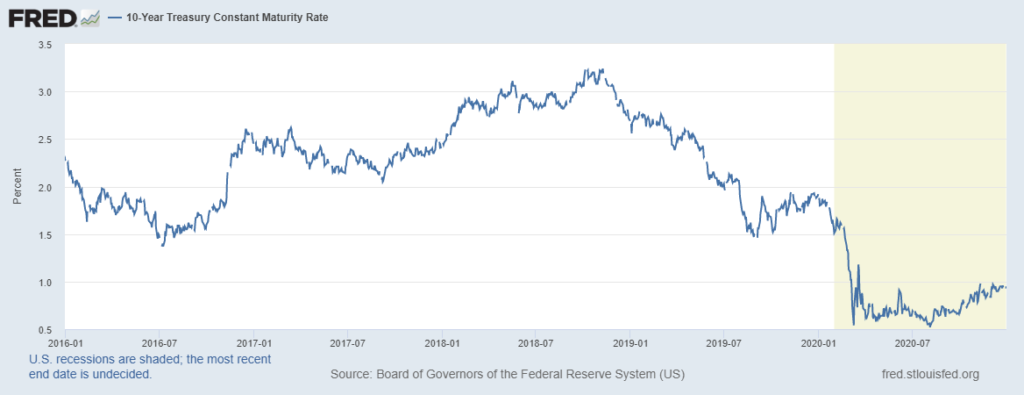
The Dow, the S&P 500, and the Nasdaq all rose for the week. The Dow was up1.87; the S&P 500 was up 1.52%; and the Nasdaq was up 1.5%. The 10-year treasury yield ended the week at 0.694%. Gold closed at $1,900.20 for the week. Oil closed at $37.05 for the week.

The Week Ahead

This link takes you to Econoday’s Economic Calendar and Economic Events and Analysis which shows the upcoming economic reporting events scheduled in the week and months ahead.

Summary

Note: The models below may not capture the impact of COVID-19 beyond their impact on GDP source data and relevant economic reports that have already been released. They may not anticipate the impact of COVID-19 on forthcoming economic reports beyond the standard internal dynamics of the models.

Note: The comments that follow are derived from the economic indicators referenced in the Resources section of this newsletter and other sources in this report.

The Aruoba-Diebold-Scotti Business Conditions Index (ALS) had been trending up for several weeks from having dipped in 2019. Recently with the advent of the economic collapse, the index crashed. It has now been generally trending down again, but fluctuating within a narrow band. This is a slightly positive indicator for the economy on a short-term basis.

The GDPNow model estimate for real GDP growth (seasonally adjusted annual rate) in the third quarter of 2020 is 35.3 percent. This reading agrees with the ALS model assessment of an improving short-term economic environment.

The New York Fed Staff Nowcast stands at 14.04 percent for 2020:Q3 and 4.77 percent for 2020:Q4.

The Chicago Fed National Activity Index (CFNAI) showed an increase in economic activity in June. The Chicago Fed National Activity Index (CFNAI) was  was +0.79 in August, down from +2.54 in July.

All told, these short-term economic indicators are a mixed analysis for the economy, at least on a short-term basis.

Expectations that stock prices will rise over the next six months is now at 34.7% in a recent AAII Sentiment Survey. The historical average is 38.0% for the survey. 26.3% of the investors in the survey described their short-term outlook as neutral and 39.0% were bearish. Please see the AAII Sentiment Survey for the complete results.

The latest Gross Output (GO) reading (July 6, 2020) showed that Gross Output slowed significantly in the first quarter of 2020.

Advisor Perspectives publishes a monthly market valuation update. The following is the update for August (published September 10, 2020): August 2020: Market Valuation, Inflation and Treasury YieldsAdvisor Perspectives has other useful and interesting investment information at this website.

On a longer-term basis, the forecasters in the Philadelphia Fed’s Survey of Professional Forecasters (as of August 14, 2020) predict real GDP will increase at 19.1 percent for the third quarter of 2020, 5.8 percent in the fourth quarter of 2020, 5.2 percent in the first quarter of 2021, 3.8 percent in the second quarter of 2021, and 3.6 percent in the third quarter of 2021. On an annual-average over annual-average basis, the forecasters predict real GDP to contract -5.2 percent in 2020; and grow 3.2 percent in 2021, 3.5 percent in 2022 and 2.2 percent in 2023. The forecasters predict the unemployment rate will be 10.0 percent in Q3 and 9.5 percent in Q4; and will be 9.0 percent in 2020; 8.0 percent in 2021, 6.0 percent in 2022, and 5.3 percent in 2023. The next survey release date is November 16, 2020.

The National Association for Business Economics (NABE) released its Economic Policy Survey on August 24, 2020 which is summarized as follows: “Nearly two-thirds of the National Association for Business Economics members who participated in the August 2020 NABE Economic Policy Survey believe the U.S. economy continues to be in a recession that began last February,” said NABE President Constance Hunter, CBE, chief economist, KPMG. “Almost half the respondents expects inflation-adjusted gross domestic product to remain below its fourth-quarter 2019 level until the second half of 2022 or later. And 80% of panelists indicate there is at least a one-in-four chance of a ‘double-dip’ recession.

“The panel is split in its view on Congress’s fiscal response to the recession, with 40% calling the response insufficient, 37% indicating the response is adequate, and 11% saying it is excessive,” Hunter continued. “Nearly three out of four panelists believe the optimal size for the next fiscal package to be $1 trillion or greater, compared to 17% who favor a smaller package.”

“More than three-quarters of panelists believe that the current stance of U.S. monetary policy is appropriate, the largest share holding this view since 2007,” added Survey Chair Gregory Daco, chief U.S. economist, Oxford Economics. “The majority of panelists—58%—expects the federal funds rate range to remain unchanged at 0-0.25%, or even drop lower, by the end of 2021. Most participants—84%—expect that the funds rate target will be higher by year-end 2022, but still within 100 basis points of where it is currently.

“Panelists were asked to select the three most important policy issues that the next presidential administration should address during its first year in office,” Daco added. “Combating COVID-19, promoting economic recovery, and health policy were cited more frequently than a dozen other choices.”

For a more in-depth review and analysis of the economy, please see our mini-book on economic analysis and forecasting entitled: Simple and Effective Economic Forecasting.

Stock Market Valuations

Our estimates of the market valuations for two stock market indices, the Dow Jones Industrial Average (DJIA) and the Standard & Poor’s 500 (S&P 500), can be found in the file below:

Conclusion

During this time of global flux due to the coronavirus, I am leaving the Conclusion discussion below the same as was posted on March 23, 2020. The March 23, 2020 discussion still adequately reflects my thinking on the current state of affairs.

Important Note: While I don’t believe it is time to jump back into the stock market in a big way because of the market’s overvaluation, I have been advising the last few of weeks in this Commentary and in my weekly podcast, Intrinsic Value Wealth Report Radio, that investors can continue building their investment portfolios by selecting individual securities that offer growth and value opportunities.

Reprinted from March 23, 2020

Up until the past week, the economy had been in a stable but somewhat vulnerable state. Nonetheless, it had remained fairly strong. In fact, robust consumer spending and strong labor market conditions had given us confidence that the economy, which had been in its tenth year of expansion, could continue to grow. But we were cautious on this outlook. There were several reasons for our caution. U.S. business growth had been mixed. And global economic growth had been mixed as well. The new coronavirus was becoming a global economic threat, although it was still too early to tell how much of an effect it would ultimately have. Debt is at high levels for consumers, businesses, and government (at all levels of government). Finally, this is an election year that will likely have significant consequences either positively or negatively depending on the outcome of the elections. And of course, it is still too early to tell what the outcome of the elections will be.

In just a few days, the coronavirus’s effect on the economy and the markets went from a ripple to a tsunami. Businesses are shuttering, events are being cancelled or postponed, grocery store shelves are empty, and people are being asked or ordered to stay home. The markets are now deep in bear market territory. The effects on the economy, even given the short time that the economy has been retreating, may be with us for a long time. There is now a much greater risk of a recession, and there has even been some talk of a depression. The government, the Fed, Republicans, and Democrats, and pretty much the entire country, is trying to get the virus under control and is coming up with plans to mitigate the long-term economic effects caused by the virus. But the virus has impacted the economy – in a significant way – in just a short time. How long lasting the effects will be no one can tell right now. The economy has been largely shut down and remains so today. It takes time to restart the economy after a situation such as what is occurring at the present time.

Given these events and the rapidly deteriorating situation, as I said last week, I would caution not to panic. The economy and the markets will get better. The situation is bad – there is no doubt about that – but it will turn around. The real question is when will it turn around? No one knows that at the present time. But it will turn around.

For now, review your investment portfolios. It is highly likely that all or most of your stocks are down. You should not consider selling the bulk of your stocks – only consider selling companies that are not sound companies. But do recognize that as the economy deteriorates, even good companies will be affected.

For stock market value hunters, we believe it is still too early to jump back in. We will be closely monitoring the markets using the many tools and models that we have developed over the years to assess the economy and the markets. We will use our best judgement and thoughts to let you know when we believe things are turning around. The turnaround hasn’t happened yet.

We believe it is important to maintain a long-term view toward investing. But for now, just sit tight. Eventually, this means that you should continue building your investment portfolio using the Cassandra Stock Selection Model to select individual securities that offer growth and value opportunities.

Chart for Review and Thought
S & P 500

Simple and Effective Economic Forecasting Model

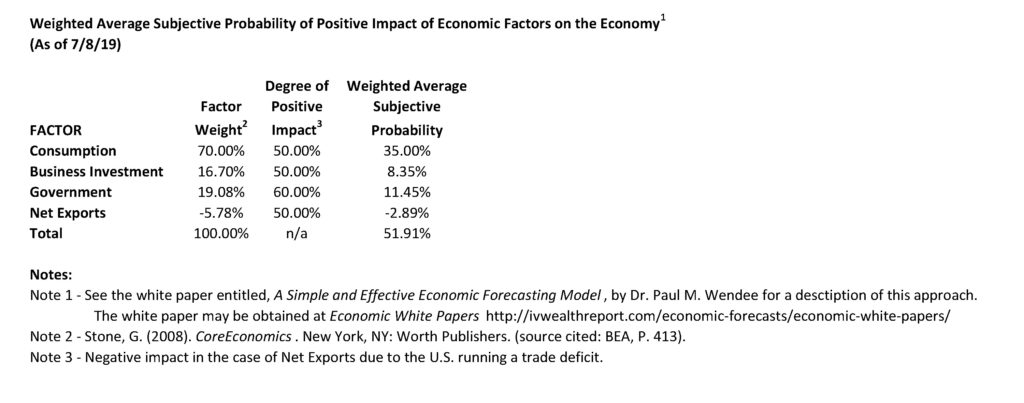
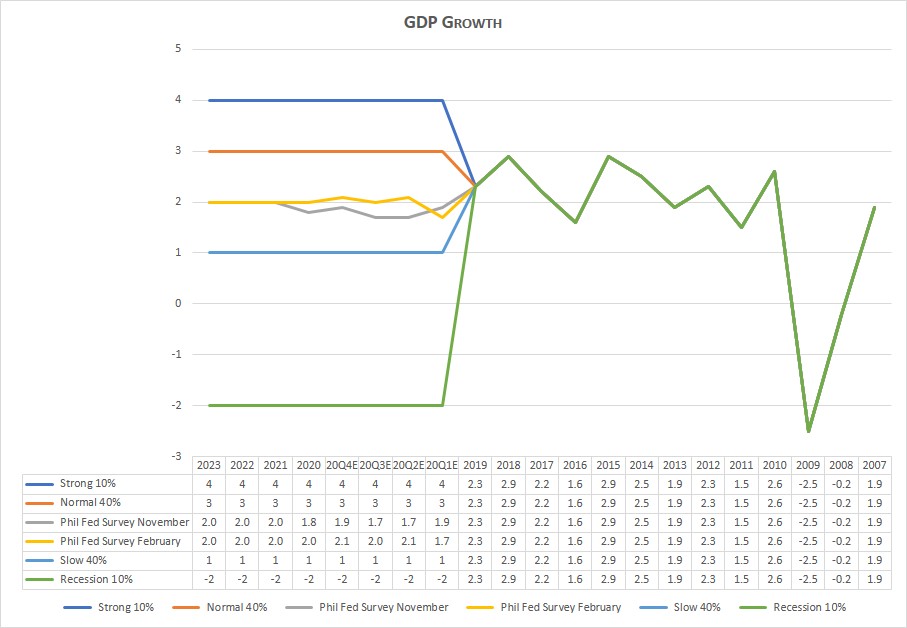
Note: The table and chart below have not been updated. However, we believe that a recession is quite likely. In the chart below, the bottom green line shows what a recession could look like.
Notes (GDP Growth Chart):

  1. See the July 8, 2019 Commentary for an introduction to this model.
  2. Actual numbers 2007 through 2019; forecasted numbers thereafter.
  3. Normal GDP growth is typically in the 2% to 3% range.
  4. A recession is generally defined as two consecutive quarters of negative economic growth as measured by a country’s gross domestic product (GDP).

Thought for the Week

“Never answer a margin call.” ~ Humphrey Neill

Announcements

The Intrinsic Value Wealth Report has started a new YouTube channel called Intrinsic Value Wealth Report TV. You can view the YouTube channel at Intrinsic Value Wealth Report TV.

The Intrinsic Value Wealth Report has started a new podcast called Intrinsic Value Wealth Report Radio. You can listen to the podcast at Intrinsic Value Wealth Report Radio.

Dr. Wendee spoke at the Investment Club of America’s annual economic summit, called Econosummit, on Sunday March 1, 2020 in Las Vegas.

Dr. Wendee attended the The National Due Diligence Alliance (TNDDA) investment banking conference, which was held March 6-8, 2020 at the Four Seasons Resort in Dallas, Texas. This is a conference held several times throughout the year for investment bankers and registered investment advisers to learn about new opportunities in the Alternative Investment asset classes.

TNDDA Meeting in Dallas, Texas

We have been researching the use of crowdsourcing for investment ideas. We will be sending a survey out in the next few weeks to get your input on the economy and the markets; and to get any investment ideas that you would like to share. We will compile this input and distribute the results to you and our other subscribers. We have been testing our crowdsourcing models with students and have been having good success and results.

Dr. Wendee has been researching and writing a new theory of economics known as, The Value Creation Theory of the Economy (also known as, Intrinsinomics). The full paper on Intrinsinomics will be published in the near future.

Finance 3350: Personal Finance-Portfolio & Risk Management– Dr. Wendee taught teaching Finance 3350 – Portfolio & Risk Management at California State University, Los Angeles (CSULA) for the Summer term starting May 2020. Dr. Wendee teaches courses in Management and Finance at CSULA.

Business 548: Strategy and Decision Making – Dr. Wendee taught Business 548 – Strategy and Decision Making at California Baptist University (CBU) starting at the end of June 2020. Dr. Wendee teaches courses in Finance, Business, Strategy & Decision Making, and Economics at CBU.

Business 303: Business Finance – Dr. Wendee will be teaching Business 303 – Business Finance at California Baptist University (CBU) starting at the end of August 2020. Dr. Wendee teaches courses in Finance, Business, Strategy & Decision Making, and Economics at CBU.

Dr. Wendee presented a paper on his new theory of economics known as, The Value Creation Theory of the Economy (also known as, Intrinsinomics), at the International Leadership Association’s annual global conference which was held in Ottawa, Canada last Fall.

Dr. Wendee will present an updated paper on his new theory of economics known as, The Value Creation Theory of the Economy (also known as, Intrinsinomics), at the International Leadership Association’s annual global conference which will be held in San Francisco, California in November.

Dr. Wendee will be delivering a talk entitled: Using Alternative Assets to Increase Portfolio Returns and Decrease Risk at the BrightTalk Q4 2020 Outlook Summit on October 28, 2020. You can access additional information on the summit and Dr. Wendee’s presentation here.

Dr. Wendee will be delivering a talk  at the BrightTalk conference on December 9, 2020 on understanding the themes that are driving the world. More details will be coming in the near future.

Dr. Wendee is working on a financial planning modeling program which will be available in the near future. The modeling program is designed to assist anyone in creating a financial plan and is customizable for each person’s unique financial planning goals. A working draft of the model is currently in beta test with students. Click this link, schematic, to go to the clickable document under the subheading Financial Planning Process (Draft) in the Intrinsic Value Wealth Report to see a draft of the schematic for the new financial planning process.

Dr. Wendee has been developing an econometric model specifically designed to monitor and forecast the global economy as this current economic crisis unfolds. This new econometric model is based on other econometric models that he has designed and have used for many years. You can find some of these earlier models in Book # 6 – Simple and Effective Economic Forecasting in the sister website to this website which is called the Intrinsic Value Wealth Report. The new econometric model has been constructed with some additional tools and methods that he has learned and some that he has developed over the last several years. He will be talking more about this new econometric model in this Commentary over the next few months. His comments and forecasts on the economy and the markets going forward will be based to a significant extent on this new model.

We have begun raising capital for our fund-of-funds investment, Northwest Quadrant Opportunity Fund, LLC. The fund engineers and constructs an investment vehicle consisting of Alternative Asset investments. The fund’s objective is to build a diversified portfolio of strong, solid, steady- performing assets, with highly qualified asset managers who have proven track records that meet our underwriting requirements. To learn more about the Northwest Quadrant Opportunity Fund, LLC and to obtain an offering memorandum, please click Northwest Quadrant Opportunity Fund, LLC.

Intrinsic Value Wealth Creation pyramid

We always conclude our commentary with a discussion of the Intrinsic Value Wealth Creation Pyramid. The Intrinsic Value Wealth Creation Pyramid is designed to show some of the major categories for building wealth. It is the result of many years of study of the wealth building process; experience working with clients who have built considerable wealth; and my own personal experience building wealth. Newsletter subscribers should consult the Intrinsic Value Wealth Creation Pyramid as one of many useful investment tools while considering their investment plans.

The chart in this section is an expanded version of the Intrinsic Value Wealth Creation Pyramid Chart referenced in the Forbes.com article entitled, Nine Of The Best Ways To Build Wealth.

RESOURCES

See our Resources section for links to economic and other resources used in the preparation of this Commentary.
Posted in Economic & Business Chart Room, Economic Outlook, Entrepreneurship, Focus List, Investment Recommendations, Investments, Notes From The Field, Special Situations, Uncategorized, VDI/REEP, Visionary Ideas | Tagged , , , , , , , , , , , , , , , , , , , , , , , , , , , , , , , , , | Comments Off on WEEKLY COMMENTARY October 6, 2020

WEEKLY COMMENTARY September 29, 2020

Do P/E Ratios Imply a 44% Drop in the Market?

Will price-to-earnings (P/E) ratios revert to the mean? They have been high for a very long time, indicating an overvalued stock market. I have been writing about this problem in this Commentary and talking about this problem in our weekly podcast, Intrinsic Value Wealth Report Radio. But despite their lofty levels, P/E ratios have remained stubbornly high.

What is going on? Could it be that today’s P/E ratios aren’t all that high? Has a new norm come into play? Let’s look at this a bit closer.

First, our estimate of the historical range for P/E ratios is in the 15 to 18 range. This is based on an extensive review of historical P/E ratios from a number of different sources. P/E ratios in recent months have been, for the most part, in the 20s and low 30s. While there is nothing magical about the 15 to 18 range, and reasonable valuations certainly could be a little outside that range – the valuations we have seen over the past months is clearly way outside of those bounds. The market has been overvalued, and very overvalued at times.

Using an analysis of market valuations suggested by Valuewalk (2015): “What type of returns would be realized assuming a return to the long-term average P/E for the [S&P 500] index, which is 16?” Here are what the numbers show in today’s market:

                                                9/25/20                        Long-Term Implied

            P/E Ratio                        28.35                                    16.00

            EPS (ttm)                     116.33                                  116.33

            S&P 500 Index           3,298.46                               1,861.28

The example above implies a drop of 44% in the index if the P/E ratio returns to its long-term average of 16. It is worth repeating what was said in the Valuewalk analysis (2015): “Unless P/E ratios go to and stay at levels never seen before in history, we are looking at much lower returns from large-cap stocks for a long time to come. It is time for all of us in the business to wake up and acknowledge this reality.”

An important thing to note is that the markets do revert to the mean. As Siegel (2014, p.6) states: “The stability of real returns [in the stock market] is striking; real stock returns in the nineteenth century do not differ appreciably from the real returns in the twentieth century. Note that stocks fluctuate both below and above the trendline but eventually return to the trend. Economists call this behavior mean reversion, a property that indicates that periods of above-average returns tend to be followed by periods of below-average returns and vice versa.”

I have been writing an article on reversion to the mean, which will be published soon. In the meantime, at a current P/E ratio of 28.35 as of last Friday, the stock market is very overvalued. I can’t tell you when it will revert to the mean. But I can tell you that at some point in time it will.

References

(2015). “[Archives] Regression to the mean and value investing.” from https://www.valuewalk.com/2015/02/archives-regression-to-the-mean-and-value-investing/.

Siegel, J. J. (2014). Stocks for the long run. New York, McGraw Hill.

Economic and Investment Highlights

Last Week

Meat prices are falling.

Global trade is rebounding more quickly this year than it did after the 2008 financial crisis.

Fed Chair Powell said Congress would need to provide more stimulus relief.

Home sales in August rose for a third consecutive month.

The U.S. surpassed 200,000 deaths from the pandemic. Some health officials are warning of another wave of infections. Total cases in the U.S. have reached 7 million.

The U.K. imposed new coronavirus restrictions.

The fabled and historic Palmer House Hilton in Chicago is facing bankruptcy in another sign of the hospitality industry’s troubles.

California Governor Newsom signed an order banning the sale of new gasoline and diesel passenger cars by 2035.

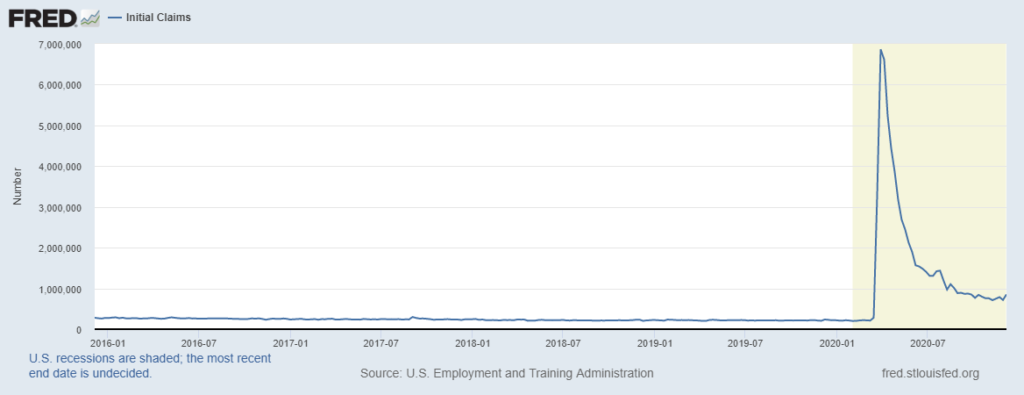
Initial jobless gains in September have held steady at just under 900,000 per week.

President Trump plans to nominate Judge Amy Barrett to fill the vacancy on the Supreme Court.

The Dow and the S&P 500 fell for the week while the Nasdaq rose. The Dow was down 1.75%; the S&P 500 was down 0.63%; and the Nasdaq was up 1.1%. The 10-year treasury yield ended the week at 0.659%. Gold closed at $1,857.70 for the week. Oil closed at $40.25 for the week.

The Week Ahead

This link takes you to Econoday’s Economic Calendar and Economic Events and Analysis which shows the upcoming economic reporting events scheduled in the week and months ahead.

Summary

Note: The models below may not capture the impact of COVID-19 beyond their impact on GDP source data and relevant economic reports that have already been released. They may not anticipate the impact of COVID-19 on forthcoming economic reports beyond the standard internal dynamics of the models.

Note: The comments that follow are derived from the economic indicators referenced in the Resources section of this newsletter and other sources in this report.

The Aruoba-Diebold-Scotti Business Conditions Index (ALS) had been trending up for several weeks from having dipped in 2019. Recently with the advent of the economic collapse, the index crashed. It has now been generally trending down again, but fluctuating within a narrow band. This is a slightly positive indicator for the economy on a short-term basis.

The GDPNow model estimate for real GDP growth (seasonally adjusted annual rate) in the third quarter of 2020 is 32.0 percent. This reading agrees with the ALS model assessment of an improving short-term economic environment.

The New York Fed Staff Nowcast stands at 14.3 percent for 2020:Q3 and 5.3 percent for 2020:Q4.

The Chicago Fed National Activity Index (CFNAI) showed an increase in economic activity in June. The Chicago Fed National Activity Index (CFNAI) was  was +0.79 in August, down from +2.54 in July.

All told, these short-term economic indicators are a mixed analysis for the economy, at least on a short-term basis.

Expectations that stock prices will rise over the next six months is now at 24.9% in a recent AAII Sentiment Survey. The historical average is 38.0% for the survey. 29.1% of the investors in the survey described their short-term outlook as neutral and 46.0% were bearish. Please see the AAII Sentiment Survey for the complete results.

The latest Gross Output (GO) reading (July 6, 2020) showed that Gross Output slowed significantly in the first quarter of 2020.

Advisor Perspectives publishes a monthly market valuation update. The following is the update for August (published September 10, 2020): August 2020: Market Valuation, Inflation and Treasury YieldsAdvisor Perspectives has other useful and interesting investment information at this website.

On a longer-term basis, the forecasters in the Philadelphia Fed’s Survey of Professional Forecasters (as of August 14, 2020) predict real GDP will increase at 19.1 percent for the third quarter of 2020, 5.8 percent in the fourth quarter of 2020, 5.2 percent in the first quarter of 2021, 3.8 percent in the second quarter of 2021, and 3.6 percent in the third quarter of 2021. On an annual-average over annual-average basis, the forecasters predict real GDP to contract -5.2 percent in 2020; and grow 3.2 percent in 2021, 3.5 percent in 2022 and 2.2 percent in 2023. The forecasters predict the unemployment rate will be 10.0 percent in Q3 and 9.5 percent in Q4; and will be 9.0 percent in 2020; 8.0 percent in 2021, 6.0 percent in 2022, and 5.3 percent in 2023. The next survey release date is November 16, 2020.

The National Association for Business Economics (NABE) released its Economic Policy Survey on August 24, 2020 which is summarized as follows: “Nearly two-thirds of the National Association for Business Economics members who participated in the August 2020 NABE Economic Policy Survey believe the U.S. economy continues to be in a recession that began last February,” said NABE President Constance Hunter, CBE, chief economist, KPMG. “Almost half the respondents expects inflation-adjusted gross domestic product to remain below its fourth-quarter 2019 level until the second half of 2022 or later. And 80% of panelists indicate there is at least a one-in-four chance of a ‘double-dip’ recession.

“The panel is split in its view on Congress’s fiscal response to the recession, with 40% calling the response insufficient, 37% indicating the response is adequate, and 11% saying it is excessive,” Hunter continued. “Nearly three out of four panelists believe the optimal size for the next fiscal package to be $1 trillion or greater, compared to 17% who favor a smaller package.”

“More than three-quarters of panelists believe that the current stance of U.S. monetary policy is appropriate, the largest share holding this view since 2007,” added Survey Chair Gregory Daco, chief U.S. economist, Oxford Economics. “The majority of panelists—58%—expects the federal funds rate range to remain unchanged at 0-0.25%, or even drop lower, by the end of 2021. Most participants—84%—expect that the funds rate target will be higher by year-end 2022, but still within 100 basis points of where it is currently.

“Panelists were asked to select the three most important policy issues that the next presidential administration should address during its first year in office,” Daco added. “Combating COVID-19, promoting economic recovery, and health policy were cited more frequently than a dozen other choices.”

For a more in-depth review and analysis of the economy, please see our mini-book on economic analysis and forecasting entitled: Simple and Effective Economic Forecasting.

Stock Market Valuations

Our estimates of the market valuations for two stock market indices, the Dow Jones Industrial Average (DJIA) and the Standard & Poor’s 500 (S&P 500), can be found in the file below:

Conclusion

During this time of global flux due to the coronavirus, I am leaving the Conclusion discussion below the same as was posted on March 23, 2020. The March 23, 2020 discussion still adequately reflects my thinking on the current state of affairs.

Important Note: While I don’t believe it is time to jump back into the stock market in a big way because of the market’s overvaluation, I have been advising the last few of weeks in this Commentary and in my weekly podcast, Intrinsic Value Wealth Report Radio, that investors can continue building their investment portfolios by selecting individual securities that offer growth and value opportunities.

Reprinted from March 23, 2020

Up until the past week, the economy had been in a stable but somewhat vulnerable state. Nonetheless, it had remained fairly strong. In fact, robust consumer spending and strong labor market conditions had given us confidence that the economy, which had been in its tenth year of expansion, could continue to grow. But we were cautious on this outlook. There were several reasons for our caution. U.S. business growth had been mixed. And global economic growth had been mixed as well. The new coronavirus was becoming a global economic threat, although it was still too early to tell how much of an effect it would ultimately have. Debt is at high levels for consumers, businesses, and government (at all levels of government). Finally, this is an election year that will likely have significant consequences either positively or negatively depending on the outcome of the elections. And of course, it is still too early to tell what the outcome of the elections will be.

In just a few days, the coronavirus’s effect on the economy and the markets went from a ripple to a tsunami. Businesses are shuttering, events are being cancelled or postponed, grocery store shelves are empty, and people are being asked or ordered to stay home. The markets are now deep in bear market territory. The effects on the economy, even given the short time that the economy has been retreating, may be with us for a long time. There is now a much greater risk of a recession, and there has even been some talk of a depression. The government, the Fed, Republicans, and Democrats, and pretty much the entire country, is trying to get the virus under control and is coming up with plans to mitigate the long-term economic effects caused by the virus. But the virus has impacted the economy – in a significant way – in just a short time. How long lasting the effects will be no one can tell right now. The economy has been largely shut down and remains so today. It takes time to restart the economy after a situation such as what is occurring at the present time.

Given these events and the rapidly deteriorating situation, as I said last week, I would caution not to panic. The economy and the markets will get better. The situation is bad – there is no doubt about that – but it will turn around. The real question is when will it turn around? No one knows that at the present time. But it will turn around.

For now, review your investment portfolios. It is highly likely that all or most of your stocks are down. You should not consider selling the bulk of your stocks – only consider selling companies that are not sound companies. But do recognize that as the economy deteriorates, even good companies will be affected.

For stock market value hunters, we believe it is still too early to jump back in. We will be closely monitoring the markets using the many tools and models that we have developed over the years to assess the economy and the markets. We will use our best judgement and thoughts to let you know when we believe things are turning around. The turnaround hasn’t happened yet.

We believe it is important to maintain a long-term view toward investing. But for now, just sit tight. Eventually, this means that you should continue building your investment portfolio using the Cassandra Stock Selection Model to select individual securities that offer growth and value opportunities.

Chart for Review and Thought

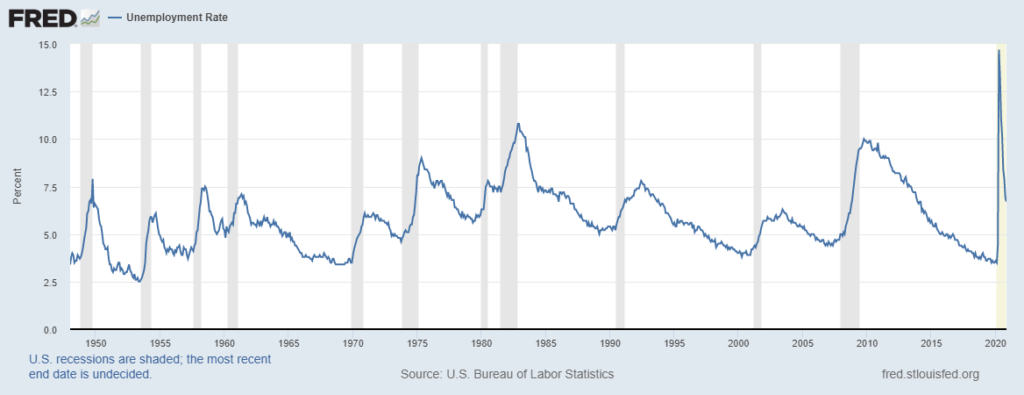
Unemployment Rate

Simple and Effective Economic Forecasting Model

Note: The table and chart below have not been updated. However, we believe that a recession is quite likely. In the chart below, the bottom green line shows what a recession could look like.

Notes (GDP Growth Chart):

  1. See the July 8, 2019 Commentary for an introduction to this model.
  2. Actual numbers 2007 through 2019; forecasted numbers thereafter.
  3. Normal GDP growth is typically in the 2% to 3% range.
  4. A recession is generally defined as two consecutive quarters of negative economic growth as measured by a country’s gross domestic product (GDP).

Thought for the Week

Reflecting on the high P/E ratios in today’s market, I am reminded of the adage: “If it seems to be good to be true, it probably is.” ~ Anonymous

Announcements

The Intrinsic Value Wealth Report has started a new YouTube channel called Intrinsic Value Wealth Report TV. You can view the YouTube channel at Intrinsic Value Wealth Report TV.

The Intrinsic Value Wealth Report has started a new podcast called Intrinsic Value Wealth Report Radio. You can listen to the podcast at Intrinsic Value Wealth Report Radio.

Dr. Wendee spoke at the Investment Club of America’s annual economic summit, called Econosummit, on Sunday March 1, 2020 in Las Vegas.

Dr. Wendee attended the The National Due Diligence Alliance (TNDDA) investment banking conference, which was held March 6-8, 2020 at the Four Seasons Resort in Dallas, Texas. This is a conference held several times throughout the year for investment bankers and registered investment advisers to learn about new opportunities in the Alternative Investment asset classes.

TNDDA Meeting in Dallas, Texas

We have been researching the use of crowdsourcing for investment ideas. We will be sending a survey out in the next few weeks to get your input on the economy and the markets; and to get any investment ideas that you would like to share. We will compile this input and distribute the results to you and our other subscribers. We have been testing our crowdsourcing models with students and have been having good success and results.

Dr. Wendee has been researching and writing a new theory of economics known as, The Value Creation Theory of the Economy (also known as, Intrinsinomics). The full paper on Intrinsinomics will be published in the near future.

Finance 3350: Personal Finance-Portfolio & Risk Management– Dr. Wendee taught teaching Finance 3350 – Portfolio & Risk Management at California State University, Los Angeles (CSULA) for the Summer term starting May 2020. Dr. Wendee teaches courses in Management and Finance at CSULA.

Business 548: Strategy and Decision Making – Dr. Wendee taught Business 548 – Strategy and Decision Making at California Baptist University (CBU) starting at the end of June 2020. Dr. Wendee teaches courses in Finance, Business, Strategy & Decision Making, and Economics at CBU.

Business 303: Business Finance – Dr. Wendee will be teaching Business 303 – Business Finance at California Baptist University (CBU) starting at the end of August 2020. Dr. Wendee teaches courses in Finance, Business, Strategy & Decision Making, and Economics at CBU.

Dr. Wendee presented a paper on his new theory of economics known as, The Value Creation Theory of the Economy (also known as, Intrinsinomics), at the International Leadership Association’s annual global conference which was held in Ottawa, Canada last Fall.

Dr. Wendee will present an updated paper on his new theory of economics known as, The Value Creation Theory of the Economy (also known as, Intrinsinomics), at the International Leadership Association’s annual global conference which will be held in San Francisco, California in November.

Dr. Wendee will be delivering a talk entitled: Using Alternative Assets to Increase Portfolio Returns and Decrease Risk at the BrightTalk Q4 2020 Outlook Summit on October 28, 2020. You can access additional information on the summit and Dr. Wendee’s presentation here.

Dr. Wendee will be delivering a talk  at the BrightTalk conference on December 9, 2020 on understanding the themes that are driving the world. More details will be coming in the near future.

Dr. Wendee is working on a financial planning modeling program which will be available in the near future. The modeling program is designed to assist anyone in creating a financial plan and is customizable for each person’s unique financial planning goals. A working draft of the model is currently in beta test with students. Click this link, schematic, to go to the clickable document under the subheading Financial Planning Process (Draft) in the Intrinsic Value Wealth Report to see a draft of the schematic for the new financial planning process.

Dr. Wendee has been developing an econometric model specifically designed to monitor and forecast the global economy as this current economic crisis unfolds. This new econometric model is based on other econometric models that he has designed and have used for many years. You can find some of these earlier models in Book # 6 – Simple and Effective Economic Forecasting in the sister website to this website which is called the Intrinsic Value Wealth Report. The new econometric model has been constructed with some additional tools and methods that he has learned and some that he has developed over the last several years. He will be talking more about this new econometric model in this Commentary over the next few months. His comments and forecasts on the economy and the markets going forward will be based to a significant extent on this new model.

We have begun raising capital for our fund-of-funds investment, Northwest Quadrant Opportunity Fund, LLC. The fund engineers and constructs an investment vehicle consisting of Alternative Asset investments. The fund’s objective is to build a diversified portfolio of strong, solid, steady- performing assets, with highly qualified asset managers who have proven track records that meet our underwriting requirements. To learn more about the Northwest Quadrant Opportunity Fund, LLC and to obtain an offering memorandum, please click Northwest Quadrant Opportunity Fund, LLC.

Intrinsic Value Wealth Creation pyramid

We always conclude our commentary with a discussion of the Intrinsic Value Wealth Creation Pyramid. The Intrinsic Value Wealth Creation Pyramid is designed to show some of the major categories for building wealth. It is the result of many years of study of the wealth building process; experience working with clients who have built considerable wealth; and my own personal experience building wealth. Newsletter subscribers should consult the Intrinsic Value Wealth Creation Pyramid as one of many useful investment tools while considering their investment plans.

The chart in this section is an expanded version of the Intrinsic Value Wealth Creation Pyramid Chart referenced in the Forbes.com article entitled, Nine Of The Best Ways To Build Wealth.

RESOURCES

See our Resources section for links to economic and other resources used in the preparation of this Commentary.
Posted in Economic & Business Chart Room, Economic Outlook, Entrepreneurship, Focus List, Investment Recommendations, Investments, Notes From The Field, Special Situations, Uncategorized, VDI/REEP, Visionary Ideas | Tagged , , , , , , , , , , , , , , , , , , , , , , , , , , , , , , , , , | Comments Off on WEEKLY COMMENTARY September 29, 2020

WEEKLY COMMENTARY September 22, 2020

U.S. Government is Crowding Out Private Investment

Will the U.S. government be the innovator of the future? Probably not. But the way it is borrowing money and crowding out private investment, one would think that the government believes it can be responsible for the innovation and investment required to foster economic growth well into the future. This, of course, cannot happen. And even the government doesn’t believe that can happen. So, what is really going on?

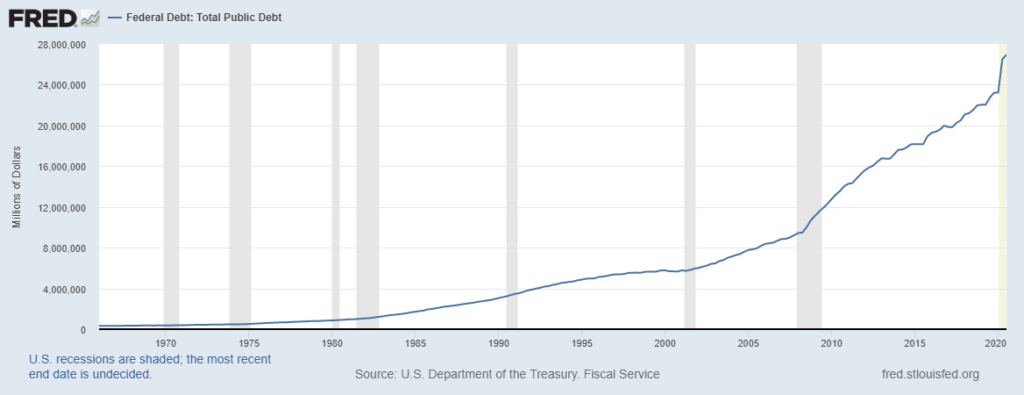
The government has been running a large budget deficit for a long time (see the chart below in Charts for Review and Comment). When the government runs a budget deficit and borrows money by issuing Treasury securities, it is “crowding out” private investment. That has been happening in a very big way for a long time. As we reported in the July 20, 2020 Commentary, the U.S. budget deficit was $3 trillion in the twelve months ended in June.  This puts the budget deficit on track to be the largest since World War II. Furthermore, U.S. debt climbed to its highest level compared to gross domestic product (GDP) since World War II and is projected to exceed GDP next year (see the chart below in Charts for Review and Comment).

When the government borrows to finance a budget deficit, the decline in private borrowing that results is known as “crowding out.” Normally this happens because interest rates rise due to the increase in government borrowing. In today’s environment, however, interest rates have been kept artificially low. But crowding out has occurred anyway because banks are largely investing in U.S. Treasuries instead of lending to businesses, as they are supposed to do. According to a report in the Wall Street Journal (2020): “Holdings at U.S commercial banks of Treasury and agency securities other than mortgage bonds have grown by more than $250 billion since the end of February…”

The problem with this situation is that the large increase in government borrowing to finance the budget deficit, the resulting increase in the national debt, and the reluctance of banks to loan to the private economy hurts future economic growth. As Mankiw (2018) notes “…government budget deficits reduce the economy’s growth rate.” No economic growth and no innovation mean no economic prosperity for our future and future generations. It’s that simple. And it’s that bad!

References

Goldfarb, S. and P. J. Davies (2020). Banks pile into Treasury bonds, helping to fund U.S. borrowing. The Wall Street Journal. New York, Dow Jones & Company. September 21, 2020.

Mankiw, N. G. (2018). Principles of Macroeconomics. Boston, Cengage.

Economic and Investment Highlights

Last Week

Investors are trading stock options and chasing fast-rising shares at record rates.

Israel will begin a second nationwide lockdown on Friday.

Amazon plans to hire an additional 100,000 employees in the U.S. and Canada.

China’s economic recovery accelerated in August. Retail sales returned to pre-covid levels.

Apple unveiled a new smartwatch.

A Middle East peace agreement was signed at the White House between Israel, Bahrain, and the U.A.E.

The Fed set a higher hurdle rate for rate increases. The Fed also signaled it plans to keep rates near zero for three more years.

Consumers in the U.S. increased retail spending in August for the fourth straight month, but at a slower pace.

Deutsche Bank told its U.S. employees that they don’t have to return to the office until July.

Many factory workers are staying home to care for children that aren’t at school or daycare.

Yoshihide Suga became Japan’s first new prime minister in eight years.

About one million mortgage borrowers fell through the virus safety net set up to protect borrowers from losing their homes.

The labor market continues to show slowing momentum in its recovery as reflected in unemployment claims.

Supreme Court Justice Ruth Bader Ginsburg died at the age of 87 from pancreatic cancer.

Many cinemas in the U.S. have reopened, but box office sales have been slow amid concerns about the pandemic.

The Dow, the S&P 500 and the Nasdaq fell for the week. The Dow was down 0.03%; the S&P 500 was down 0.64%; and the Nasdaq was down 0.6%. The 10-year treasury yield ended the week at 0.694%. Gold closed at $1,952.10 for the week. Oil closed at $41.11 for the week.

The Week Ahead

This link takes you to Econoday’s Economic Calendar and Economic Events and Analysis which shows the upcoming economic reporting events scheduled in the week and months ahead.

Summary

Note: The models below may not capture the impact of COVID-19 beyond their impact on GDP source data and relevant economic reports that have already been released. They may not anticipate the impact of COVID-19 on forthcoming economic reports beyond the standard internal dynamics of the models.

Note: The comments that follow are derived from the economic indicators referenced in the Resources section of this newsletter and other sources in this report.

The Aruoba-Diebold-Scotti Business Conditions Index (ALS) had been trending up for several weeks from having dipped in 2019. Recently with the advent of the economic collapse, the index crashed. It has now been generally trending down again, but fluctuating within a narrow band. This is a slightly positive indicator for the economy on a short-term basis.

The GDPNow model estimate for real GDP growth (seasonally adjusted annual rate) in the third quarter of 2020 is 32.0 percent. This reading agrees with the ALS model assessment of an improving short-term economic environment.

The New York Fed Staff Nowcast stands at 14.3 percent for 2020:Q3 and 5.3 percent for 2020:Q4.

The Chicago Fed National Activity Index (CFNAI) showed an increase in economic activity in June. The Chicago Fed National Activity Index (CFNAI) was  was +0.79 in August, down from +2.54 in July.

All told, these short-term economic indicators are a mixed analysis for the economy, at least on a short-term basis.

Expectations that stock prices will rise over the next six months is now at 24.9% in a recent AAII Sentiment Survey. The historical average is 38.0% for the survey. 29.1% of the investors in the survey described their short-term outlook as neutral and 46.0% were bearish. Please see the AAII Sentiment Survey for the complete results.

The latest Gross Output (GO) reading (July 6, 2020) showed that Gross Output slowed significantly in the first quarter of 2020.

Advisor Perspectives publishes a monthly market valuation update. The following is the update for August (published September 10, 2020): August 2020: Market Valuation, Inflation and Treasury YieldsAdvisor Perspectives has other useful and interesting investment information at this website.

On a longer-term basis, the forecasters in the Philadelphia Fed’s Survey of Professional Forecasters (as of August 14, 2020) predict real GDP will increase at 19.1 percent for the third quarter of 2020, 5.8 percent in the fourth quarter of 2020, 5.2 percent in the first quarter of 2021, 3.8 percent in the second quarter of 2021, and 3.6 percent in the third quarter of 2021. On an annual-average over annual-average basis, the forecasters predict real GDP to contract -5.2 percent in 2020; and grow 3.2 percent in 2021, 3.5 percent in 2022 and 2.2 percent in 2023. The forecasters predict the unemployment rate will be 10.0 percent in Q3 and 9.5 percent in Q4; and will be 9.0 percent in 2020; 8.0 percent in 2021, 6.0 percent in 2022, and 5.3 percent in 2023. The next survey release date is November 16, 2020.

The National Association for Business Economics (NABE) released its Economic Policy Survey on August 24, 2020 which is summarized as follows: “Nearly two-thirds of the National Association for Business Economics members who participated in the August 2020 NABE Economic Policy Survey believe the U.S. economy continues to be in a recession that began last February,” said NABE President Constance Hunter, CBE, chief economist, KPMG. “Almost half the respondents expects inflation-adjusted gross domestic product to remain below its fourth-quarter 2019 level until the second half of 2022 or later. And 80% of panelists indicate there is at least a one-in-four chance of a ‘double-dip’ recession.

“The panel is split in its view on Congress’s fiscal response to the recession, with 40% calling the response insufficient, 37% indicating the response is adequate, and 11% saying it is excessive,” Hunter continued. “Nearly three out of four panelists believe the optimal size for the next fiscal package to be $1 trillion or greater, compared to 17% who favor a smaller package.”

“More than three-quarters of panelists believe that the current stance of U.S. monetary policy is appropriate, the largest share holding this view since 2007,” added Survey Chair Gregory Daco, chief U.S. economist, Oxford Economics. “The majority of panelists—58%—expects the federal funds rate range to remain unchanged at 0-0.25%, or even drop lower, by the end of 2021. Most participants—84%—expect that the funds rate target will be higher by year-end 2022, but still within 100 basis points of where it is currently.

“Panelists were asked to select the three most important policy issues that the next presidential administration should address during its first year in office,” Daco added. “Combating COVID-19, promoting economic recovery, and health policy were cited more frequently than a dozen other choices.”

For a more in-depth review and analysis of the economy, please see our mini-book on economic analysis and forecasting entitled: Simple and Effective Economic Forecasting.

Stock Market Valuations

Our estimates of the market valuations for two stock market indices, the Dow Jones Industrial Average (DJIA) and the Standard & Poor’s 500 (S&P 500), can be found in the file below:

Conclusion

During this time of global flux due to the coronavirus, I am leaving the Conclusion discussion below the same as was posted on March 23, 2020. The March 23, 2020 discussion still adequately reflects my thinking on the current state of affairs.

Important Note: While I don’t believe it is time to jump back into the stock market in a big way because of the market’s overvaluation, I have been advising the last few of weeks in this Commentary and in my weekly podcast, Intrinsic Value Wealth Report Radio, that investors can continue building their investment portfolios by selecting individual securities that offer growth and value opportunities.

Reprinted from March 23, 2020

Up until the past week, the economy had been in a stable but somewhat vulnerable state. Nonetheless, it had remained fairly strong. In fact, robust consumer spending and strong labor market conditions had given us confidence that the economy, which had been in its tenth year of expansion, could continue to grow. But we were cautious on this outlook. There were several reasons for our caution. U.S. business growth had been mixed. And global economic growth had been mixed as well. The new coronavirus was becoming a global economic threat, although it was still too early to tell how much of an effect it would ultimately have. Debt is at high levels for consumers, businesses, and government (at all levels of government). Finally, this is an election year that will likely have significant consequences either positively or negatively depending on the outcome of the elections. And of course, it is still too early to tell what the outcome of the elections will be.

In just a few days, the coronavirus’s effect on the economy and the markets went from a ripple to a tsunami. Businesses are shuttering, events are being cancelled or postponed, grocery store shelves are empty, and people are being asked or ordered to stay home. The markets are now deep in bear market territory. The effects on the economy, even given the short time that the economy has been retreating, may be with us for a long time. There is now a much greater risk of a recession, and there has even been some talk of a depression. The government, the Fed, Republicans, and Democrats, and pretty much the entire country, is trying to get the virus under control and is coming up with plans to mitigate the long-term economic effects caused by the virus. But the virus has impacted the economy – in a significant way – in just a short time. How long lasting the effects will be no one can tell right now. The economy has been largely shut down and remains so today. It takes time to restart the economy after a situation such as what is occurring at the present time.

Given these events and the rapidly deteriorating situation, as I said last week, I would caution not to panic. The economy and the markets will get better. The situation is bad – there is no doubt about that – but it will turn around. The real question is when will it turn around? No one knows that at the present time. But it will turn around.

For now, review your investment portfolios. It is highly likely that all or most of your stocks are down. You should not consider selling the bulk of your stocks – only consider selling companies that are not sound companies. But do recognize that as the economy deteriorates, even good companies will be affected.

For stock market value hunters, we believe it is still too early to jump back in. We will be closely monitoring the markets using the many tools and models that we have developed over the years to assess the economy and the markets. We will use our best judgement and thoughts to let you know when we believe things are turning around. The turnaround hasn’t happened yet.

We believe it is important to maintain a long-term view toward investing. But for now, just sit tight. Eventually, this means that you should continue building your investment portfolio using the Cassandra Stock Selection Model to select individual securities that offer growth and value opportunities.

Chart for Review and Thought

Federal Surplus/Deficit
Federal Debt

Simple and Effective Economic Forecasting Model

Note: The table and chart below have not been updated. However, we believe that a recession is quite likely. In the chart below, the bottom green line shows what a recession could look like.

Notes (GDP Growth Chart):

  1. See the July 8, 2019 Commentary for an introduction to this model.
  2. Actual numbers 2007 through 2019; forecasted numbers thereafter.
  3. Normal GDP growth is typically in the 2% to 3% range.
  4. A recession is generally defined as two consecutive quarters of negative economic growth as measured by a country’s gross domestic product (GDP).

Thought for the Week

“He who lives by leverage, dies by leverage.” ~ Ken Fisher

Announcements

The Intrinsic Value Wealth Report has started a new YouTube channel called Intrinsic Value Wealth Report TV. You can view the YouTube channel at Intrinsic Value Wealth Report TV.

The Intrinsic Value Wealth Report has started a new podcast called Intrinsic Value Wealth Report Radio. You can listen to the podcast at Intrinsic Value Wealth Report Radio.

Dr. Wendee spoke at the Investment Club of America’s annual economic summit, called Econosummit, on Sunday March 1, 2020 in Las Vegas.

Dr. Wendee attended the The National Due Diligence Alliance (TNDDA) investment banking conference, which was held March 6-8, 2020 at the Four Seasons Resort in Dallas, Texas. This is a conference held several times throughout the year for investment bankers and registered investment advisers to learn about new opportunities in the Alternative Investment asset classes.

TNDDA Meeting in Dallas, Texas

We have been researching the use of crowdsourcing for investment ideas. We will be sending a survey out in the next few weeks to get your input on the economy and the markets; and to get any investment ideas that you would like to share. We will compile this input and distribute the results to you and our other subscribers. We have been testing our crowdsourcing models with students and have been having good success and results.

Dr. Wendee has been researching and writing a new theory of economics known as, The Value Creation Theory of the Economy (also known as, Intrinsinomics). The full paper on Intrinsinomics will be published in the near future.

Finance 3350: Personal Finance-Portfolio & Risk Management– Dr. Wendee taught teaching Finance 3350 – Portfolio & Risk Management at California State University, Los Angeles (CSULA) for the Summer term starting May 2020. Dr. Wendee teaches courses in Management and Finance at CSULA.

Business 548: Strategy and Decision Making – Dr. Wendee taught Business 548 – Strategy and Decision Making at California Baptist University (CBU) starting at the end of June 2020. Dr. Wendee teaches courses in Finance, Business, Strategy & Decision Making, and Economics at CBU.

Business 303: Business Finance – Dr. Wendee will be teaching Business 303 – Business Finance at California Baptist University (CBU) starting at the end of August 2020. Dr. Wendee teaches courses in Finance, Business, Strategy & Decision Making, and Economics at CBU.

Dr. Wendee presented a paper on his new theory of economics known as, The Value Creation Theory of the Economy (also known as, Intrinsinomics), at the International Leadership Association’s annual global conference which was held in Ottawa, Canada last Fall.

Dr. Wendee will present an updated paper on his new theory of economics known as, The Value Creation Theory of the Economy (also known as, Intrinsinomics), at the International Leadership Association’s annual global conference which will be held in San Francisco, California in November.

Dr. Wendee will be delivering a talk entitled: Using Alternative Assets to Increase Portfolio Returns and Decrease Risk at the BrightTalk Q4 2020 Outlook Summit on October 28, 2020. You can access additional information on the summit and Dr. Wendee’s presentation here.

Dr. Wendee will be delivering a talk  at the BrightTalk conference on December 9, 2020 on understanding the themes that are driving the world. More details will be coming in the near future.

Dr. Wendee is working on a financial planning modeling program which will be available in the near future. The modeling program is designed to assist anyone in creating a financial plan and is customizable for each person’s unique financial planning goals. A working draft of the model is currently in beta test with students. Click this link, schematic, to go to the clickable document under the subheading Financial Planning Process (Draft) in the Intrinsic Value Wealth Report to see a draft of the schematic for the new financial planning process.

Dr. Wendee has been developing an econometric model specifically designed to monitor and forecast the global economy as this current economic crisis unfolds. This new econometric model is based on other econometric models that he has designed and have used for many years. You can find some of these earlier models in Book # 6 – Simple and Effective Economic Forecasting in the sister website to this website which is called the Intrinsic Value Wealth Report. The new econometric model has been constructed with some additional tools and methods that he has learned and some that he has developed over the last several years. He will be talking more about this new econometric model in this Commentary over the next few months. His comments and forecasts on the economy and the markets going forward will be based to a significant extent on this new model.

We have begun raising capital for our fund-of-funds investment, Northwest Quadrant Opportunity Fund, LLC. The fund engineers and constructs an investment vehicle consisting of Alternative Asset investments. The fund’s objective is to build a diversified portfolio of strong, solid, steady- performing assets, with highly qualified asset managers who have proven track records that meet our underwriting requirements. To learn more about the Northwest Quadrant Opportunity Fund, LLC and to obtain an offering memorandum, please click Northwest Quadrant Opportunity Fund, LLC.

Intrinsic Value Wealth Creation pyramid

We always conclude our commentary with a discussion of the Intrinsic Value Wealth Creation Pyramid. The Intrinsic Value Wealth Creation Pyramid is designed to show some of the major categories for building wealth. It is the result of many years of study of the wealth building process; experience working with clients who have built considerable wealth; and my own personal experience building wealth. Newsletter subscribers should consult the Intrinsic Value Wealth Creation Pyramid as one of many useful investment tools while considering their investment plans.

The chart in this section is an expanded version of the Intrinsic Value Wealth Creation Pyramid Chart referenced in the Forbes.com article entitled, Nine Of The Best Ways To Build Wealth.

RESOURCES

See our Resources section for links to economic and other resources used in the preparation of this Commentary.
Posted in Economic & Business Chart Room, Economic Outlook, Entrepreneurship, Focus List, Investment Recommendations, Investments, Notes From The Field, Special Situations, Uncategorized, VDI/REEP, Visionary Ideas | Tagged , , , , , , , , , , , , , , , , , , , , , , , , , , , , , , , , , | Comments Off on WEEKLY COMMENTARY September 22, 2020

WEEKLY COMMENTARY September 15, 2020

If You Want to Understand the Financial Markets, Read the Bible

I’ve been studying the Bible to gain a better appreciation for its historical and literary significance. Besides being the word of God, it is a fascinating and insightful account of human nature and the history of humanity over thousands of years.

As I was studying the Bible the other night, it occurred to me that if one wants to understand the financial markets, one should read the Bible. How so, you might ask? It is because the Bible is an account of human history and human nature over thousands of years and because of that we can gain an appreciation for the human nature that characterizes and influences the financial markets. In other words, human beings are human beings and they haven’t really changed much in thousands of years. The Bible documents that reality quite well. By the way, to gain this understanding of the psychology and sociology of humanity, it doesn’t matter whether you study the Christian Bible or the Hebrew Bible (the Old Testament). Human nature didn’t change much, if at all, over the timeframe covered by both of those biblical accounts.

The Bible is, among other things, a study of human history, sociology, and psychology. It is insights from those fields that will make one a better investor. To be a good investor, one must understand human history, sociology, and psychology. One particularly important aspect of human behavior that an investor must understand is how people think – i.e., the System 1 and System 2 thinking that we have been discussing in a few of the recent Commentaries. Tetlock (2015) describes it this way: “System 2 is the familiar realm of conscious thought. It consists of everything we choose to focus on. By contrast, System 1 is largely a stranger to us. It is the realm of automatic perceptual and cognitive operations…System 1 comes first. It is fast and constantly running in the background. If a question is asked and you instantly know the answer, it sprang from System 1. System 2 is charged with interrogating that answer.”

In the July 13, 2020 Commentary, I described how System 1 and System 2 thinking applies to the market: “…the stock market is a reflection of the dichotomy of System 1 and System 2 thinking…The calculation of the [stock market’s] Intrinsic Value Line reflects System 2 thinking, whereas the daily market fluctuations around that line reflect System 1 thinking.

Geoghegan and Homan (2003) note: The Bible is “…a collection of works by a variety of authors… The Bible includes legal texts, history, poetry, philosophy, music, personal correspondence, and prophecies… Those who wrote the Bible were also a diverse bunch, and include shepherds, kings, farmers, priests, poets, scribes, prophets, and fishermen…” Because of this, the Bible has a wonderfully diverse but comprehensive perspective on humanity. Whether we are talking about Old Testament times, New Testament times, or the 21st Century, people haven’t really changed all that much, if at all, so we can gain wonderful insights about human nature from the Bible.

One could, and should, also study history and philosophy directly to learn about human nature. But the Bible would be a good place to start in any event. The important thing is for one to gain an understanding of history in general and human nature in particular, regardless of where they get that perspective, because as writer and philosopher George Santayana said: “Those who cannot remember the past are condemned to repeat it.” And repeating past mistakes in the financial markets can be devastating but is avoidable if one has a knowledge of the history of financial markets and human nature in general.

References

Geoghegan, J. and M. Homan (2003). The Bible for Dummies. New Jersey, John Wiley & Sons.

Tetlock, P. E. and D. Gardner (2015). Superforecasting: The art and science of prediction. New York, Crown Publishing.

Economic and Investment Highlights

Last Week

The Nasdaq fell into correction territory last week.

Tesla was passed over for inclusion in the S&P 500. Its shares fell 21%.

The mortgage market was strong in the Spring due to low mortgage rates.

Simon and Brookfield agreed to acquire J.C. Penney out of bankruptcy.

The number of jobs available in the U.S. leveled off in the late summer, a further indication that momentum in the labor market is easing. The number of people getting jobless benefits has remained at historically high levels.

The U.K. placed new restrictions on social gatherings, joining other European countries in imposing new restrictions to curb the pandemic.

Starwood lost seven malls after a bond default.

The Dow, the S&P 500 and the Nasdaq fell for the week. The Dow was down 1.7%; the S&P 500 was down 2.51%; and the Nasdaq was down 4.1%. The 10-year treasury yield ended the week at 0.668%. Gold closed at $1,937.80 for the week. Oil closed at $37.33 for the week.

The Week Ahead

This link takes you to Econoday’s Economic Calendar and Economic Events and Analysis which shows the upcoming economic reporting events scheduled in the week and months ahead.

Summary

Note: The models below may not capture the impact of COVID-19 beyond their impact on GDP source data and relevant economic reports that have already been released. They may not anticipate the impact of COVID-19 on forthcoming economic reports beyond the standard internal dynamics of the models.

Note: The comments that follow are derived from the economic indicators referenced in the Resources section of this newsletter and other sources in this report.

The Aruoba-Diebold-Scotti Business Conditions Index (ALS) had been trending up for several weeks from having dipped in 2019. Recently with the advent of the economic collapse, the index crashed. It has now been generally trending down again, but fluctuating within a narrow band. This is a slightly positive indicator for the economy on a short-term basis.

The GDPNow model estimate for real GDP growth (seasonally adjusted annual rate) in the third quarter of 2020 is 29.6 percent. This reading agrees with the ALS model assessment of an improving short-term economic environment.

The New York Fed Staff Nowcast stands at 15.68 percent for 2020:Q3 and 7.27 percent for 2020:Q4.

The Chicago Fed National Activity Index (CFNAI) showed an increase in economic activity in June. The Chicago Fed National Activity Index (CFNAI) was  +1.18 in July, down from +5.33 in June.

All told, these short-term economic indicators are a mixed analysis for the economy, at least on a short-term basis.

Expectations that stock prices will rise over the next six months is now at 23.7% in a recent AAII Sentiment Survey. The historical average is 38.0% for the survey. 27.8% of the investors in the survey described their short-term outlook as neutral and 48.5% were bearish. Please see the AAII Sentiment Survey for the complete results.

The latest Gross Output (GO) reading (July 6, 2020) showed that Gross Output slowed significantly in the first quarter of 2020.

Advisor Perspectives publishes a monthly market valuation update. The following is the update for August (published September 10, 2020): August 2020: Market Valuation, Inflation and Treasury Yields. Advisor Perspectives has other useful and interesting investment information at this website.

On a longer-term basis, the forecasters in the Philadelphia Fed’s Survey of Professional Forecasters (as of August 14, 2020) predict real GDP will increase at 19.1 percent for the third quarter of 2020, 5.8 percent in the fourth quarter of 2020, 5.2 percent in the first quarter of 2021, 3.8 percent in the second quarter of 2021, and 3.6 percent in the third quarter of 2021. On an annual-average over annual-average basis, the forecasters predict real GDP to contract -5.2 percent in 2020; and grow 3.2 percent in 2021, 3.5 percent in 2022 and 2.2 percent in 2023. The forecasters predict the unemployment rate will be 10.0 percent in Q3 and 9.5 percent in Q4; and will be 9.0 percent in 2020; 8.0 percent in 2021, 6.0 percent in 2022, and 5.3 percent in 2023. The next survey release date is November 16, 2020.

The National Association for Business Economics (NABE) released its Economic Policy Survey on August 24, 2020 which is summarized as follows: “Nearly two-thirds of the National Association for Business Economics members who participated in the August 2020 NABE Economic Policy Survey believe the U.S. economy continues to be in a recession that began last February,” said NABE President Constance Hunter, CBE, chief economist, KPMG. “Almost half the respondents expects inflation-adjusted gross domestic product to remain below its fourth-quarter 2019 level until the second half of 2022 or later. And 80% of panelists indicate there is at least a one-in-four chance of a ‘double-dip’ recession.

“The panel is split in its view on Congress’s fiscal response to the recession, with 40% calling the response insufficient, 37% indicating the response is adequate, and 11% saying it is excessive,” Hunter continued. “Nearly three out of four panelists believe the optimal size for the next fiscal package to be $1 trillion or greater, compared to 17% who favor a smaller package.”

“More than three-quarters of panelists believe that the current stance of U.S. monetary policy is appropriate, the largest share holding this view since 2007,” added Survey Chair Gregory Daco, chief U.S. economist, Oxford Economics. “The majority of panelists—58%—expects the federal funds rate range to remain unchanged at 0-0.25%, or even drop lower, by the end of 2021. Most participants—84%—expect that the funds rate target will be higher by year-end 2022, but still within 100 basis points of where it is currently.

“Panelists were asked to select the three most important policy issues that the next presidential administration should address during its first year in office,” Daco added. “Combating COVID-19, promoting economic recovery, and health policy were cited more frequently than a dozen other choices.”

For a more in-depth review and analysis of the economy, please see our mini-book on economic analysis and forecasting entitled: Simple and Effective Economic Forecasting.

Stock Market Valuations

Our estimates of the market valuations for two stock market indices, the Dow Jones Industrial Average (DJIA) and the Standard & Poor’s 500 (S&P 500), can be found in the file below:

Conclusion

During this time of global flux due to the coronavirus, I am leaving the Conclusion discussion below the same as was posted on March 23, 2020. The March 23, 2020 discussion still adequately reflects my thinking on the current state of affairs.

Important Note: While I don’t believe it is time to jump back into the stock market in a big way because of the market’s overvaluation, I have been advising the last few of weeks in this Commentary and in my weekly podcast, Intrinsic Value Wealth Report Radio, that investors can continue building their investment portfolios by selecting individual securities that offer growth and value opportunities.

Reprinted from March 23, 2020

Up until the past week, the economy had been in a stable but somewhat vulnerable state. Nonetheless, it had remained fairly strong. In fact, robust consumer spending and strong labor market conditions had given us confidence that the economy, which had been in its tenth year of expansion, could continue to grow. But we were cautious on this outlook. There were several reasons for our caution. U.S. business growth had been mixed. And global economic growth had been mixed as well. The new coronavirus was becoming a global economic threat, although it was still too early to tell how much of an effect it would ultimately have. Debt is at high levels for consumers, businesses, and government (at all levels of government). Finally, this is an election year that will likely have significant consequences either positively or negatively depending on the outcome of the elections. And of course, it is still too early to tell what the outcome of the elections will be.

In just a few days, the coronavirus’s effect on the economy and the markets went from a ripple to a tsunami. Businesses are shuttering, events are being cancelled or postponed, grocery store shelves are empty, and people are being asked or ordered to stay home. The markets are now deep in bear market territory. The effects on the economy, even given the short time that the economy has been retreating, may be with us for a long time. There is now a much greater risk of a recession, and there has even been some talk of a depression. The government, the Fed, Republicans, and Democrats, and pretty much the entire country, is trying to get the virus under control and is coming up with plans to mitigate the long-term economic effects caused by the virus. But the virus has impacted the economy – in a significant way – in just a short time. How long lasting the effects will be no one can tell right now. The economy has been largely shut down and remains so today. It takes time to restart the economy after a situation such as what is occurring at the present time.

Given these events and the rapidly deteriorating situation, as I said last week, I would caution not to panic. The economy and the markets will get better. The situation is bad – there is no doubt about that – but it will turn around. The real question is when will it turn around? No one knows that at the present time. But it will turn around.

For now, review your investment portfolios. It is highly likely that all or most of your stocks are down. You should not consider selling the bulk of your stocks – only consider selling companies that are not sound companies. But do recognize that as the economy deteriorates, even good companies will be affected.

For stock market value hunters, we believe it is still too early to jump back in. We will be closely monitoring the markets using the many tools and models that we have developed over the years to assess the economy and the markets. We will use our best judgement and thoughts to let you know when we believe things are turning around. The turnaround hasn’t happened yet.

We believe it is important to maintain a long-term view toward investing. But for now, just sit tight. Eventually, this means that you should continue building your investment portfolio using the Cassandra Stock Selection Model to select individual securities that offer growth and value opportunities.

Chart for Review and Thought

Teaching Remotely in a Covid-19 Environment

Simple and Effective Economic Forecasting Model

Note: The table and chart below have not been updated. However, we believe that a recession is quite likely. In the chart below, the bottom green line shows what a recession could look like.

Notes (GDP Growth Chart):

  1. See the July 8, 2019 Commentary for an introduction to this model.
  2. Actual numbers 2007 through 2019; forecasted numbers thereafter.
  3. Normal GDP growth is typically in the 2% to 3% range.
  4. A recession is generally defined as two consecutive quarters of negative economic growth as measured by a country’s gross domestic product (GDP).

Thought for the Week

“Do what you can, with what you have, where you are.” ~ Theodore Roosevelt

Announcements

The Intrinsic Value Wealth Report has started a new YouTube channel called Intrinsic Value Wealth Report TV. You can view the YouTube channel at Intrinsic Value Wealth Report TV.

The Intrinsic Value Wealth Report has started a new podcast called Intrinsic Value Wealth Report Radio. You can listen to the podcast at Intrinsic Value Wealth Report Radio.

Dr. Wendee spoke at the Investment Club of America’s annual economic summit, called Econosummit, on Sunday March 1, 2020 in Las Vegas.

Dr. Wendee attended the The National Due Diligence Alliance (TNDDA) investment banking conference, which was held March 6-8, 2020 at the Four Seasons Resort in Dallas, Texas. This is a conference held several times throughout the year for investment bankers and registered investment advisers to learn about new opportunities in the Alternative Investment asset classes.

TNDDA Meeting in Dallas, Texas

We have been researching the use of crowdsourcing for investment ideas. We will be sending a survey out in the next few weeks to get your input on the economy and the markets; and to get any investment ideas that you would like to share. We will compile this input and distribute the results to you and our other subscribers. We have been testing our crowdsourcing models with students and have been having good success and results.

Dr. Wendee has been researching and writing a new theory of economics known as, The Value Creation Theory of the Economy (also known as, Intrinsinomics). The full paper on Intrinsinomics will be published in the near future.

Finance 3350: Personal Finance-Portfolio & Risk Management– Dr. Wendee taught teaching Finance 3350 – Portfolio & Risk Management at California State University, Los Angeles (CSULA) for the Summer term starting May 2020. Dr. Wendee teaches courses in Management and Finance at CSULA.

Business 548: Strategy and Decision Making – Dr. Wendee taught Business 548 – Strategy and Decision Making at California Baptist University (CBU) starting at the end of June 2020. Dr. Wendee teaches courses in Finance, Business, Strategy & Decision Making, and Economics at CBU.

Business 303: Business Finance – Dr. Wendee will be teaching Business 303 – Business Finance at California Baptist University (CBU) starting at the end of August 2020. Dr. Wendee teaches courses in Finance, Business, Strategy & Decision Making, and Economics at CBU.

Dr. Wendee presented a paper on his new theory of economics known as, The Value Creation Theory of the Economy (also known as, Intrinsinomics), at the International Leadership Association’s annual global conference which was held in Ottawa, Canada last Fall.

Dr. Wendee will present an updated paper on his new theory of economics known as, The Value Creation Theory of the Economy (also known as, Intrinsinomics), at the International Leadership Association’s annual global conference which will be held in San Francisco, California in November.

Dr. Wendee will be delivering a talk entitled: Using Alternative Assets to Increase Portfolio Returns and Decrease Risk at the BrightTalk Q4 2020 Outlook Summit on October 28, 2020. You can access additional information on the summit and Dr. Wendee’s presentation here.

Dr. Wendee is working on a financial planning modeling program which will be available in the near future. The modeling program is designed to assist anyone in creating a financial plan and is customizable for each person’s unique financial planning goals. A working draft of the model is currently in beta test with students. Click this link, schematic, to go to the clickable document under the subheading Financial Planning Process (Draft) in the Intrinsic Value Wealth Report to see a draft of the schematic for the new financial planning process.

Dr. Wendee has been developing an econometric model specifically designed to monitor and forecast the global economy as this current economic crisis unfolds. This new econometric model is based on other econometric models that he has designed and have used for many years. You can find some of these earlier models in Book # 6 – Simple and Effective Economic Forecasting in the sister website to this website which is called the Intrinsic Value Wealth Report. The new econometric model has been constructed with some additional tools and methods that he has learned and some that he has developed over the last several years. He will be talking more about this new econometric model in this Commentary over the next few months. His comments and forecasts on the economy and the markets going forward will be based to a significant extent on this new model.

We have begun raising capital for our fund-of-funds investment, Northwest Quadrant Opportunity Fund, LLC. The fund engineers and constructs an investment vehicle consisting of Alternative Asset investments. The fund’s objective is to build a diversified portfolio of strong, solid, steady- performing assets, with highly qualified asset managers who have proven track records that meet our underwriting requirements. To learn more about the Northwest Quadrant Opportunity Fund, LLC and to obtain an offering memorandum, please click Northwest Quadrant Opportunity Fund, LLC.

Intrinsic Value Wealth Creation pyramid

We always conclude our commentary with a discussion of the Intrinsic Value Wealth Creation Pyramid. The Intrinsic Value Wealth Creation Pyramid is designed to show some of the major categories for building wealth. It is the result of many years of study of the wealth building process; experience working with clients who have built considerable wealth; and my own personal experience building wealth. Newsletter subscribers should consult the Intrinsic Value Wealth Creation Pyramid as one of many useful investment tools while considering their investment plans.

The chart in this section is an expanded version of the Intrinsic Value Wealth Creation Pyramid Chart referenced in the Forbes.com article entitled, Nine Of The Best Ways To Build Wealth.

RESOURCES

See our Resources section for links to economic and other resources used in the preparation of this Commentary.
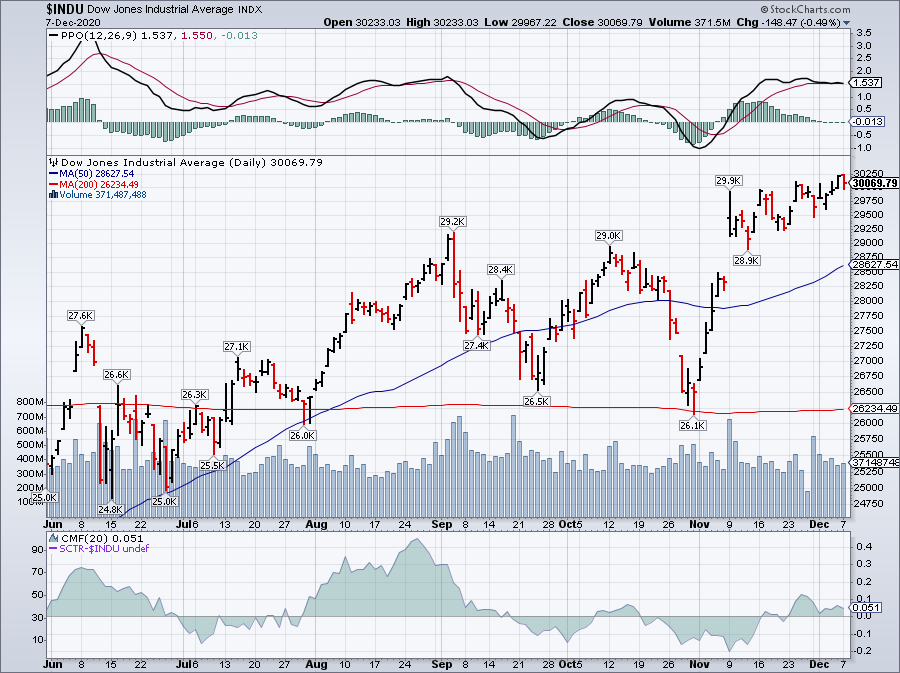
Posted in Economic & Business Chart Room, Economic Outlook, Entrepreneurship, Focus List, Investment Recommendations, Investments, Notes From The Field, Special Situations, Uncategorized, VDI/REEP, Visionary Ideas | Tagged , , , , , , , , , , , , , , , , , , , , , , , , , , , , , , , , , | Comments Off on WEEKLY COMMENTARY September 15, 2020

WEEKLY COMMENTARY September 8, 2020

What Does the Q Ratio Say About the Market’s Valuation?

In the last few issues of this Commentary, we have discussed various measures for valuing the stock market. As I have noted, some of the measures we have been using to value the market are identical to, or similar, to ratios and valuation metrics that we use to value individual securities. One of these ratios is the price-to-earnings ratio which we use on a regular basis and post weekly in the Stock Market Valuations section of this weekly Commentary. The price-to-earnings ratio we use to value the market is identical to the price-to-earnings ratio we use to value individual securities. Another ratio we use to value the market, which we discussed last week, is the Buffett Indicator . As noted in the article on the Buffett Indicator, it is very similar to a price-to-sales ratio used to value individual stocks.

This week we will discuss Tobin’s q ratio, which is similar to a price-to-book ratio used to value individual securities. Tobin’s q is the ratio between a physical asset’s market value and its replacement value. It was developed by economist Nicholas Kaldor in 1966, but later popularized by Nobel Laureate economist James Tobin. Tobin describes the composition and adaptation of the q ratio for the markets and the economy this way (Tobin & Brainard, 1976): “One, the numerator, is the market valuation: the going price in the market for exchanging existing assets. The other, the denominator, is the replacement or reproduction cost: the price in the market for newly produced commodities. We believe that this ratio has considerable macroeconomic significance and usefulness, as the nexus between financial markets and markets for goods and services” (pp. 1-2).

One popular use for the q ratio is to determine the valuation of the whole market in relation to aggregate corporate assets. The formula for this is: q = value of the stock market / corporate net worth. Tobin hypothesized that the combined market value of all the companies in the stock market should be approximately equal to their replacement costs. A ratio greater than one would indicate that the market is overvalued. A ratio less than one would imply that the market is undervalued.

The fair-market valuation of 1:1 does not always hold though. According to Hayes (2019), “…the average (arithmetic mean) Q Ratio is about 0.70. This number, however, fluctuates: The all-time Q Ratio high at the peak of the 2001 Tech Bubble was 1.61, which suggests that the market price was 136% above the historic average of replacement cost at the time. The all-time lows occurred in 1921, 1932 and 1982 when they stood around 0.30, which is approximately 55% below the replacement cost.” Mislinski (2020) has more updated statistics that support these general valuation conclusions.

What does Tobin’s Q tell us about the current market valuation? The graph under Charts for Review and Thought (below) is an example of Tobin’s q for all U.S. corporations. The line shows the ratio of the US stock market value to U.S. net assets at replacement cost since 1900. The current q ratio would plot well above the average on this chart. Advisor Perspectives shows current data on the market’s valuation using the q ratio. Advisor Perspectives’ Mislinski (2020) estimates that the latest datapoint for the q ratio is currently 151% above the mean. These indicators using the q ratio all point to substantial market overvaluation.

As we discussed last week in our discussion of the Buffett Indicator, do these measures of overvaluation mean that the market is poised for an imminent crash? While the sky-high valuations tell us that the market could, and probably should decline, based on our expectations of the future economic climate; markets can and do stay overvalued for very long periods of time. As discussed in a previous CommentaryIs the Stock Market A System 1 Thinker?, I noted that, “The calculation of the Intrinsic Value Line reflects System 2 thinking, whereas the daily market fluctuations around that line reflect System 1 thinking.” What this means is that the market currently is functioning in the System 1, highly emotional realm. How long it stays in that realm cannot be predicted with any degree of certainty. I can only tell you that the market is very overvalued based on our research into a number of stock market valuation indicators, including the Buffett Indicator. But as Jesse Livermore, who was a famous and successful stock market investor in the early part of the last century said: “The market does what it should do, but not always when.”

References

Hayes, A. (2019, June 24 2019). “What is Q Ratio – Tobin’s Q.” Retrieved September 8, 2020, from https://www.investopedia.com/terms/q/qratio.asp#:~:text=The%20Tobin’s%20Q%20ratio%20equals,market%20value%20equals%20replacement%20cost.&text=While%20Tobin%20is%20often%20attributed,economist%20Nicholas%20Kaldor%20in%201966.

Mislinski, J. (2020). “The Q Ratio and market valuation: August update.” Retrieved September 2 2020, from https://www.advisorperspectives.com/dshort/updates/2020/09/02/the-q-ratio-and-market-valuation-august-update.

Smithers, A. and S. Wright (2000). Valuing Wall Street: Protecting wealth in turbulent markets. New York, Mc-Graw Hill.

Tobin, J. and W. C. Brainard (1976). Asset markets and the cost of capital. Y. University. Yale University.

Reference

Buffett, W. and C. Loomis (2001). Warren Buffett on the stock market. Fortune. New York, Fortune Media Group Holdings. December 10, 2001

Economic and Investment Highlights

Last Week

Coronavirus cases surpassed 25 million globally.

Banks are bracing for a wave of defaults and expect a longer, deeper recession than they had expected in the Spring.

India’s GDP fell 23.9% last quarter.

Fuel consumption by U.S. drivers is slowing.

U.S. factory output grew in August, but employment was mixed. The unemployment rate fell to 8.4% in August from 10.2% in July. Unemployment was close to 15% in April and 3.5% in February.

U.S. debt climbed to its highest level compared to gross domestic product (GDP) since World War II and is projected to exceed GDP next year.

The Dow rose above 29000 for the first time since February.

United plans to cut 16,370 staff.

Australia fell into a recession for the first time in 29 years. Its GDP fell 7% in the second quarter.

Chicago Fed Chief Evans said the U.S. economy needs continued support from the government.

The Dow, the S&P 500 and the Nasdaq fell for the week. The Dow was down 1.8%; the S&P 500 was down 2.3%; and the Nasdaq was down 3.3%. The 10-year treasury yield ended the week at 0.720%. Gold closed at $1,923.90 for the week. Oil closed at $39.77 for the week.

The Week Ahead

This link takes you to Econoday’s Economic Calendar and Economic Events and Analysis which shows the upcoming economic reporting events scheduled in the week and months ahead.

Summary

Note: The models below may not capture the impact of COVID-19 beyond their impact on GDP source data and relevant economic reports that have already been released. They may not anticipate the impact of COVID-19 on forthcoming economic reports beyond the standard internal dynamics of the models.

Note: The comments that follow are derived from the economic indicators referenced in the Resources section of this newsletter and other sources in this report.

The Aruoba-Diebold-Scotti Business Conditions Index (ALS) had been trending up for several weeks from having dipped in 2019. Recently with the advent of the economic collapse, the index crashed. It has now been generally trending down again, but fluctuating within a narrow band. This is a slightly positive indicator for the economy on a short-term basis.

The GDPNow model estimate for real GDP growth (seasonally adjusted annual rate) in the third quarter of 2020 is 29.6 percent. This reading agrees with the ALS model assessment of an improving short-term economic environment.

The New York Fed Staff Nowcast stands at 15.68 percent for 2020:Q3 and 7.27 percent for 2020:Q4.

The Chicago Fed National Activity Index (CFNAI) showed an increase in economic activity in June. The Chicago Fed National Activity Index (CFNAI) was  +1.18 in July, down from +5.33 in June.

All told, these short-term economic indicators are a mixed analysis for the economy, at least on a short-term basis.

Expectations that stock prices will rise over the next six months is now at 23.7% in a recent AAII Sentiment Survey. The historical average is 38.0% for the survey. 27.8% of the investors in the survey described their short-term outlook as neutral and 48.5% were bearish. Please see the AAII Sentiment Survey for the complete results.

The latest Gross Output (GO) reading (July 6, 2020) showed that Gross Output slowed significantly in the first quarter of 2020.

On a longer-term basis, the forecasters in the Philadelphia Fed’s Survey of Professional Forecasters (as of August 14, 2020) predict real GDP will increase at 19.1 percent for the third quarter of 2020, 5.8 percent in the fourth quarter of 2020, 5.2 percent in the first quarter of 2021, 3.8 percent in the second quarter of 2021, and 3.6 percent in the third quarter of 2021. On an annual-average over annual-average basis, the forecasters predict real GDP to contract -5.2 percent in 2020; and grow 3.2 percent in 2021, 3.5 percent in 2022 and 2.2 percent in 2023. The forecasters predict the unemployment rate will be 10.0 percent in Q3 and 9.5 percent in Q4; and will be 9.0 percent in 2020; 8.0 percent in 2021, 6.0 percent in 2022, and 5.3 percent in 2023. The next survey release date is November 16, 2020.

The National Association for Business Economics (NABE) released an Outlook Flash Survey on April 10, 2020. The NABE panel expects GDP declines in Q1 2020 and Q2 2020, and upticks in Q3 2020 and Q4 2020. The panel believes the U.S. economy is already in a recession and predicts real GDP will grow at an annual rate of -2.4 percent for the first quarter of 2020, -26.5 percent for the second quarter of 2020, 2.0 percent in the third quarter of 2020, 5.8 percent in the fourth quarter of 2020, and 6.0 percent in the first quarter of 2021. The forecasters expect unemployment to average 3.8% in Q1 2020. The median unemployment rate projection for Q2 2020 is 12.0%. The unemployment rate is expected to fall back to 9.5% at the end of 2020, and to 6.0% at year-end 2021. The panel’s forecast for the PCE price index less food and energy calls for a slowdown in the annual rate of change from 1.7% in Q1 to 0.8% in Q2 2020. The panel expects the rate to increase gradually to 1.7% in the last half of 2021.

For a more in-depth review and analysis of the economy, please see our mini-book on economic analysis and forecasting entitled: Simple and Effective Economic Forecasting.

Stock Market Valuations

Our estimates of the market valuations for two stock market indices, the Dow Jones Industrial Average (DJIA) and the Standard & Poor’s 500 (S&P 500), can be found in the file below:

Conclusion

During this time of global flux due to the coronavirus, I am leaving the Conclusion discussion below the same as was posted on March 23, 2020. The March 23, 2020 discussion still adequately reflects my thinking on the current state of affairs.

Important Note: While I don’t believe it is time to jump back into the stock market in a big way because of the market’s overvaluation, I have been advising the last few of weeks in this Commentary and in my weekly podcast, Intrinsic Value Wealth Report Radio, that investors can continue building their investment portfolios by selecting individual securities that offer growth and value opportunities.

Reprinted from March 23, 2020

Up until the past week, the economy had been in a stable but somewhat vulnerable state. Nonetheless, it had remained fairly strong. In fact, robust consumer spending and strong labor market conditions had given us confidence that the economy, which had been in its tenth year of expansion, could continue to grow. But we were cautious on this outlook. There were several reasons for our caution. U.S. business growth had been mixed. And global economic growth had been mixed as well. The new coronavirus was becoming a global economic threat, although it was still too early to tell how much of an effect it would ultimately have. Debt is at high levels for consumers, businesses, and government (at all levels of government). Finally, this is an election year that will likely have significant consequences either positively or negatively depending on the outcome of the elections. And of course, it is still too early to tell what the outcome of the elections will be.

In just a few days, the coronavirus’s effect on the economy and the markets went from a ripple to a tsunami. Businesses are shuttering, events are being cancelled or postponed, grocery store shelves are empty, and people are being asked or ordered to stay home. The markets are now deep in bear market territory. The effects on the economy, even given the short time that the economy has been retreating, may be with us for a long time. There is now a much greater risk of a recession, and there has even been some talk of a depression. The government, the Fed, Republicans, and Democrats, and pretty much the entire country, is trying to get the virus under control and is coming up with plans to mitigate the long-term economic effects caused by the virus. But the virus has impacted the economy – in a significant way – in just a short time. How long lasting the effects will be no one can tell right now. The economy has been largely shut down and remains so today. It takes time to restart the economy after a situation such as what is occurring at the present time.

Given these events and the rapidly deteriorating situation, as I said last week, I would caution not to panic. The economy and the markets will get better. The situation is bad – there is no doubt about that – but it will turn around. The real question is when will it turn around? No one knows that at the present time. But it will turn around.

For now, review your investment portfolios. It is highly likely that all or most of your stocks are down. You should not consider selling the bulk of your stocks – only consider selling companies that are not sound companies. But do recognize that as the economy deteriorates, even good companies will be affected.

For stock market value hunters, we believe it is still too early to jump back in. We will be closely monitoring the markets using the many tools and models that we have developed over the years to assess the economy and the markets. We will use our best judgement and thoughts to let you know when we believe things are turning around. The turnaround hasn’t happened yet.

We believe it is important to maintain a long-term view toward investing. But for now, just sit tight. Eventually, this means that you should continue building your investment portfolio using the Cassandra Stock Selection Model to select individual securities that offer growth and value opportunities.

Chart for Review and Thought

Source of data: Valuing Wall Street (http://valuingwallstreet.com/index.shtml). The data from 1952 on comes from the “Flow of Funds Accounts of the United States Z1”, which is published quarterly by the Federal Reserve. Earlier data are available from a variety of sources from 1900 as compiled by Stephen Wright, University of London. Wikipedia https://en.wikipedia.org/w/index.php?title=Tobin%27s_q&oldid=972541110

Simple and Effective Economic Forecasting Model

Note: The table and chart below have not been updated. However, we believe that a recession is quite likely. In the chart below, the bottom green line shows what a recession could look like.

Notes (GDP Growth Chart):

  1. See the July 8, 2019 Commentary for an introduction to this model.
  2. Actual numbers 2007 through 2019; forecasted numbers thereafter.
  3. Normal GDP growth is typically in the 2% to 3% range.
  4. A recession is generally defined as two consecutive quarters of negative economic growth as measured by a country’s gross domestic product (GDP).

Thought for the Week

Yogi Berra once went to a restaurant and ordered a whole pizza. “How many slices should I cut,” asked the waitress, “four or eight?” “Better make it four,” said Yogi. “I’m not hungry enough to eat eight.”

Announcements

The Intrinsic Value Wealth Report has started a new YouTube channel called Intrinsic Value Wealth Report TV. You can view the YouTube channel at Intrinsic Value Wealth Report TV.

The Intrinsic Value Wealth Report has started a new podcast called Intrinsic Value Wealth Report Radio. You can listen to the podcast at Intrinsic Value Wealth Report Radio.

Dr. Wendee spoke at the Investment Club of America’s annual economic summit, called Econosummit, on Sunday March 1, 2020 in Las Vegas.

Dr. Wendee attended the The National Due Diligence Alliance (TNDDA) investment banking conference, which was held March 6-8, 2020 at the Four Seasons Resort in Dallas, Texas. This is a conference held several times throughout the year for investment bankers and registered investment advisers to learn about new opportunities in the Alternative Investment asset classes.

TNDDA Meeting in Dallas, Texas

We have been researching the use of crowdsourcing for investment ideas. We will be sending a survey out in the next few weeks to get your input on the economy and the markets; and to get any investment ideas that you would like to share. We will compile this input and distribute the results to you and our other subscribers. We have been testing our crowdsourcing models with students and have been having good success and results.

Dr. Wendee has been researching and writing a new theory of economics known as, The Value Creation Theory of the Economy (also known as, Intrinsinomics). The full paper on Intrinsinomics will be published in the near future.

Finance 3350: Personal Finance-Portfolio & Risk Management– Dr. Wendee started teaching Finance 3350 – Portfolio & Risk Management at California State University, Los Angeles (CSULA) for the Summer term starting May 2020. Dr. Wendee teaches courses in Management and Finance at CSULA.

Business 548: Strategy and Decision Making – Dr. Wendee will be teaching Business 548 – Strategy and Decision Making at California Baptist University (CBU) starting at the end of June 2020. Dr. Wendee teaches courses in Finance, Business, Strategy & Decision Making, and Economics at CBU.

Business 303: Business Finance – Dr. Wendee will be teaching Business 303 – Business Finance at California Baptist University (CBU) starting at the end of August 2020. Dr. Wendee teaches courses in Finance, Business, Strategy & Decision Making, and Economics at CBU.

Dr. Wendee presented a paper on his new theory of economics known as, The Value Creation Theory of the Economy (also known as, Intrinsinomics), at the International Leadership Association’s annual global conference which was held in Ottawa, Canada last Fall.

Dr. Wendee will present an updated paper on his new theory of economics known as, The Value Creation Theory of the Economy (also known as, Intrinsinomics), at the International Leadership Association’s annual global conference which will be held in San Francisco, California in November.

Dr. Wendee is working on a financial planning modeling program which will be available in the near future. The modeling program is designed to assist anyone in creating a financial plan and is customizable for each person’s unique financial planning goals. A working draft of the model is currently in beta test with students. Click this link, schematic, to go to the clickable document under the subheading Financial Planning Process (Draft) in the Intrinsic Value Wealth Report to see a draft of the schematic for the new financial planning process.

Dr. Wendee has been developing an econometric model specifically designed to monitor and forecast the global economy as this current economic crisis unfolds. This new econometric model is based on other econometric models that he has designed and have used for many years. You can find some of these earlier models in Book # 6 – Simple and Effective Economic Forecasting in the sister website to this website which is called the Intrinsic Value Wealth Report. The new econometric model has been constructed with some additional tools and methods that he has learned and some that he has developed over the last several years. He will be talking more about this new econometric model in this Commentary over the next few months. His comments and forecasts on the economy and the markets going forward will be based to a significant extent on this new model.

We have begun raising capital for our fund-of-funds investment, Northwest Quadrant Opportunity Fund, LLC. The fund engineers and constructs an investment vehicle consisting of Alternative Asset investments. The fund’s objective is to build a diversified portfolio of strong, solid, steady- performing assets, with highly qualified asset managers who have proven track records that meet our underwriting requirements. To learn more about the Northwest Quadrant Opportunity Fund, LLC and to obtain an offering memorandum, please click Northwest Quadrant Opportunity Fund, LLC.

Intrinsic Value Wealth Creation pyramid

We always conclude our commentary with a discussion of the Intrinsic Value Wealth Creation Pyramid. The Intrinsic Value Wealth Creation Pyramid is designed to show some of the major categories for building wealth. It is the result of many years of study of the wealth building process; experience working with clients who have built considerable wealth; and my own personal experience building wealth. Newsletter subscribers should consult the Intrinsic Value Wealth Creation Pyramid as one of many useful investment tools while considering their investment plans.

The chart in this section is an expanded version of the Intrinsic Value Wealth Creation Pyramid Chart referenced in the Forbes.com article entitled, Nine Of The Best Ways To Build Wealth.

RESOURCES

See our Resources section for links to economic and other resources used in the preparation of this Commentary.
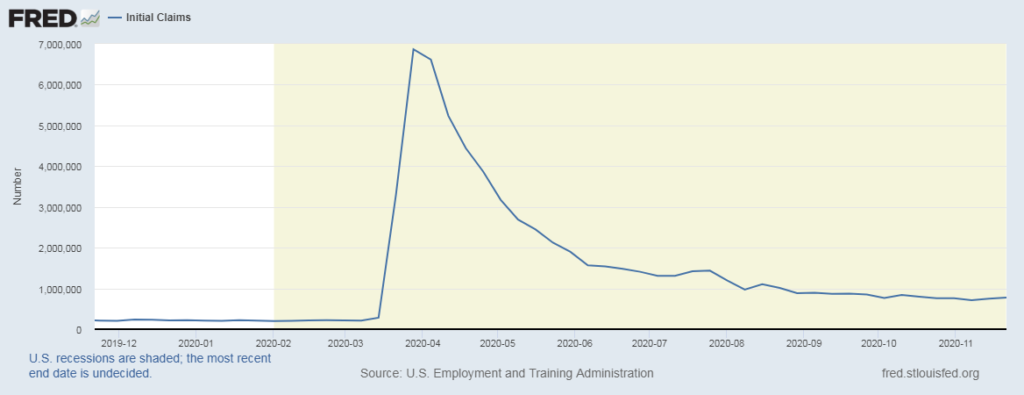
Posted in Economic & Business Chart Room, Economic Outlook, Entrepreneurship, Focus List, Investment Recommendations, Investments, Notes From The Field, Special Situations, Uncategorized, VDI/REEP, Visionary Ideas | Tagged , , , , , , , , , , , , , , , , , , , , , , , , , , , , , , , , , | Comments Off on WEEKLY COMMENTARY September 8, 2020

WEEKLY COMMENTARY September 1, 2020

What Does the Buffett Indicator Say About the Market’s Valuation?

An interesting indicator for valuing the stock market is the “Buffett Indicator”, named for Berkshire Hathaway Chairman, Warren Buffett. According to Buffett, the market is overvalued when the market cap of public companies is higher than gross domestic product (GDP). This indicator, which is formally known as the market capitalization-to-GDP ratio, can be thought of as being something like a price-to-sales ratio (the market cap is the price for the companies in the economy and GDP represents sales). Currently, the market cap of public companies is $35.7 trillion, and GDP is $19.4 trillion. That puts the market cap at 1.84 times GDP, which is an historically high multiple.

We have looked at research from a number of firms that track this indicator. These firms have shown their research on an historical basis (in many cases going back into the early part of the last century). Some of the firms have performed statistical analyses of various sorts (e.g., exponential smoothing, trend analysis, and standard deviation bands). The firms all agree that the market is currently extremely overvalued – many of the firms contending that it is the most overvalued it has ever been using this indicator. A couple of the firms have even shown, using this indicator, that many of the global markets are also overvalued.

The following is an excerpt from a 2001 interview with Warrant Buffett in Fortune Magazine (Buffett & Loomis, 2001) where he discusses the Buffett Indicator:

“The tour we’ve taken through the last century proves that market irrationality of an extreme kind periodically erupts–and compellingly suggests that investors wanting to do well had better learn how to deal with the next outbreak. What’s needed is an antidote, and in my opinion that’s quantification. If you quantify, you won’t necessarily rise to brilliance, but neither will you sink into craziness.

“On a macro basis, quantification doesn’t have to be complicated at all. Below is a chart [chart not included], starting almost 80 years ago and really quite fundamental in what it says. The chart shows the market value of all publicly traded securities as a percentage of the country’s business–that is, as a percentage of GNP. The ratio has certain limitations in telling you what you need to know. Still, it is probably the best single measure of where valuations stand at any given moment. And as you can see, nearly two years ago the ratio rose to an unprecedented level. That should have been a very strong warning signal.

“…If the percentage relationship falls to the 70% or 80% area, buying stocks is likely to work very well for you. If the ratio approaches 200%–as it did in 1999 and a part of 2000–you are playing with fire. As you can see, the ratio was recently 133%.”

As noted, today the indicator’s ratio is 184%. Does this mean that the market is poised for an imminent crash? While the sky-high valuation tells us that the market could, and probably should decline, based on our expectations of the future economic climate; markets can and do stay overvalued for very long periods of time. As discussed in a previous Commentary, Is the Stock Market A System 1 Thinker?, I noted that, “The calculation of the Intrinsic Value Line reflects System 2 thinking, whereas the daily market fluctuations around that line reflect System 1 thinking.” What this means is that the market currently is functioning in the System 1, highly emotional realm. How long it stays in that realm cannot be predicted with any degree of certainty. I can only tell you that the market is very overvalued based on our research into a number of stock market valuation indicators, including the Buffett Indicator. But as Jesse Livermore, who was a famous and successful stock market investor in the early part of the last century said: “The market does what it should do, but not always when.”

Reference

Buffett, W. and C. Loomis (2001). Warren Buffett on the stock market. Fortune. New York, Fortune Media Group Holdings. December 10, 2001

Economic and Investment Highlights

Last Week

Coronavirus cases are climbing in Europe with Spain in the lead.

China’s recovery from the coronavirus pandemic is gaining momentum.

Salesforce, Amgen, and Honeywell will join the Dow Jones Industrial Average index replacing Exxon Mobil, Pfizer, and Raytheon.

Researchers documented a case of reinfection from Covid-19.

American Airlines said it would cut 19,000 workers on October 1st.

The SEC released rules to allow more investors access to private markets and to allow firms to raise capital through direct listings.

The Fed approved a new policy on interest rates, dropping the practice of pre-emptively raising rates to head off inflation.

New jobless claims fell slightly last week but remain at historically high levels.

Consumers are starting to cut back on grocery spending, signaling a possible pullback in discretionary spending. U.S. consumer spending overall increased slightly in July, but at a slower pace than in prior months.

The Pentagon is cutting U.S. troops in Iraq to around 3,500, a one-third reduction.

A new wave of layoffs amid the coronavirus uncertainty is surging across the U.S.

The Dow, the S&P 500 and the Nasdaq rose for the week. The Dow was up 2.6%; the S&P 500 was up 3.26%; and the Nasdaq was up 3.4%. The 10-year treasury yield ended the week at 0.727%. Gold closed at $1,964.60 for the week. Oil closed at $42.97 for the week.

The Week Ahead

This link takes you to Econoday’s Economic Calendar and Economic Events and Analysis which shows the upcoming economic reporting events scheduled in the week and months ahead.

Summary

Note: The models below may not capture the impact of COVID-19 beyond their impact on GDP source data and relevant economic reports that have already been released. They may not anticipate the impact of COVID-19 on forthcoming economic reports beyond the standard internal dynamics of the models.

Note: The comments that follow are derived from the economic indicators referenced in the Resources section of this newsletter and other sources in this report.

The Aruoba-Diebold-Scotti Business Conditions Index (ALS) had been trending up for several weeks from having dipped in 2019. Recently with the advent of the economic collapse, the index crashed. It has now been generally trending up again, but fluctuating within a narrow band. This is a positive indicator for the economy on a short-term basis.

The GDPNow model estimate for real GDP growth (seasonally adjusted annual rate) in the third quarter of 2020 is 28.5 percent. This reading agrees with the ALS model assessment of an improving short-term economic environment.

The New York Fed Staff Nowcast stands at 15.27 percent for 2020:Q3.

The Chicago Fed National Activity Index (CFNAI) showed an increase in economic activity in June. The Chicago Fed National Activity Index (CFNAI) was  +1.18 in July, down from +5.33 in June.

All told, these short-term economic indicators are a mixed analysis for the economy, at least on a short-term basis.

Expectations that stock prices will rise over the next six months is now at 30.4% in a recent AAII Sentiment Survey. The historical average is 38.0% for the survey. 27.2% of the investors in the survey described their short-term outlook as neutral and 42.4% were bearish. Please see the AAII Sentiment Survey for the complete results.

The latest Gross Output (GO) reading (July 6, 2020) showed that Gross Output slowed significantly in the first quarter of 2020.

On a longer-term basis, the forecasters in the Philadelphia Fed’s Survey of Professional Forecasters (as of August 14, 2020) predict real GDP will increase at 19.1 percent for the third quarter of 2020, 5.8 percent in the fourth quarter of 2020, 5.2 percent in the first quarter of 2021, 3.8 percent in the second quarter of 2021, and 3.6 percent in the third quarter of 2021. On an annual-average over annual-average basis, the forecasters predict real GDP to contract -5.2 percent in 2020; and grow 3.2 percent in 2021, 3.5 percent in 2022 and 2.2 percent in 2023. The forecasters predict the unemployment rate will be 10.0 percent in Q3 and 9.5 percent in Q4; and will be 9.0 percent in 2020; 8.0 percent in 2021, 6.0 percent in 2022, and 5.3 percent in 2023. The next survey release date is November 16, 2020.

The National Association for Business Economics (NABE) released an Outlook Flash Survey on April 10, 2020. The NABE panel expects GDP declines in Q1 2020 and Q2 2020, and upticks in Q3 2020 and Q4 2020. The panel believes the U.S. economy is already in a recession and predicts real GDP will grow at an annual rate of -2.4 percent for the first quarter of 2020, -26.5 percent for the second quarter of 2020, 2.0 percent in the third quarter of 2020, 5.8 percent in the fourth quarter of 2020, and 6.0 percent in the first quarter of 2021. The forecasters expect unemployment to average 3.8% in Q1 2020. The median unemployment rate projection for Q2 2020 is 12.0%. The unemployment rate is expected to fall back to 9.5% at the end of 2020, and to 6.0% at year-end 2021. The panel’s forecast for the PCE price index less food and energy calls for a slowdown in the annual rate of change from 1.7% in Q1 to 0.8% in Q2 2020. The panel expects the rate to increase gradually to 1.7% in the last half of 2021.

For a more in-depth review and analysis of the economy, please see our mini-book on economic analysis and forecasting entitled: Simple and Effective Economic Forecasting.

Stock Market Valuations

Our estimates of the market valuations for two stock market indices, the Dow Jones Industrial Average (DJIA) and the Standard & Poor’s 500 (S&P 500), can be found in the file below:

Conclusion

During this time of global flux due to the coronavirus, I am leaving the Conclusion discussion below the same as was posted on March 23, 2020. The March 23, 2020 discussion still adequately reflects my thinking on the current state of affairs.

Important Note: While I don’t believe it is time to jump back into the stock market in a big way because of the market’s overvaluation, I have been advising the last few of weeks in this Commentary and in my weekly podcast, Intrinsic Value Wealth Report Radio, that investors can continue building their investment portfolios by selecting individual securities that offer growth and value opportunities.

Reprinted from March 23, 2020

Up until the past week, the economy had been in a stable but somewhat vulnerable state. Nonetheless, it had remained fairly strong. In fact, robust consumer spending and strong labor market conditions had given us confidence that the economy, which had been in its tenth year of expansion, could continue to grow. But we were cautious on this outlook. There were several reasons for our caution. U.S. business growth had been mixed. And global economic growth had been mixed as well. The new coronavirus was becoming a global economic threat, although it was still too early to tell how much of an effect it would ultimately have. Debt is at high levels for consumers, businesses, and government (at all levels of government). Finally, this is an election year that will likely have significant consequences either positively or negatively depending on the outcome of the elections. And of course, it is still too early to tell what the outcome of the elections will be.

In just a few days, the coronavirus’s effect on the economy and the markets went from a ripple to a tsunami. Businesses are shuttering, events are being cancelled or postponed, grocery store shelves are empty, and people are being asked or ordered to stay home. The markets are now deep in bear market territory. The effects on the economy, even given the short time that the economy has been retreating, may be with us for a long time. There is now a much greater risk of a recession, and there has even been some talk of a depression. The government, the Fed, Republicans, and Democrats, and pretty much the entire country, is trying to get the virus under control and is coming up with plans to mitigate the long-term economic effects caused by the virus. But the virus has impacted the economy – in a significant way – in just a short time. How long lasting the effects will be no one can tell right now. The economy has been largely shut down and remains so today. It takes time to restart the economy after a situation such as what is occurring at the present time.

Given these events and the rapidly deteriorating situation, as I said last week, I would caution not to panic. The economy and the markets will get better. The situation is bad – there is no doubt about that – but it will turn around. The real question is when will it turn around? No one knows that at the present time. But it will turn around.

For now, review your investment portfolios. It is highly likely that all or most of your stocks are down. You should not consider selling the bulk of your stocks – only consider selling companies that are not sound companies. But do recognize that as the economy deteriorates, even good companies will be affected.

For stock market value hunters, we believe it is still too early to jump back in. We will be closely monitoring the markets using the many tools and models that we have developed over the years to assess the economy and the markets. We will use our best judgement and thoughts to let you know when we believe things are turning around. The turnaround hasn’t happened yet.

We believe it is important to maintain a long-term view toward investing. But for now, just sit tight. Eventually, this means that you should continue building your investment portfolio using the Cassandra Stock Selection Model to select individual securities that offer growth and value opportunities.

Chart for Review and Thought

10 Year Treasury Constant Maturity Rate

Simple and Effective Economic Forecasting Model

Note: The table and chart below have not been updated. However, we believe that a recession is quite likely. In the chart below, the bottom green line shows what a recession could look like.

Notes (GDP Growth Chart):

  1. See the July 8, 2019 Commentary for an introduction to this model.
  2. Actual numbers 2007 through 2019; forecasted numbers thereafter.
  3. Normal GDP growth is typically in the 2% to 3% range.
  4. A recession is generally defined as two consecutive quarters of negative economic growth as measured by a country’s gross domestic product (GDP).

Thought for the Week

“Don’t Fight the Fed – Fear the Fed.” – Michael Sincere, Market Watch

Announcements

The Intrinsic Value Wealth Report has started a new YouTube channel called Intrinsic Value Wealth Report TV. You can view the YouTube channel at Intrinsic Value Wealth Report TV.

The Intrinsic Value Wealth Report has started a new podcast called Intrinsic Value Wealth Report Radio. You can listen to the podcast at Intrinsic Value Wealth Report Radio.

Dr. Wendee spoke at the Investment Club of America’s annual economic summit, called Econosummit, on Sunday March 1, 2020 in Las Vegas.

Dr. Wendee attended the The National Due Diligence Alliance (TNDDA) investment banking conference, which was held March 6-8, 2020 at the Four Seasons Resort in Dallas, Texas. This is a conference held several times throughout the year for investment bankers and registered investment advisers to learn about new opportunities in the Alternative Investment asset classes.

TNDDA Meeting in Dallas, Texas

We have been researching the use of crowdsourcing for investment ideas. We will be sending a survey out in the next few weeks to get your input on the economy and the markets; and to get any investment ideas that you would like to share. We will compile this input and distribute the results to you and our other subscribers. We have been testing our crowdsourcing models with students and have been having good success and results.

Dr. Wendee has been researching and writing a new theory of economics known as, The Value Creation Theory of the Economy (also known as, Intrinsinomics). The full paper on Intrinsinomics will be published in the near future.

Finance 3350: Personal Finance-Portfolio & Risk Management– Dr. Wendee started teaching Finance 3350 – Portfolio & Risk Management at California State University, Los Angeles (CSULA) for the Summer term starting May 2020. Dr. Wendee teaches courses in Management and Finance at CSULA.

Business 548: Strategy and Decision Making – Dr. Wendee will be teaching Business 548 – Strategy and Decision Making at California Baptist University (CBU) starting at the end of June 2020. Dr. Wendee teaches courses in Finance, Business, Strategy & Decision Making, and Economics at CBU.

Business 303: Business Finance – Dr. Wendee will be teaching Business 303 – Business Finance at California Baptist University (CBU) starting at the end of August 2020. Dr. Wendee teaches courses in Finance, Business, Strategy & Decision Making, and Economics at CBU.

Dr. Wendee presented a paper on his new theory of economics known as, The Value Creation Theory of the Economy (also known as, Intrinsinomics), at the International Leadership Association’s annual global conference which was held in Ottawa, Canada last Fall.

Dr. Wendee will present an updated paper on his new theory of economics known as, The Value Creation Theory of the Economy (also known as, Intrinsinomics), at the International Leadership Association’s annual global conference which will be held in San Francisco, California in November.

Dr. Wendee is working on a financial planning modeling program which will be available in the near future. The modeling program is designed to assist anyone in creating a financial plan and is customizable for each person’s unique financial planning goals. A working draft of the model is currently in beta test with students. Click this link, schematic, to go to the clickable document under the subheading Financial Planning Process (Draft) in the Intrinsic Value Wealth Report to see a draft of the schematic for the new financial planning process.

Dr. Wendee has been developing an econometric model specifically designed to monitor and forecast the global economy as this current economic crisis unfolds. This new econometric model is based on other econometric models that he has designed and have used for many years. You can find some of these earlier models in Book # 6 – Simple and Effective Economic Forecasting in the sister website to this website which is called the Intrinsic Value Wealth Report. The new econometric model has been constructed with some additional tools and methods that he has learned and some that he has developed over the last several years. He will be talking more about this new econometric model in this Commentary over the next few months. His comments and forecasts on the economy and the markets going forward will be based to a significant extent on this new model.

We have begun raising capital for our fund-of-funds investment, Northwest Quadrant Opportunity Fund, LLC. The fund engineers and constructs an investment vehicle consisting of Alternative Asset investments. The fund’s objective is to build a diversified portfolio of strong, solid, steady- performing assets, with highly qualified asset managers who have proven track records that meet our underwriting requirements. To learn more about the Northwest Quadrant Opportunity Fund, LLC and to obtain an offering memorandum, please click Northwest Quadrant Opportunity Fund, LLC.

Intrinsic Value Wealth Creation pyramid

We always conclude our commentary with a discussion of the Intrinsic Value Wealth Creation Pyramid. The Intrinsic Value Wealth Creation Pyramid is designed to show some of the major categories for building wealth. It is the result of many years of study of the wealth building process; experience working with clients who have built considerable wealth; and my own personal experience building wealth. Newsletter subscribers should consult the Intrinsic Value Wealth Creation Pyramid as one of many useful investment tools while considering their investment plans.

The chart in this section is an expanded version of the Intrinsic Value Wealth Creation Pyramid Chart referenced in the Forbes.com article entitled, Nine Of The Best Ways To Build Wealth.

RESOURCES

See our Resources section for links to economic and other resources used in the preparation of this Commentary.

Posted in Economic & Business Chart Room, Economic Outlook, Entrepreneurship, Focus List, Investment Recommendations, Investments, Notes From The Field, Special Situations, Uncategorized, VDI/REEP, Visionary Ideas | Tagged , , , , , , , , , , , , , , , , , , , , , , , , , , , , , , , , , | Comments Off on WEEKLY COMMENTARY September 1, 2020

WEEKLY COMMENTARY August 25, 2020

Is There A Perfect Storm Brewing?

I have been warning for quite some time that the stock market, as measured by the S&P 500 index, is very overvalued. The index has been hitting new highs in the past few weeks and is now up almost 50% from its low in March. We have noted that part of that overvaluation may be due to the heavy weighting of just five stocks that make up a significant portion of the index (estimated to be in the 20% to 28% weighting range). Those five stocks are Apple, Amazon, Microsoft, Alphabet, and Facebook. But now the entire index appears to be overvalued as indicated by several measures.

To begin with, the median stock in the S&P 500 is now in the 100th percentile (the highest level possible) of historical valuation as measured by the forward price-to-earnings ratio, according to Goldman Sachs (Vigna, 2020). The S&P 500 index itself is in the 98th percentile of historical valuation.

Other measures support this overvaluation thesis as well. The price-to-earnings ratio (P/E ratio) of the S&P 500 at the close of the market on Friday was 29.20. Based on our research, a normal range for P/E ratios is in the 15 to 18 range. The Shiller P/E, or CAPE ratio, rose to 30.63 on August 11th, one of the highest levels in the past century.

Another interesting indicator is the “Buffett Indicator”, named for Berkshire Hathaway Chairman, Warren Buffett. According to Buffett, the market is overvalued when the market cap of public companies is higher than Gross Domestic Product (GDP). This indicator can be thought of as being something like a price-to-sales ratio (the market cap is the price for the companies in the economy and GDP represents sales). I will write more about the Buffett Indicator in a future Commentary. Currently, the market cap of public companies is $35.7 trillion, and GDP is $19.4 trillion. That puts the market cap at 1.84 times greater than the GDP, which is an historically high multiple.

Contrast this market overvaluation with the condition of the economy and the state of the world. We still have an untamed coronavirus. Unemployment is the highest it has been in a decade. Second quarter GDP was a negative 32.9%, and there is much debate over how quickly the economy can recover. The government is taking on massive amounts of debt to fund its stimulus efforts. Businesses and consumers are heavily in debt, and along with the government, were heavily in debt before the crisis hit. Corporate earnings for the S&P 500 companies are down to a level of $116 from $132.39 a year ago. Furthermore, we have a very divisive and hostile political situation with elections just around the corner, a source of much uncertainty.

Could we be in a speculative bubble? Consider Tesla at a P/E multiple of over 1,000. Granted Tesla is an interesting company that will undoubtedly play a significant role in the world for years to come. But at a P/E multiple of over 1,000, it is priced for more than perfection. I have students and others asking me about Tesla on a regular basis. Just today I had two different people tell me about Tesla: one said that they wanted to buy Tesla and one said they held Tesla and did not want to sell and take a profit. Tesla is not the only company that people are blindly bidding up to price levels not seen since the last speculative bubble. And when the average, novice investor starts jumping into the market and speculating on stocks like Tesla, it has often been a good time to recognize that there is a bubble about to burst. So, is the perfect storm brewing? You decide.

Reference

Vigna, P. (2020). Value of median S&P stock hits new heights. The Wall Street Journal. New York, Dow Jones & Company. CCLXXVI: B1. August 24, 2020.

Economic and Investment Highlights

Last Week

U.S. coronavirus deaths passed the 170,000 mark. Coronavirus cases in Europe are again surging.

Boeing is planning more job cuts.

Big retail chains such as Walmart and Target have been posting strong sales gains.

Apple became the first U.S publicly traded company to reach a $2 trillion valuation.

Airbnb filed for an initial public offering (IPO).

Fed meeting minutes from July showed the Fed expected that the economy would need more stimulus.

Jobless claims rose last week.

American announced it will suspend flights to 15 cities.

Home sales surged in July.

The U.S. economy showed some signs of recovery according to surveys of purchasing managers, though other signs indicate that the economy is still in a vulnerable state.

The S&P 500 and the Nasdaq rose for the week while the Dow fell for the week. The Dow was down 0.69%; the S&P 500 was up 0.72%; and the Nasdaq was up 2.7%. The 10-year treasury yield ended the week at 0.639%. Gold closed at $1,934.60 for the week. Oil closed at $42.34 for the week.

The Week Ahead

This link takes you to Econoday’s Economic Calendar and Economic Events and Analysis which shows the upcoming economic reporting events scheduled in the week and months ahead.

Summary

Note: The models below may not capture the impact of COVID-19 beyond their impact on GDP source data and relevant economic reports that have already been released. They may not anticipate the impact of COVID-19 on forthcoming economic reports beyond the standard internal dynamics of the models.

Note: The comments that follow are derived from the economic indicators referenced in the Resources section of this newsletter and other sources in this report.

The Aruoba-Diebold-Scotti Business Conditions Index (ALS) had been trending up for several weeks from having dipped in 2019. Recently with the advent of the economic collapse, the index crashed. It has now been generally trending up again, but fluctuating within a narrow band. This is a positive indicator for the economy on a short-term basis.

The GDPNow model estimate for real GDP growth (seasonally adjusted annual rate) in the third quarter of 2020 is 25.6 percent. This reading agrees with the ALS model assessment of an improving short-term economic environment.

The New York Fed Staff Nowcast stands at 14.6 percent for 2020:Q3.

The Chicago Fed National Activity Index (CFNAI) showed an increase in economic activity in June. The Chicago Fed National Activity Index (CFNAI) was  +1.18 in July, down from +5.33 in June.

All told, these short-term economic indicators are a mixed analysis for the economy, at least on a short-term basis.

Expectations that stock prices will rise over the next six months is now at 30.4% in a recent AAII Sentiment Survey. The historical average is 38.0% for the survey. 27.2% of the investors in the survey described their short-term outlook as neutral and 42.4% were bearish. Please see the AAII Sentiment Survey for the complete results.

The latest Gross Output (GO) reading (July 6, 2020) showed that Gross Output slowed significantly in the first quarter of 2020.

On a longer-term basis, the forecasters in the Philadelphia Fed’s Survey of Professional Forecasters (as of August 14, 2020) predict real GDP will increase at 19.1 percent for the third quarter of 2020, 5.8 percent in the fourth quarter of 2020, 5.2 percent in the first quarter of 2021, 3.8 percent in the second quarter of 2021, and 3.6 percent in the third quarter of 2021. On an annual-average over annual-average basis, the forecasters predict real GDP to contract -5.2 percent in 2020; and grow 3.2 percent in 2021, 3.5 percent in 2022 and 2.2 percent in 2023. The forecasters predict the unemployment rate will be 10.0 percent in Q3 and 9.5 percent in Q4; and will be 9.0 percent in 2020; 8.0 percent in 2021, 6.0 percent in 2022, and 5.3 percent in 2023. The next survey release date is November 16, 2020.

The National Association for Business Economics (NABE) released an Outlook Flash Survey on April 10, 2020. The NABE panel expects GDP declines in Q1 2020 and Q2 2020, and upticks in Q3 2020 and Q4 2020. The panel believes the U.S. economy is already in a recession and predicts real GDP will grow at an annual rate of -2.4 percent for the first quarter of 2020, -26.5 percent for the second quarter of 2020, 2.0 percent in the third quarter of 2020, 5.8 percent in the fourth quarter of 2020, and 6.0 percent in the first quarter of 2021. The forecasters expect unemployment to average 3.8% in Q1 2020. The median unemployment rate projection for Q2 2020 is 12.0%. The unemployment rate is expected to fall back to 9.5% at the end of 2020, and to 6.0% at year-end 2021. The panel’s forecast for the PCE price index less food and energy calls for a slowdown in the annual rate of change from 1.7% in Q1 to 0.8% in Q2 2020. The panel expects the rate to increase gradually to 1.7% in the last half of 2021.

For a more in-depth review and analysis of the economy, please see our mini-book on economic analysis and forecasting entitled: Simple and Effective Economic Forecasting.

Stock Market Valuations

Our estimates of the market valuations for two stock market indices, the Dow Jones Industrial Average (DJIA) and the Standard & Poor’s 500 (S&P 500), can be found in the file below:

Conclusion

During this time of global flux due to the coronavirus, I am leaving the Conclusion discussion below the same as was posted on March 23, 2020. The March 23, 2020 discussion still adequately reflects my thinking on the current state of affairs.

Important Note: While I don’t believe it is time to jump back into the stock market in a big way because of the market’s overvaluation, I have been advising the last few of weeks in this Commentary and in my weekly podcast, Intrinsic Value Wealth Report Radio, that investors can continue building their investment portfolios by selecting individual securities that offer growth and value opportunities.

Reprinted from March 23, 2020

Up until the past week, the economy had been in a stable but somewhat vulnerable state. Nonetheless, it had remained fairly strong. In fact, robust consumer spending and strong labor market conditions had given us confidence that the economy, which had been in its tenth year of expansion, could continue to grow. But we were cautious on this outlook. There were several reasons for our caution. U.S. business growth had been mixed. And global economic growth had been mixed as well. The new coronavirus was becoming a global economic threat, although it was still too early to tell how much of an effect it would ultimately have. Debt is at high levels for consumers, businesses, and government (at all levels of government). Finally, this is an election year that will likely have significant consequences either positively or negatively depending on the outcome of the elections. And of course, it is still too early to tell what the outcome of the elections will be.

In just a few days, the coronavirus’s effect on the economy and the markets went from a ripple to a tsunami. Businesses are shuttering, events are being cancelled or postponed, grocery store shelves are empty, and people are being asked or ordered to stay home. The markets are now deep in bear market territory. The effects on the economy, even given the short time that the economy has been retreating, may be with us for a long time. There is now a much greater risk of a recession, and there has even been some talk of a depression. The government, the Fed, Republicans, and Democrats, and pretty much the entire country, is trying to get the virus under control and is coming up with plans to mitigate the long-term economic effects caused by the virus. But the virus has impacted the economy – in a significant way – in just a short time. How long lasting the effects will be no one can tell right now. The economy has been largely shut down and remains so today. It takes time to restart the economy after a situation such as what is occurring at the present time.

Given these events and the rapidly deteriorating situation, as I said last week, I would caution not to panic. The economy and the markets will get better. The situation is bad – there is no doubt about that – but it will turn around. The real question is when will it turn around? No one knows that at the present time. But it will turn around.

For now, review your investment portfolios. It is highly likely that all or most of your stocks are down. You should not consider selling the bulk of your stocks – only consider selling companies that are not sound companies. But do recognize that as the economy deteriorates, even good companies will be affected.

For stock market value hunters, we believe it is still too early to jump back in. We will be closely monitoring the markets using the many tools and models that we have developed over the years to assess the economy and the markets. We will use our best judgement and thoughts to let you know when we believe things are turning around. The turnaround hasn’t happened yet.

We believe it is important to maintain a long-term view toward investing. But for now, just sit tight. Eventually, this means that you should continue building your investment portfolio using the Cassandra Stock Selection Model to select individual securities that offer growth and value opportunities.

Chart for Review and Thought

Apple, Inc.

Simple and Effective Economic Forecasting Model

Note: The table and chart below have not been updated. However, we believe that a recession is quite likely. In the chart below, the bottom green line shows what a recession could look like.

Notes (GDP Growth Chart):

  1. See the July 8, 2019 Commentary for an introduction to this model.
  2. Actual numbers 2007 through 2019; forecasted numbers thereafter.
  3. Normal GDP growth is typically in the 2% to 3% range.
  4. A recession is generally defined as two consecutive quarters of negative economic growth as measured by a country’s gross domestic product (GDP).

Thought for the Week

“The market does what it should do, but not always when.” – Jesse Livermore

Announcements

The Intrinsic Value Wealth Report has started a new YouTube channel called Intrinsic Value Wealth Report TV. You can view the YouTube channel at Intrinsic Value Wealth Report TV.

The Intrinsic Value Wealth Report has started a new podcast called Intrinsic Value Wealth Report Radio. You can listen to the podcast at Intrinsic Value Wealth Report Radio.

Dr. Wendee spoke at the Investment Club of America’s annual economic summit, called Econosummit, on Sunday March 1, 2020 in Las Vegas.

Dr. Wendee attended the The National Due Diligence Alliance (TNDDA) investment banking conference, which was held March 6-8, 2020 at the Four Seasons Resort in Dallas, Texas. This is a conference held several times throughout the year for investment bankers and registered investment advisers to learn about new opportunities in the Alternative Investment asset classes.

TNDDA Meeting in Dallas, Texas

We have been researching the use of crowdsourcing for investment ideas. We will be sending a survey out in the next few weeks to get your input on the economy and the markets; and to get any investment ideas that you would like to share. We will compile this input and distribute the results to you and our other subscribers. We have been testing our crowdsourcing models with students and have been having good success and results.

Dr. Wendee has been researching and writing a new theory of economics known as, The Value Creation Theory of the Economy (also known as, Intrinsinomics). The full paper on Intrinsinomics will be published in the near future.

Finance 3350: Personal Finance-Portfolio & Risk Management– Dr. Wendee started teaching Finance 3350 – Portfolio & Risk Management at California State University, Los Angeles (CSULA) for the Summer term starting May 2020. Dr. Wendee teaches courses in Management and Finance at CSULA.

Business 548: Strategy and Decision Making – Dr. Wendee will be teaching Business 548 – Strategy and Decision Making at California Baptist University (CBU) starting at the end of June 2020. Dr. Wendee teaches courses in Finance, Business, Strategy & Decision Making, and Economics at CBU.

Business 303: Business Finance – Dr. Wendee will be teaching Business 303 – Business Finance at California Baptist University (CBU) starting at the end of August 2020. Dr. Wendee teaches courses in Finance, Business, Strategy & Decision Making, and Economics at CBU.

Dr. Wendee presented a paper on his new theory of economics known as, The Value Creation Theory of the Economy (also known as, Intrinsinomics), at the International Leadership Association’s annual global conference which was held in Ottawa, Canada last Fall.

Dr. Wendee will present an updated paper on his new theory of economics known as, The Value Creation Theory of the Economy (also known as, Intrinsinomics), at the International Leadership Association’s annual global conference which will be held in San Francisco, California in November.

Dr. Wendee is working on a financial planning modeling program which will be available in the near future. The modeling program is designed to assist anyone in creating a financial plan and is customizable for each person’s unique financial planning goals. A working draft of the model is currently in beta test with students. Click this link, schematic, to go to the clickable document under the subheading Financial Planning Process (Draft) in the Intrinsic Value Wealth Report to see a draft of the schematic for the new financial planning process.

Dr. Wendee has been developing an econometric model specifically designed to monitor and forecast the global economy as this current economic crisis unfolds. This new econometric model is based on other econometric models that he has designed and have used for many years. You can find some of these earlier models in Book # 6 – Simple and Effective Economic Forecasting in the sister website to this website which is called the Intrinsic Value Wealth Report. The new econometric model has been constructed with some additional tools and methods that he has learned and some that he has developed over the last several years. He will be talking more about this new econometric model in this Commentary over the next few months. His comments and forecasts on the economy and the markets going forward will be based to a significant extent on this new model.

We have begun raising capital for our fund-of-funds investment, Northwest Quadrant Opportunity Fund, LLC. The fund engineers and constructs an investment vehicle consisting of Alternative Asset investments. The fund’s objective is to build a diversified portfolio of strong, solid, steady- performing assets, with highly qualified asset managers who have proven track records that meet our underwriting requirements. To learn more about the Northwest Quadrant Opportunity Fund, LLC and to obtain an offering memorandum, please click Northwest Quadrant Opportunity Fund, LLC.

Intrinsic Value Wealth Creation pyramid

We always conclude our commentary with a discussion of the Intrinsic Value Wealth Creation Pyramid. The Intrinsic Value Wealth Creation Pyramid is designed to show some of the major categories for building wealth. It is the result of many years of study of the wealth building process; experience working with clients who have built considerable wealth; and my own personal experience building wealth. Newsletter subscribers should consult the Intrinsic Value Wealth Creation Pyramid as one of many useful investment tools while considering their investment plans.

The chart in this section is an expanded version of the Intrinsic Value Wealth Creation Pyramid Chart referenced in the Forbes.com article entitled, Nine Of The Best Ways To Build Wealth.

RESOURCES

See our Resources section for links to economic and other resources used in the preparation of this Commentary.

Posted in Economic & Business Chart Room, Economic Outlook, Entrepreneurship, Focus List, Investment Recommendations, Investments, Notes From The Field, Special Situations, Uncategorized, VDI/REEP, Visionary Ideas | Tagged , , , , , , , , , , , , , , , , , , , , , , , , , , , , , , , , , | Comments Off on WEEKLY COMMENTARY August 25, 2020

WEEKLY COMMENTARY August 18, 2020

The Three Rights That Lead To Exceptional Investment Returns

Part of Warren Buffett’s genius is in his ability to see things in basic, fundamental, and commonsense ways. He is a master at taking complicated ideas and putting them into very simple terms. There is no better example of this than his notion of what I call The Three Rights.

What are The Three Rights? One of my favorite videos to show to students is a video of Warren Buffett giving a talk to an MBA class at the University of North Carolina (Buffett, 1996). In this video, he lays out and explains The Three Rights which are: (1) the Right Business; (2) with the Right People; (3) at the Right Price. This is his very simple formula for investment success.

The Right Business means investing in good, sound businesses. There are many components to what makes a good sound business, but a few of the important components are businesses that have a competitive advantage; that have wide economic moats around them; and that have what Buffett calls franchise value. Franchise value is having a brand or an image, or some other characteristic, which makes people want your product or service over someone else’s.

Having the Right People means having a good management team. A good management team is competent and has demonstrated success. But most importantly to Buffett, they are honest people. They are people that Buffett can trust and with whom he enjoys working.

The Right Price means not paying too much for a good company. Understanding what the Right Price to pay for a company is takes a little understanding of finance. But anyone can grasp this concept with a little study. To learn about the concept of the Right Price see (Buffett & Clark, 1997; Buffett, 1996; Damodaran, 2011; Hagstrom, 1994). The basic and key idea here is that no matter how good the company is, you never want to overpay for it. There are many good companies to choose from. And at any given time, many good companies will be priced fairly or at better prices. The careful investor will take his or her time to study and find these good companies that are priced well. Companies that are overpriced at one moment in time often become fair or underpriced at a later time. In fact, that is why you don’t want to overpay for companies because all-to-often they will decline in price – often times precipitously.  If investors have patience and stick with the discipline of only paying fair or better prices for companies, they will do better in the long run than investors that overpay for companies. That is what Warren Buffett has done and that is what has made him the exceptional investor that he is.

I have probably seen this video of Buffett delivering his talk to the MBA students at the University of North Carolina 25 or 30 times over the years because I show it to many of my classes. As I was watching the video the other night, I was reflecting on just how down-to-earth and commonsense Buffett’s approach is. If one were to follow this simple approach, he or she would be almost assured of investment success. It has certainly worked for Warren Buffett. But as Buffett says, he had to learn this great lesson over many years of experience and with having made many mistakes. We can avoid repeating some very harsh investment mistakes if we just follow Buffett’s notion of The Three Rights.

References

Buffett, M. and D. Clark (1997). Buffettology: The previously unexplained techniques that have made Warren Buffett the world’s most famous investor. New York, Simon & Schuster.

Buffett, W. (1996). Warren Buffett: MBA Talk at University of North Carolina. University of North Carolina, University of North Carolina. University of North Carolina

Damodaran, A. (2011). The Little Book of Valuation: How to Value a Company, Pick a Stock, and Profit. Hoboken, New Jersey, John Wiley & Sons, Inc.

Hagstrom, R. G. (1994). The Warren Buffett way: Investment strategies of the world’s greatest investor. New York, Wiley.

Economic and Investment Highlights

Last Week

SpaceX won a defense contract to be one of the Pentagon’s two primary satellite launch providers.

The 10-year Treasury has lost its place as a preferred market barometer among some investors due to its stagnant yield.

Berkshire Hathaway’s earning surged 86 percent due in large part to the stock market rebound.

The U.S. surpassed 5 million coronavirus cases. Globally, coronavirus cases exceeded 20 million.

The U.S. budget deficit shrank last month as businesses and households made tax payments which were delayed from April.

The federal government spent $250 billion on enhanced unemployment benefits from April through July as part of its stimulus efforts.

California Senator Kamala Harris was named to be Joe Biden’s running mate.

The Big Ten and Pac-12 voted to postpone college football due to the pandemic.

China’s Xi is laying out plans for China to rely more on its domestic economy.

U.S. consumer prices rose in July.

The U.K. economy declined 20.4% in the second quarter.

The federal deficit tripled in the first ten months of the fiscal year as stimulus spending outpaced tax revenues.

The Dow, the S&P 500, and the Nasdaq all rose for the week. The Dow was up 1.8%; the S&P 500 was up 0.64%; and the Nasdaq was up 0.1%. The 10-year treasury yield ended the week at 0.708%. Gold closed at $1,937.00 for the week. Oil closed at $42.01 for the week.

The Week Ahead

This link takes you to Econoday’s Economic Calendar and Economic Events and Analysis which shows the upcoming economic reporting events scheduled in the week and months ahead.

Summary

Note: The models below may not capture the impact of COVID-19 beyond their impact on GDP source data and relevant economic reports that have already been released. They may not anticipate the impact of COVID-19 on forthcoming economic reports beyond the standard internal dynamics of the models.

Note: The comments that follow are derived from the economic indicators referenced in the Resources section of this newsletter and other sources in this report.

The Aruoba-Diebold-Scotti Business Conditions Index (ALS) had been trending up for several weeks from having dipped in 2019. Recently with the advent of the economic collapse, the index crashed. It has now been generally trending up again, but fluctuating within a narrow band. This is a positive indicator for the economy on a short-term basis.

The GDPNow model estimate for real GDP growth (seasonally adjusted annual rate) in the third quarter of 2020 is 25.6 percent. This reading differs from the ALS model assessment of an improving short-term economic environment.

The New York Fed Staff Nowcast stands at 14.6 percent for 2020:Q3.

The Chicago Fed National Activity Index (CFNAI) showed an increase in economic activity in June. The Chicago Fed National Activity Index (CFNAI) was +4.11 in June, up from +3.50 in May.

All told, these short-term economic indicators are a mixed analysis for the economy, at least on a short-term basis.

Expectations that stock prices will rise over the next six months is now at 30.4% in a recent AAII Sentiment Survey. The historical average is 38.0% for the survey. 27.2% of the investors in the survey described their short-term outlook as neutral and 42.4% were bearish. Please see the AAII Sentiment Survey for the complete results.

The latest Gross Output (GO) reading (July 6, 2020) showed that Gross Output slowed significantly in the first quarter of 2020.

On a longer-term basis, the forecasters in the Philadelphia Fed’s Survey of Professional Forecasters (as of August 14, 2020) predict real GDP will increase at 19.1 percent for the third quarter of 2020, 5.8 percent in the fourth quarter of 2020, 5.2 percent in the first quarter of 2021, 3.8 percent in the second quarter of 2021, and 3.6 percent in the third quarter of 2021. On an annual-average over annual-average basis, the forecasters predict real GDP to contract -5.2 percent in 2020; and grow 3.2 percent in 2021, 3.5 percent in 2022 and 2.2 percent in 2023. The forecasters predict the unemployment rate will be 10.0 percent in Q3 and 9.5 percent in Q4; and will be 9.0 percent in 2020; 8.0 percent in 2021, 6.0 percent in 2022, and 5.3 percent in 2023. The next survey release date is November 16, 2020.

The National Association for Business Economics (NABE) released an Outlook Flash Survey on April 10, 2020. The NABE panel expects GDP declines in Q1 2020 and Q2 2020, and upticks in Q3 2020 and Q4 2020. The panel believes the U.S. economy is already in a recession and predicts real GDP will grow at an annual rate of -2.4 percent for the first quarter of 2020, -26.5 percent for the second quarter of 2020, 2.0 percent in the third quarter of 2020, 5.8 percent in the fourth quarter of 2020, and 6.0 percent in the first quarter of 2021. The forecasters expect unemployment to average 3.8% in Q1 2020. The median unemployment rate projection for Q2 2020 is 12.0%. The unemployment rate is expected to fall back to 9.5% at the end of 2020, and to 6.0% at year-end 2021. The panel’s forecast for the PCE price index less food and energy calls for a slowdown in the annual rate of change from 1.7% in Q1 to 0.8% in Q2 2020. The panel expects the rate to increase gradually to 1.7% in the last half of 2021.

For a more in-depth review and analysis of the economy, please see our mini-book on economic analysis and forecasting entitled: Simple and Effective Economic Forecasting.

Stock Market Valuations

Our estimates of the market valuations for two stock market indices, the Dow Jones Industrial Average (DJIA) and the Standard & Poor’s 500 (S&P 500), can be found in the file below:

Conclusion

During this time of global flux due to the coronavirus, I am leaving the Conclusion discussion below the same as was posted on March 23, 2020. The March 23, 2020 discussion still adequately reflects my thinking on the current state of affairs.

Important Note: While I don’t believe it is time to jump back into the stock market in a big way because of the market’s overvaluation, I have been advising the last few of weeks in this Commentary and in my weekly podcast, Intrinsic Value Wealth Report Radio, that investors can continue building their investment portfolios by selecting individual securities that offer growth and value opportunities.

Reprinted from March 23, 2020

Up until the past week, the economy had been in a stable but somewhat vulnerable state. Nonetheless, it had remained fairly strong. In fact, robust consumer spending and strong labor market conditions had given us confidence that the economy, which had been in its tenth year of expansion, could continue to grow. But we were cautious on this outlook. There were several reasons for our caution. U.S. business growth had been mixed. And global economic growth had been mixed as well. The new coronavirus was becoming a global economic threat, although it was still too early to tell how much of an effect it would ultimately have. Debt is at high levels for consumers, businesses, and government (at all levels of government). Finally, this is an election year that will likely have significant consequences either positively or negatively depending on the outcome of the elections. And of course, it is still too early to tell what the outcome of the elections will be.

In just a few days, the coronavirus’s effect on the economy and the markets went from a ripple to a tsunami. Businesses are shuttering, events are being cancelled or postponed, grocery store shelves are empty, and people are being asked or ordered to stay home. The markets are now deep in bear market territory. The effects on the economy, even given the short time that the economy has been retreating, may be with us for a long time. There is now a much greater risk of a recession, and there has even been some talk of a depression. The government, the Fed, Republicans, and Democrats, and pretty much the entire country, is trying to get the virus under control and is coming up with plans to mitigate the long-term economic effects caused by the virus. But the virus has impacted the economy – in a significant way – in just a short time. How long lasting the effects will be no one can tell right now. The economy has been largely shut down and remains so today. It takes time to restart the economy after a situation such as what is occurring at the present time.

Given these events and the rapidly deteriorating situation, as I said last week, I would caution not to panic. The economy and the markets will get better. The situation is bad – there is no doubt about that – but it will turn around. The real question is when will it turn around? No one knows that at the present time. But it will turn around.

For now, review your investment portfolios. It is highly likely that all or most of your stocks are down. You should not consider selling the bulk of your stocks – only consider selling companies that are not sound companies. But do recognize that as the economy deteriorates, even good companies will be affected.

For stock market value hunters, we believe it is still too early to jump back in. We will be closely monitoring the markets using the many tools and models that we have developed over the years to assess the economy and the markets. We will use our best judgement and thoughts to let you know when we believe things are turning around. The turnaround hasn’t happened yet.

We believe it is important to maintain a long-term view toward investing. But for now, just sit tight. Eventually, this means that you should continue building your investment portfolio using the Cassandra Stock Selection Model to select individual securities that offer growth and value opportunities.

Chart for Review and Thought

Federal Surplus or Deficit

Simple and Effective Economic Forecasting Model

Note: The table and chart below have not been updated. However, we believe that a recession is quite likely. In the chart below, the bottom green line shows what a recession could look like.

Notes (GDP Growth Chart):

  1. See the July 8, 2019 Commentary for an introduction to this model.
  2. Actual numbers 2007 through 2019; forecasted numbers thereafter.
  3. Normal GDP growth is typically in the 2% to 3% range.
  4. A recession is generally defined as two consecutive quarters of negative economic growth as measured by a country’s gross domestic product (GDP).

Thought for the Week

“Congress does two things well: nothing and overreacting.” – Michael Oxley

Announcements

The Intrinsic Value Wealth Report has started a new YouTube channel called Intrinsic Value Wealth Report TV. You can view the YouTube channel at Intrinsic Value Wealth Report TV.

The Intrinsic Value Wealth Report has started a new podcast called Intrinsic Value Wealth Report Radio. You can listen to the podcast at Intrinsic Value Wealth Report Radio.

Dr. Wendee spoke at the Investment Club of America’s annual economic summit, called Econosummit, on Sunday March 1, 2020 in Las Vegas.

Dr. Wendee attended the The National Due Diligence Alliance (TNDDA) investment banking conference, which was held March 6-8, 2020 at the Four Seasons Resort in Dallas, Texas. This is a conference held several times throughout the year for investment bankers and registered investment advisers to learn about new opportunities in the Alternative Investment asset classes.

TNDDA Meeting in Dallas, Texas

We have been researching the use of crowdsourcing for investment ideas. We will be sending a survey out in the next few weeks to get your input on the economy and the markets; and to get any investment ideas that you would like to share. We will compile this input and distribute the results to you and our other subscribers. We have been testing our crowdsourcing models with students and have been having good success and results.

Dr. Wendee has been researching and writing a new theory of economics known as, The Value Creation Theory of the Economy (also known as, Intrinsinomics). The full paper on Intrinsinomics will be published in the near future.

Finance 3350: Personal Finance-Portfolio & Risk Management– Dr. Wendee started teaching Finance 3350 – Portfolio & Risk Management at California State University, Los Angeles (CSULA) for the Summer term starting May 2020. Dr. Wendee teaches courses in Management and Finance at CSULA.

Business 548: Strategy and Decision Making – Dr. Wendee will be teaching Business 548 – Strategy and Decision Making at California Baptist University (CBU) starting at the end of June 2020. Dr. Wendee teaches courses in Finance, Business, Strategy & Decision Making, and Economics at CBU.

Business 303: Business Finance – Dr. Wendee will be teaching Business 303 – Business Finance at California Baptist University (CBU) starting at the end of August 2020. Dr. Wendee teaches courses in Finance, Business, Strategy & Decision Making, and Economics at CBU.

Dr. Wendee presented a paper on his new theory of economics known as, The Value Creation Theory of the Economy (also known as, Intrinsinomics), at the International Leadership Association’s annual global conference which was held in Ottawa, Canada last Fall.

Dr. Wendee will present an updated paper on his new theory of economics known as, The Value Creation Theory of the Economy (also known as, Intrinsinomics), at the International Leadership Association’s annual global conference which will be held in San Francisco, California in November.

Dr. Wendee is working on a financial planning modeling program which will be available in the near future. The modeling program is designed to assist anyone in creating a financial plan and is customizable for each person’s unique financial planning goals. A working draft of the model is currently in beta test with students. Click this link, schematic, to go to the clickable document under the subheading Financial Planning Process (Draft) in the Intrinsic Value Wealth Report to see a draft of the schematic for the new financial planning process.

Dr. Wendee has been developing an econometric model specifically designed to monitor and forecast the global economy as this current economic crisis unfolds. This new econometric model is based on other econometric models that he has designed and have used for many years. You can find some of these earlier models in Book # 6 – Simple and Effective Economic Forecasting in the sister website to this website which is called the Intrinsic Value Wealth Report. The new econometric model has been constructed with some additional tools and methods that he has learned and some that he has developed over the last several years. He will be talking more about this new econometric model in this Commentary over the next few months. His comments and forecasts on the economy and the markets going forward will be based to a significant extent on this new model.

We have begun raising capital for our fund-of-funds investment, Northwest Quadrant Opportunity Fund, LLC. The fund engineers and constructs an investment vehicle consisting of Alternative Asset investments. The fund’s objective is to build a diversified portfolio of strong, solid, steady- performing assets, with highly qualified asset managers who have proven track records that meet our underwriting requirements. To learn more about the Northwest Quadrant Opportunity Fund, LLC and to obtain an offering memorandum, please click Northwest Quadrant Opportunity Fund, LLC.

Intrinsic Value Wealth Creation pyramid

We always conclude our commentary with a discussion of the Intrinsic Value Wealth Creation Pyramid. The Intrinsic Value Wealth Creation Pyramid is designed to show some of the major categories for building wealth. It is the result of many years of study of the wealth building process; experience working with clients who have built considerable wealth; and my own personal experience building wealth. Newsletter subscribers should consult the Intrinsic Value Wealth Creation Pyramid as one of many useful investment tools while considering their investment plans.

The chart in this section is an expanded version of the Intrinsic Value Wealth Creation Pyramid Chart referenced in the Forbes.com article entitled, Nine Of The Best Ways To Build Wealth.

RESOURCES

See our Resources section for links to economic and other resources used in the preparation of this Commentary.
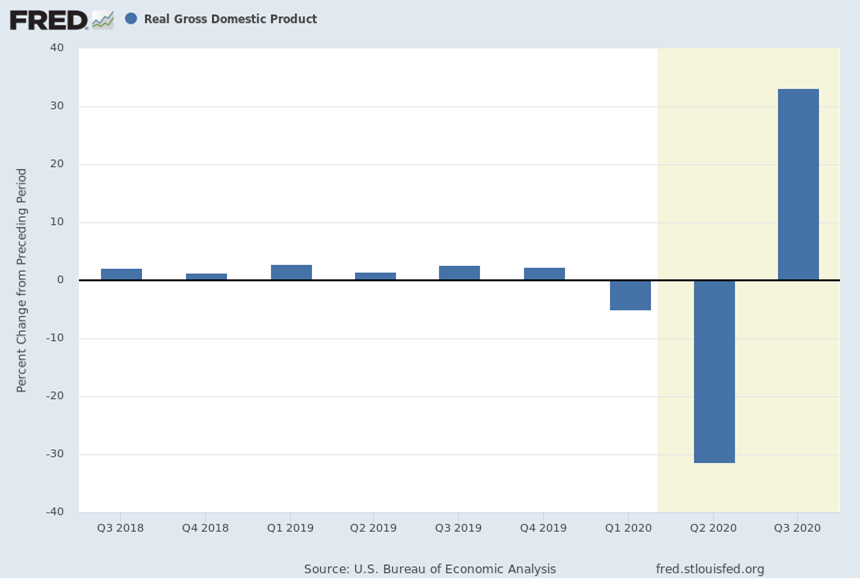
Posted in Economic & Business Chart Room, Economic Outlook, Entrepreneurship, Focus List, Investment Recommendations, Investments, Notes From The Field, Special Situations, Uncategorized, VDI/REEP, Visionary Ideas | Tagged , , , , , , , , , , , , , , , , , , , , , , , , , , , , , , , , , | Comments Off on WEEKLY COMMENTARY August 18, 2020

WEEKLY COMMENTARY August 11, 2020

Should You Plan On Working From Home Well Into The Future? What the Market May Be Telling You!

There is a theory going around that the high valuations of tech stocks might be suggesting the effects of this pandemic will be with us for a long time. Actually, this comes as no surprise to us. We have been saying for quite some time that the economy has been severely impacted by the coronavirus. That alone will mean that the effects of the pandemic will be with us for a long time. The theory also suggests that there may be permanent changes to our work and social lives. Again, we have been saying this for quite some time now. In fact, back in March of this year when the pandemic started, I launched a series of crowdsourcing surveys to explore these ideas. The survey respondents gave a lot of possible changes to how we go about living our lives in the future. I will be publishing the results of these surveys in the near future.

What is particularly interesting about this theory regarding high tech company market valuations is that it posits a market-based approach to understanding the effects of the pandemic. We are proponents of using market-based approaches to understand economic and social phenomena. We note, however, that while markets are efficient (meaning that market prices reflect all available, relevant information), they are not always correct in their assessment of economic and social phenomena. For example, we have estimated that the stock market is wrong roughly 20% of the time (see our April 27, 2020 Commentary).

The S&P 500 is dominated by Apple, Amazon, Microsoft, Alphabet, and Facebook. Together these stocks comprise approximately 20% (as of June 15, 2020) of the market capitalization weighting of the index. Today those stocks make up a higher weighting in the S & P 500 index due to their collective rise in price since June. Those companies have been performing well in this market largely due to them being technology companies that have products and services that are in high demand during this crisis and after. This has been a significant factor in the surge in the S&P 500.

The spectacular rise in the S&P 500 has left the markets very overvalued. As of last Friday, the Dow Jones Industrial Average was trading at a P/E ratio of 26.62 and the S&P 500 was trading at a P/E ratio of 28.81. Those are very overvalued markets! But as mentioned, some of that valuation is due to the performance of the five stocks and others that dominate the S&P 500 and other markets.

So what would it take to justify these high valuations? One way to look at the valuation situation is to calculate how much the earnings would have to grow to justify the current market valuations. If we assume that prices stay the same and look at a more reasonable P/E ratio of 22 for growth companies (the Nasdaq 100 has been trading at a P/E multiple of around 36 recently), earnings on these companies would have to grow by almost 18% per year over the next three years for the earnings to grow into the valuations that the market is currently assigning to them. This is not an impossible feat. In fact, because these companies are playing such a central role in the current economic and social environment and are likely to play an even bigger role in the future, some premium valuation may be warranted. But it should be noted that many analysts are forecasting much less of a growth rate for these companies over that time period. The bottom line is that if the markets for tech stocks are correct in their assessment of the prospects for these companies this time around, you had better make plans for working from home for quite a while longer.

Economic and Investment Highlights

Last Week

The Fed is preparing to end its policy of preemptively raising rates to head off inflation.

Credit card debt and delinquencies have been falling as consumers spend stimulus money.

A falling dollar may be helping lift stock market prices.

The airline industry is again asking for more federal government help.

There has been a steep rise in homicides in large cities this year.

Retailer Lord & Taylor filed for bankruptcy.

Argentina is restructuring $65 billion in foreign debt to resolve its third default in 20 years.

The U.S expects to borrow an additional $2 trillion in the second half of this year.

Global factory output was constrained in July due to pandemic related global trade.

Initial job claims fell but remain at historically high levels. The unemployment rate is at 10.2%. The U.S. has not yet restored half of the jobs lost due to the pandemic.

The death toll in the U.S. from the coronavirus passed 160,000.

The Dow, the S&P 500, and the Nasdaq all rose for the week. The Dow was up 3.8%; the S&P 500 was up 2.45%; and the Nasdaq was up 2.5%. The 10-year treasury yield ended the week at 0.562%. Gold closed at $2,010.10 for the week. Oil closed at $41.22 for the week.

The Week Ahead

This link takes you to Econoday’s Economic Calendar and Economic Events and Analysis which shows the upcoming economic reporting events scheduled in the week and months ahead.

Summary

Note: The models below may not capture the impact of COVID-19 beyond their impact on GDP source data and relevant economic reports that have already been released. They may not anticipate the impact of COVID-19 on forthcoming economic reports beyond the standard internal dynamics of the models.

Note: The comments that follow are derived from the economic indicators referenced in the Resources section of this newsletter and other sources in this report.

The Aruoba-Diebold-Scotti Business Conditions Index (ALS) had been trending up for several weeks from having dipped in 2019. Recently with the advent of the economic collapse, the index crashed. It has now been generally trending up again, but fluctuating within a narrow band. This is a positive indicator for the economy on a short-term basis.

The GDPNow model estimate for real GDP growth (seasonally adjusted annual rate) in the third quarter of 2020 is 20.5 percent. This reading differs from the ALS model assessment of an improving short-term economic environment.

The New York Fed Staff Nowcast stands at 14.6 percent for 2020:Q3.

The Chicago Fed National Activity Index (CFNAI) showed an increase in economic activity in June. The Chicago Fed National Activity Index (CFNAI) was +4.11 in June, up from +3.50 in May.

All told, these short-term economic indicators are a mixed analysis for the economy, at least on a short-term basis.

Expectations that stock prices will rise over the next six months is now at 30.0% in a recent AAII Sentiment Survey. The historical average is 38.0% for the survey. 27.8% of the investors in the survey described their short-term outlook as neutral and 42.1% were bearish. Please see the AAII Sentiment Survey for the complete results.

The latest Gross Output (GO) reading (July 6, 2020) showed that Gross Output slowed significantly in the first quarter of 2020.

On a longer-term basis, the forecasters in the Philadelphia Fed’s Survey of Professional Forecasters (as of May 15, 2020) predict real GDP will contract at an annual rate of -32.2 percent for the second quarter of 2020; and increase at 10.6 percent for the third quarter of 2020, 6.5 percent in the fourth quarter of 2020, 6.8 percent in the first quarter of 2021, and 4.1 percent in the second quarter of 2021. On an annual-average over annual-average basis, the forecasters predict real GDP to contract -5.6 percent in 2020; and grow 3.1 percent in 2021, 4.1 percent in 2022 and 2.2 percent in 2023. The forecasters predict the unemployment rate will be above 10.0 percent over the next three quarters (16.1 percent in Q2, 12.9 percent in Q3, and 11.0 percent in Q4); will be 10.8 percent in 2020; 8.1 percent in 2021, 6.2 percent in 2022, and 5.1 percent in 2023. The next survey release date is August 14, 2020.

The National Association for Business Economics (NABE) released an Outlook Flash Survey on April 10, 2020. The NABE panel expects GDP declines in Q1 2020 and Q2 2020, and upticks in Q3 2020 and Q4 2020. The panel believes the U.S. economy is already in a recession and predicts real GDP will grow at an annual rate of -2.4 percent for the first quarter of 2020, -26.5 percent for the second quarter of 2020, 2.0 percent in the third quarter of 2020, 5.8 percent in the fourth quarter of 2020, and 6.0 percent in the first quarter of 2021. The forecasters expect unemployment to average 3.8% in Q1 2020. The median unemployment rate projection for Q2 2020 is 12.0%. The unemployment rate is expected to fall back to 9.5% at the end of 2020, and to 6.0% at year-end 2021. The panel’s forecast for the PCE price index less food and energy calls for a slowdown in the annual rate of change from 1.7% in Q1 to 0.8% in Q2 2020. The panel expects the rate to increase gradually to 1.7% in the last half of 2021.

For a more in-depth review and analysis of the economy, please see our mini-book on economic analysis and forecasting entitled: Simple and Effective Economic Forecasting.

Stock Market Valuations

Our estimates of the market valuations for two stock market indices, the Dow Jones Industrial Average (DJIA) and the Standard & Poor’s 500 (S&P 500), can be found in the file below:

Conclusion

During this time of global flux due to the coronavirus, I am leaving the Conclusion discussion below the same as was posted on March 23, 2020. The March 23, 2020 discussion still adequately reflects my thinking on the current state of affairs.

Important Note: While I don’t believe it is time to jump back into the stock market in a big way because of the market’s overvaluation, I have been advising the last few of weeks in this Commentary and in my weekly podcast, Intrinsic Value Wealth Report Radio, that investors can continue building their investment portfolios by selecting individual securities that offer growth and value opportunities.

Reprinted from March 23, 2020

Up until the past week, the economy had been in a stable but somewhat vulnerable state. Nonetheless, it had remained fairly strong. In fact, robust consumer spending and strong labor market conditions had given us confidence that the economy, which had been in its tenth year of expansion, could continue to grow. But we were cautious on this outlook. There were several reasons for our caution. U.S. business growth had been mixed. And global economic growth had been mixed as well. The new coronavirus was becoming a global economic threat, although it was still too early to tell how much of an effect it would ultimately have. Debt is at high levels for consumers, businesses, and government (at all levels of government). Finally, this is an election year that will likely have significant consequences either positively or negatively depending on the outcome of the elections. And of course, it is still too early to tell what the outcome of the elections will be.

In just a few days, the coronavirus’s effect on the economy and the markets went from a ripple to a tsunami. Businesses are shuttering, events are being cancelled or postponed, grocery store shelves are empty, and people are being asked or ordered to stay home. The markets are now deep in bear market territory. The effects on the economy, even given the short time that the economy has been retreating, may be with us for a long time. There is now a much greater risk of a recession, and there has even been some talk of a depression. The government, the Fed, Republicans, and Democrats, and pretty much the entire country, is trying to get the virus under control and is coming up with plans to mitigate the long-term economic effects caused by the virus. But the virus has impacted the economy – in a significant way – in just a short time. How long lasting the effects will be no one can tell right now. The economy has been largely shut down and remains so today. It takes time to restart the economy after a situation such as what is occurring at the present time.

Given these events and the rapidly deteriorating situation, as I said last week, I would caution not to panic. The economy and the markets will get better. The situation is bad – there is no doubt about that – but it will turn around. The real question is when will it turn around? No one knows that at the present time. But it will turn around.

For now, review your investment portfolios. It is highly likely that all or most of your stocks are down. You should not consider selling the bulk of your stocks – only consider selling companies that are not sound companies. But do recognize that as the economy deteriorates, even good companies will be affected.

For stock market value hunters, we believe it is still too early to jump back in. We will be closely monitoring the markets using the many tools and models that we have developed over the years to assess the economy and the markets. We will use our best judgement and thoughts to let you know when we believe things are turning around. The turnaround hasn’t happened yet.

We believe it is important to maintain a long-term view toward investing. But for now, just sit tight. Eventually, this means that you should continue building your investment portfolio using the Cassandra Stock Selection Model to select individual securities that offer growth and value opportunities.

Chart for Review and Thought

Unemployment Rate

Simple and Effective Economic Forecasting Model

Note: The table and chart below have not been updated. However, we believe that a recession is quite likely. In the chart below, the bottom green line shows what a recession could look like.

Notes (GDP Growth Chart):

  1. See the July 8, 2019 Commentary for an introduction to this model.
  2. Actual numbers 2007 through 2019; forecasted numbers thereafter.
  3. Normal GDP growth is typically in the 2% to 3% range.
  4. A recession is generally defined as two consecutive quarters of negative economic growth as measured by a country’s gross domestic product (GDP).

Thought for the Week

“When you are up to your ass in alligators, it’s hard to remember that your prime objective is to drain the swamp.” –An Old Army Saying

Announcements

The Intrinsic Value Wealth Report has started a new YouTube channel called Intrinsic Value Wealth Report TV. You can view the YouTube channel at Intrinsic Value Wealth Report TV.

The Intrinsic Value Wealth Report has started a new podcast called Intrinsic Value Wealth Report Radio. You can listen to the podcast at Intrinsic Value Wealth Report Radio.

Dr. Wendee spoke at the Investment Club of America’s annual economic summit, called Econosummit, on Sunday March 1, 2020 in Las Vegas.

Dr. Wendee attended the The National Due Diligence Alliance (TNDDA) investment banking conference, which was held March 6-8, 2020 at the Four Seasons Resort in Dallas, Texas. This is a conference held several times throughout the year for investment bankers and registered investment advisers to learn about new opportunities in the Alternative Investment asset classes.

TNDDA Meeting in Dallas, Texas

We have been researching the use of crowdsourcing for investment ideas. We will be sending a survey out in the next few weeks to get your input on the economy and the markets; and to get any investment ideas that you would like to share. We will compile this input and distribute the results to you and our other subscribers. We have been testing our crowdsourcing models with students and have been having good success and results.

Dr. Wendee has been researching and writing a new theory of economics known as, The Value Creation Theory of the Economy (also known as, Intrinsinomics). The full paper on Intrinsinomics will be published in the near future.

Finance 3350: Personal Finance-Portfolio & Risk Management– Dr. Wendee started teaching Finance 3350 – Portfolio & Risk Management at California State University, Los Angeles (CSULA) for the Summer term starting May 2020. Dr. Wendee teaches courses in Management and Finance at CSULA.

Business 548: Strategy and Decision Making – Dr. Wendee will be teaching Business 548 – Strategy and Decision Making at California Baptist University (CBU) starting at the end of June 2020. Dr. Wendee teaches courses in Finance, Business, Strategy & Decision Making, and Economics at CBU.

Dr. Wendee presented a paper on his new theory of economics known as, The Value Creation Theory of the Economy (also known as, Intrinsinomics), at the International Leadership Association’s annual global conference which was held in Ottawa, Canada last Fall.

Dr. Wendee will present an updated paper on his new theory of economics known as, The Value Creation Theory of the Economy (also known as, Intrinsinomics), at the International Leadership Association’s annual global conference which will be held in San Francisco, California in November.

Dr. Wendee is working on a financial planning modeling program which will be available in the near future. The modeling program is designed to assist anyone in creating a financial plan and is customizable for each person’s unique financial planning goals. A working draft of the model is currently in beta test with students. Click this link, schematic, to go to the clickable document under the subheading Financial Planning Process (Draft) in the Intrinsic Value Wealth Report to see a draft of the schematic for the new financial planning process.

Dr. Wendee has been developing an econometric model specifically designed to monitor and forecast the global economy as this current economic crisis unfolds. This new econometric model is based on other econometric models that he has designed and have used for many years. You can find some of these earlier models in Book # 6 – Simple and Effective Economic Forecasting in the sister website to this website which is called the Intrinsic Value Wealth Report. The new econometric model has been constructed with some additional tools and methods that he has learned and some that he has developed over the last several years. He will be talking more about this new econometric model in this Commentary over the next few months. His comments and forecasts on the economy and the markets going forward will be based to a significant extent on this new model.

We have begun raising capital for our fund-of-funds investment, Northwest Quadrant Opportunity Fund, LLC. The fund engineers and constructs an investment vehicle consisting of Alternative Asset investments. The fund’s objective is to build a diversified portfolio of strong, solid, steady- performing assets, with highly qualified asset managers who have proven track records that meet our underwriting requirements. To learn more about the Northwest Quadrant Opportunity Fund, LLC and to obtain an offering memorandum, please click Northwest Quadrant Opportunity Fund, LLC.

Intrinsic Value Wealth Creation pyramid

We always conclude our commentary with a discussion of the Intrinsic Value Wealth Creation Pyramid. The Intrinsic Value Wealth Creation Pyramid is designed to show some of the major categories for building wealth. It is the result of many years of study of the wealth building process; experience working with clients who have built considerable wealth; and my own personal experience building wealth. Newsletter subscribers should consult the Intrinsic Value Wealth Creation Pyramid as one of many useful investment tools while considering their investment plans.

The chart in this section is an expanded version of the Intrinsic Value Wealth Creation Pyramid Chart referenced in the Forbes.com article entitled, Nine Of The Best Ways To Build Wealth.

RESOURCES

See our Resources section for links to economic and other resources used in the preparation of this Commentary.
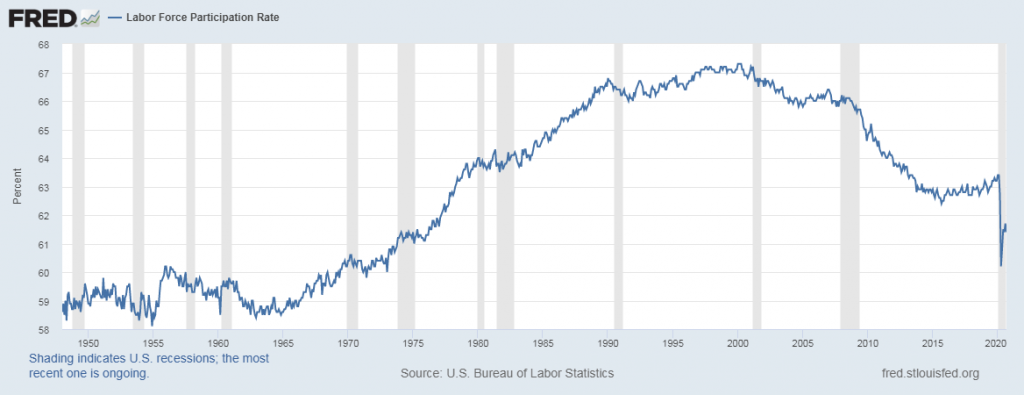
Posted in Economic & Business Chart Room, Economic Outlook, Entrepreneurship, Focus List, Investment Recommendations, Investments, Notes From The Field, Special Situations, Uncategorized, VDI/REEP, Visionary Ideas | Tagged , , , , , , , , , , , , , , , , , , , , , , , , , , , , , , , , , | Comments Off on WEEKLY COMMENTARY August 11, 2020

WEEKLY COMMENTARY August 3, 2020

Not So Bullish, But Still Overvalued Part V

In the June 15, 2020 Commentary, I wrote the commentary below (excerpted). What is interesting is that seven weeks later, little has changed. In fact, with respect to each observation below, the overall situation has just gotten a little worse. I thought it would be instructive to revisit what I wrote on June 15th as the situation today is so similar to what it was then.

I did a series of podcasts that were labeled Not So Bullish, But Still Overvalued Part I through Part IV. These podcasts roughly coincided with the commentaries in the print edition of the Intrinsic Value Wealth Report Newsletter.  Accordingly, the lead article in this week’s Commentary is titled: Not So Bullish, But Still Overvalued Part V. The following is from the June 15th Commentary.

[Beginning of the quoted section]: “The number of Coronavirus cases across the U.S. and globally is on the rise; the U.S. and global economies continue to be adversely impacted by the Coronavirus and the economic effect is getting worse in most cases; and U.S. states and many global countries appear to be reopening too soon. And yet despite this bad news on the Coronavirus and its effects on the worldwide economy, the stock market, as measured by the Standard & Poor’s 500 (S&P 500), has risen from its March lows, although it remains below the highs set in February. What is happening here?

“There are several factors to consider regarding “The Market.” The first factor is to ask, what is “The Market”? There are many gauges, or indices, which people use to refer to “The Market” – the S&P 500 is only one such gauge. Another popular gauge for “The Market” is the Dow Jones Industrial Average. There are other indices for “The Market,” but these are the two that are most often used by investors and referred to in the popular press.

“The next question is to ask, what is the composition of these indices? The S&P 500 is a market-capitalization-weighted index of the 500 largest U.S. publicly traded companies. The Dow Jones Industrial Average (Dow 30) is a price-weighted index that gives companies with higher stock prices a higher index weighting. The Dow Jones Industrial Average is composed of 30 large, publicly-traded, blue-chip companies trading on the New York Stock Exchange and the Nasdaq.

“Another factor, and an important insight, is that if one is using the S&P500 as the gauge for the “The Market,” as many institutional investors do, it must be recognized that there may be a few very large capitalization stocks that dominate the index and that may be distorting the true performance of the entire index. That is, in fact, what is happening. The S&P 500 is currently dominated by Apple, Amazon, Microsoft, Alphabet, and Facebook. Together these stocks comprise approximately 20% of the market capitalization weighting of the index. And those companies have been performing well in this market largely due to them being technology companies that have products and services that are in high demand during this crisis. This has been a significant factor in the surge in “The Market.”

“‘The Market,’ as measured by both the S&P 500 and the Dow Jones Industrial Average, is overvalued. As of Friday, the S&P 500 had a trailing P/E ratio of 21.81; and the Dow Jones Industrial Average had a trailing P/E ratio of 21.41. That is an overvalued market! Our research shows that a fair-value P/E ratio over the long-term should be in the range of 15 to 18.

In my April 27, 2020 Commentary, I summed up market valuation this way: ‘The bottom line is that the stock market is sometimes wrong. This can be seen quite clearly in the S&P 500 Forward P/E and Annualized 10-Year Returns chart (please sign up for the free account at this link to view this chart if you don’t already have an account – the chart is near the bottom of this page). As you can see in this chart, around 20 percent of the returns were in the negative area of the chart. These were periods of time when investors were buying in very overpriced markets. Overpriced markets are prime examples of when investors are wrong in their assessment of the prospects for these markets. And as the results show, these are times when the markets were comprised of investors that were indeed wrong.’” [End of the quoted section].

In the current market (as of August 3, 2020), ‘The Market,’ as measured by both the S&P 500 and the Dow Jones Industrial Average, is very overvalued. As of Friday, the S&P 500 had a trailing P/E ratio of 28.12; and the Dow Jones Industrial Average had a trailing P/E ratio of 25.04. That is a very overvalued market! Compare that to ‘The Market’ P/E ratios on June 15th (see above). Our research shows that a fair-value P/E ratio over the long-term should be in the range of 15 to 18.

For investors in the current market environment, the bottom line is that there is still a pandemic that is on the rise; a global economy that has suffered irreparable damage; and market indices that are indicating a very overvalued market. All of these situations will improve at some point in time, but we are not there yet. As I have been advising over the past few weeks, I believe that investors should continue building their investment portfolios by selecting individual securities that offer growth and value opportunities. Now is not the time to jump back into the market in a big way though.

Economic and Investment Highlights

Last Week

Wells Fargo is cutting staff and curbing lending, in a sign that other banks may follow suit.

Global coronavirus infections surpassed 16 million. North Korea declared a Covid-19 emergency. Covid-19 deaths in the U.S. exceeded 150,000. The U.S. leads the world in cases and deaths.

Protests over racism and police practices continued across the U.S. and turned violent in some cases.

Google announced that employees will work from home until at least next July.

Gold prices hit another record, closing the week at $1,962.80.

The Fed said economic recovery will depend to a large extent on efforts to curb the coronavirus. It also pledged to continue aggressive support measures as the outlook dims.

Boeing plans to cut more production and jobs.

The U.S. Postal Service will get a $10 billion loan from the Treasury Department.

U.S. GDP fell a record 32.9% in the second quarter. The jobs market has been faltering as well. These signs point to a slowing recovery as coronavirus cases surge.

Big oil companies had one of their worst second quarters.

The Dow fell, while the S&P 500 and the Nasdaq rose for the week. The Dow was down 0.2%; the S&P 500 was up 1.73%; and the Nasdaq was up 3.7%. The 10-year treasury yield ended the week at 0.536%. Gold closed at $1,962.80 for the week. Oil closed at $40.27 for the week.

The Week Ahead

This link takes you to Econoday’s Economic Calendar and Economic Events and Analysis which shows the upcoming economic reporting events scheduled in the week and months ahead.

Summary

Note: The models below may not capture the impact of COVID-19 beyond their impact on GDP source data and relevant economic reports that have already been released. They may not anticipate the impact of COVID-19 on forthcoming economic reports beyond the standard internal dynamics of the models.

Note: The comments that follow are derived from the economic indicators referenced in the Resources section of this newsletter and other sources in this report.

The Aruoba-Diebold-Scotti Business Conditions Index (ALS) had been trending up for several weeks from having dipped in 2019. Recently with the advent of the economic collapse, the index crashed. It has now been generally trending up again, but fluctuating within a narrow band. This is a positive indicator for the economy on a short-term basis.

The GDPNow model estimate for real GDP growth (seasonally adjusted annual rate) in the second quarter of 2020 is -34.5 percent. This reading differs from the ALS model assessment of an improving short-term economic environment.

The New York Fed Staff Nowcast stands at -14.3% for 2020:Q2 and 13.2 for 2020:Q3.

The Chicago Fed National Activity Index (CFNAI) showed a decrease in economic activity in April. The Chicago Fed National Activity Index (CFNAI) was +4.11 in June, up from +3.50 in May.

All told, these short-term economic indicators are a mixed analysis for the economy, at least on a short-term basis.

Expectations that stock prices will rise over the next six months is now at 30.8% in a recent AAII Sentiment Survey. The historical average is 38.0% for the survey. 23.8% of the investors in the survey described their short-term outlook as neutral and 45.4% were bearish. Please see the AAII Sentiment Survey for the complete results.

The latest Gross Output (GO) reading (July 6, 2020) showed that Gross Output slowed significantly in the first quarter of 2020.

On a longer-term basis, the forecasters in the Philadelphia Fed’s Survey of Professional Forecasters (as of May 15, 2020) predict real GDP will contract at an annual rate of -32.2 percent for the second quarter of 2020; and increase at 10.6 percent for the third quarter of 2020, 6.5 percent in the fourth quarter of 2020, 6.8 percent in the first quarter of 2021, and 4.1 percent in the second quarter of 2021. On an annual-average over annual-average basis, the forecasters predict real GDP to contract -5.6 percent in 2020; and grow 3.1 percent in 2021, 4.1 percent in 2022 and 2.2 percent in 2023. The forecasters predict the unemployment rate will be above 10.0 percent over the next three quarters (16.1 percent in Q2, 12.9 percent in Q3, and 11.0 percent in Q4); will be 10.8 percent in 2020; 8.1 percent in 2021, 6.2 percent in 2022, and 5.1 percent in 2023. The next survey release date is August 14, 2020.

The National Association for Business Economics (NABE) released an Outlook Flash Survey on April 10, 2020. The NABE panel expects GDP declines in Q1 2020 and Q2 2020, and upticks in Q3 2020 and Q4 2020. The panel believes the U.S. economy is already in a recession and predicts real GDP will grow at an annual rate of -2.4 percent for the first quarter of 2020, -26.5 percent for the second quarter of 2020, 2.0 percent in the third quarter of 2020, 5.8 percent in the fourth quarter of 2020, and 6.0 percent in the first quarter of 2021. The forecasters expect unemployment to average 3.8% in Q1 2020. The median unemployment rate projection for Q2 2020 is 12.0%. The unemployment rate is expected to fall back to 9.5% at the end of 2020, and to 6.0% at year-end 2021. The panel’s forecast for the PCE price index less food and energy calls for a slowdown in the annual rate of change from 1.7% in Q1 to 0.8% in Q2 2020. The panel expects the rate to increase gradually to 1.7% in the last half of 2021.

For a more in-depth review and analysis of the economy, please see our mini-book on economic analysis and forecasting entitled: Simple and Effective Economic Forecasting.

Stock Market Valuations

Our estimates of the market valuations for two stock market indices, the Dow Jones Industrial Average (DJIA) and the Standard & Poor’s 500 (S&P 500), can be found in the file below:

Conclusion

During this time of global flux due to the coronavirus, I am leaving the Conclusion discussion below the same as was posted on March 23, 2020. The March 23, 2020 discussion still adequately reflects my thinking on the current state of affairs.

Important Note: While I don’t believe it is time to jump back into the stock market in a big way because of the market’s overvaluation, I have been advising the last few of weeks in this Commentary and in my weekly podcast, Intrinsic Value Wealth Report Radio, that investors can continue building their investment portfolios by selecting individual securities that offer growth and value opportunities.

Reprinted from March 23, 2020

Up until the past week, the economy had been in a stable but somewhat vulnerable state. Nonetheless, it had remained fairly strong. In fact, robust consumer spending and strong labor market conditions had given us confidence that the economy, which had been in its tenth year of expansion, could continue to grow. But we were cautious on this outlook. There were several reasons for our caution. U.S. business growth had been mixed. And global economic growth had been mixed as well. The new coronavirus was becoming a global economic threat, although it was still too early to tell how much of an effect it would ultimately have. Debt is at high levels for consumers, businesses, and government (at all levels of government). Finally, this is an election year that will likely have significant consequences either positively or negatively depending on the outcome of the elections. And of course, it is still too early to tell what the outcome of the elections will be.

In just a few days, the coronavirus’s effect on the economy and the markets went from a ripple to a tsunami. Businesses are shuttering, events are being cancelled or postponed, grocery store shelves are empty, and people are being asked or ordered to stay home. The markets are now deep in bear market territory. The effects on the economy, even given the short time that the economy has been retreating, may be with us for a long time. There is now a much greater risk of a recession, and there has even been some talk of a depression. The government, the Fed, Republicans, and Democrats, and pretty much the entire country, is trying to get the virus under control and is coming up with plans to mitigate the long-term economic effects caused by the virus. But the virus has impacted the economy – in a significant way – in just a short time. How long lasting the effects will be no one can tell right now. The economy has been largely shut down and remains so today. It takes time to restart the economy after a situation such as what is occurring at the present time.

Given these events and the rapidly deteriorating situation, as I said last week, I would caution not to panic. The economy and the markets will get better. The situation is bad – there is no doubt about that – but it will turn around. The real question is when will it turn around? No one knows that at the present time. But it will turn around.

For now, review your investment portfolios. It is highly likely that all or most of your stocks are down. You should not consider selling the bulk of your stocks – only consider selling companies that are not sound companies. But do recognize that as the economy deteriorates, even good companies will be affected.

For stock market value hunters, we believe it is still too early to jump back in. We will be closely monitoring the markets using the many tools and models that we have developed over the years to assess the economy and the markets. We will use our best judgement and thoughts to let you know when we believe things are turning around. The turnaround hasn’t happened yet.

We believe it is important to maintain a long-term view toward investing. But for now, just sit tight. Eventually, this means that you should continue building your investment portfolio using the Cassandra Stock Selection Model to select individual securities that offer growth and value opportunities.

Chart for Review and Thought

S & P 500

Simple and Effective Economic Forecasting Model

Note: The table and chart below have not been updated. However, we believe that a recession is quite likely. In the chart below, the bottom green line shows what a recession could look like.

Notes (GDP Growth Chart):

  1. See the July 8, 2019 Commentary for an introduction to this model.
  2. Actual numbers 2007 through 2019; forecasted numbers thereafter.
  3. Normal GDP growth is typically in the 2% to 3% range.
  4. A recession is generally defined as two consecutive quarters of negative economic growth as measured by a country’s gross domestic product (GDP).

Thought for the Week

“Teamwork is the ability to work together toward a common vision. The ability to direct individual accomplishments toward organizational objectives. It is the fuel that allows common people to attain uncommon results.” –Andrew Carnegie

Announcements

The Intrinsic Value Wealth Report has started a new YouTube channel called Intrinsic Value Wealth Report TV. You can view the YouTube channel at Intrinsic Value Wealth Report TV.

The Intrinsic Value Wealth Report has started a new podcast called Intrinsic Value Wealth Report Radio. You can listen to the podcast at Intrinsic Value Wealth Report Radio.

Dr. Wendee spoke at the Investment Club of America’s annual economic summit, called Econosummit, on Sunday March 1, 2020 in Las Vegas.

Dr. Wendee attended the The National Due Diligence Alliance (TNDDA) investment banking conference, which was held March 6-8, 2020 at the Four Seasons Resort in Dallas, Texas. This is a conference held several times throughout the year for investment bankers and registered investment advisers to learn about new opportunities in the Alternative Investment asset classes.

TNDDA Meeting in Dallas, Texas

We have been researching the use of crowdsourcing for investment ideas. We will be sending a survey out in the next few weeks to get your input on the economy and the markets; and to get any investment ideas that you would like to share. We will compile this input and distribute the results to you and our other subscribers. We have been testing our crowdsourcing models with students and have been having good success and results.

Dr. Wendee has been researching and writing a new theory of economics known as, The Value Creation Theory of the Economy (also known as, Intrinsinomics). The full paper on Intrinsinomics will be published in the near future.

Finance 3350: Personal Finance-Portfolio & Risk Management– Dr. Wendee started teaching Finance 3350 – Portfolio & Risk Management at California State University, Los Angeles (CSULA) for the Summer term starting May 2020. Dr. Wendee teaches courses in Management and Finance at CSULA.

Business 548: Strategy and Decision Making – Dr. Wendee will be teaching Business 548 – Strategy and Decision Making at California Baptist University (CBU) starting at the end of June 2020. Dr. Wendee teaches courses in Finance, Business, Strategy & Decision Making, and Economics at CBU.

Dr. Wendee presented a paper on his new theory of economics known as, The Value Creation Theory of the Economy (also known as, Intrinsinomics), at the International Leadership Association’s annual global conference which was held in Ottawa, Canada last Fall.

Dr. Wendee will present an updated paper on his new theory of economics known as, The Value Creation Theory of the Economy (also known as, Intrinsinomics), at the International Leadership Association’s annual global conference which will be held in San Francisco, California in November.

Dr. Wendee is working on a financial planning modeling program which will be available in the near future. The modeling program is designed to assist anyone in creating a financial plan and is customizable for each person’s unique financial planning goals. A working draft of the model is currently in beta test with students. Click this link, schematic, to go to the clickable document under the subheading Financial Planning Process (Draft) in the Intrinsic Value Wealth Report to see a draft of the schematic for the new financial planning process.

Dr. Wendee has been developing an econometric model specifically designed to monitor and forecast the global economy as this current economic crisis unfolds. This new econometric model is based on other econometric models that he has designed and have used for many years. You can find some of these earlier models in Book # 6 – Simple and Effective Economic Forecasting in the sister website to this website which is called the Intrinsic Value Wealth Report. The new econometric model has been constructed with some additional tools and methods that he has learned and some that he has developed over the last several years. He will be talking more about this new econometric model in this Commentary over the next few months. His comments and forecasts on the economy and the markets going forward will be based to a significant extent on this new model.

We have begun raising capital for our fund-of-funds investment, Northwest Quadrant Opportunity Fund, LLC. The fund engineers and constructs an investment vehicle consisting of Alternative Asset investments. The fund’s objective is to build a diversified portfolio of strong, solid, steady- performing assets, with highly qualified asset managers who have proven track records that meet our underwriting requirements. To learn more about the Northwest Quadrant Opportunity Fund, LLC and to obtain an offering memorandum, please click Northwest Quadrant Opportunity Fund, LLC.

Intrinsic Value Wealth Creation pyramid

We always conclude our commentary with a discussion of the Intrinsic Value Wealth Creation Pyramid. The Intrinsic Value Wealth Creation Pyramid is designed to show some of the major categories for building wealth. It is the result of many years of study of the wealth building process; experience working with clients who have built considerable wealth; and my own personal experience building wealth. Newsletter subscribers should consult the Intrinsic Value Wealth Creation Pyramid as one of many useful investment tools while considering their investment plans.

The chart in this section is an expanded version of the Intrinsic Value Wealth Creation Pyramid Chart referenced in the Forbes.com article entitled, Nine Of The Best Ways To Build Wealth.

RESOURCES

See our Resources section for links to economic and other resources used in the preparation of this Commentary.

Posted in Economic & Business Chart Room, Economic Outlook, Entrepreneurship, Focus List, Investment Recommendations, Investments, Notes From The Field, Special Situations, Uncategorized, VDI/REEP, Visionary Ideas | Tagged , , , , , , , , , , , , , , , , , , , , , , , , , , , , , , , , , | Comments Off on WEEKLY COMMENTARY August 3, 2020