WEEKLY COMMENTARY July 22, 2019

FreedomFest

Dr. Paul was a moderator on two panels and spoke on a third panel at FreedomFest this past week.

The first panel he spoke on was a discussion of a film on the broken U.S. patent system. The panel was called, “Out of our own Minds: Do Patents Foster Innovation or Kill It?” The film was titled, “Invalidated.” Besides Dr. Paul, the other panelists were Jenny Beth Martin, co-founder of Tea Party Patriots Action which formed the beginning of the Tea Party Movement; Luke Livingston, the Director of the movie “Invalidated”; and George Gilder, the well-known investor, writer, economist, techno-utopian advocate, Republican Party activist, and co-founder of the Discovery Institute.

For his second panel, which he moderated, Dr. Paul was joined by Jeff Barnes, CEO of Angel Investor Network and Neil Dikeman, a fund manager and Libertarian US Senate Nominee for Texas in 2018. The title of their discussion was: “It’s Capital! How to Succeed with Venture Capital for Your Business.”

The third panel, which Dr. Paul also moderated, consisted of four well-know investors: Louis Navellier, Peter Schiff, Alex Green, and Doug Casey. The title of their panel, which was a discussion of investing in the current market climate, was: “Ridin’ the Bull, Huntin’ the Bear.”

Recordings of these three panels are available.

FreedomFest at the Paris Hotel in Las Vegas

Economic and Investment Highlights

Last Week

China is expected to roll out more incentives to get businesses and consumers spending as its economic growth continues to slow.

Hispanics are experiencing the largest home ownership gains of any ethnic group in the U.S. They were previously the hardest hit ethnic group in the housing bust.

Consumption spending and factory production both increased in June.

The White House and Congress agreed on overall spending levels and raising the debt ceiling. But talks continue on how to fund the spending agreement. The federal budget deficit is expected to grow to over $1 trillion dollars during the Trump administration.

The House passed a bill to increase the federal minimum wage to $15 per hour by 2025. It is not expected to see a vote in the Senate and is opposed by the White House. While a Congressional Budget Office study showed it could lift 1.3 million people out of poverty, the same study also showed that 1.3 million people could lose their jobs. The current federal minimum wage is $7.25.

The Fed again signaled that it is prepared to lower interest rates by a quarter of a percentage point.

The biggest tech companies are propelling the major U.S. indexes higher. Microsoft, Apple, Amazon, and Facebook together accounted for about one-fifth of the gain in the S&P 500 this year. This is in line with similar results in 2017 and 2018.

Tax rates at many public companies have fallen as a result of the tax overhaul.

The Dow Jones Industrial Average, the S&P 500 and the Nasdaq all fell last week, 0.7% for the Dow, 1.23% for the S&P 500 and 1.2% for the Nasdaq. The 10-year treasury yield ended the week at 2.048%.

The Week Ahead

This link takes you to Econoday’s Economic Calendar and Economic Events and Analysis which shows the upcoming economic reporting events scheduled in the week and months ahead.

Summary

Note: The comments that follow are derived from the economic indicators referenced in the Resources section of this newsletter and other sources in this report.

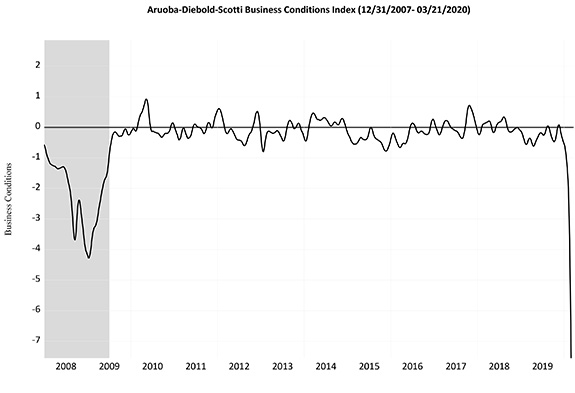
The Aruoba-Diebold-Scotti Business Conditions Index (ALS) has been trending up the last several weeks and has now crossed over the zero line into positive territory. The ALS Index rose slightly this past week. This is a very positive indicator for the economy on a short-term basis.

The GDPNow model estimate for real GDP growth (seasonally adjusted annual rate) in the second quarter of 2019 is n/a. This slight adjustment continues to support the ALS model assessment of an improving short-term economic environment.

The New York Fed Staff Nowcast stands at 1.5% for 2019:Q2 and 1.8% for 2019:Q3.

The Chicago Fed National Activity Index (CFNAI) showed an increase in economic activity in May. The Chicago Fed National Activity Index (CFNAI) was –0.05 in May, up from –0.48 in April.

All told, these short-term economic indicators are a neutral to positive analysis for the economy, at least on a short-term basis.

Expectations that stock prices will rise over the next six months rose this past week and is now at n/a, an unusually low level, in the latest AAII Sentiment Survey. The historical average is 38.5% for the survey. Please see the AAII Sentiment Survey for the complete results.

The latest Gross output (GO) reading suggests slow economic growth as we enter 2019.

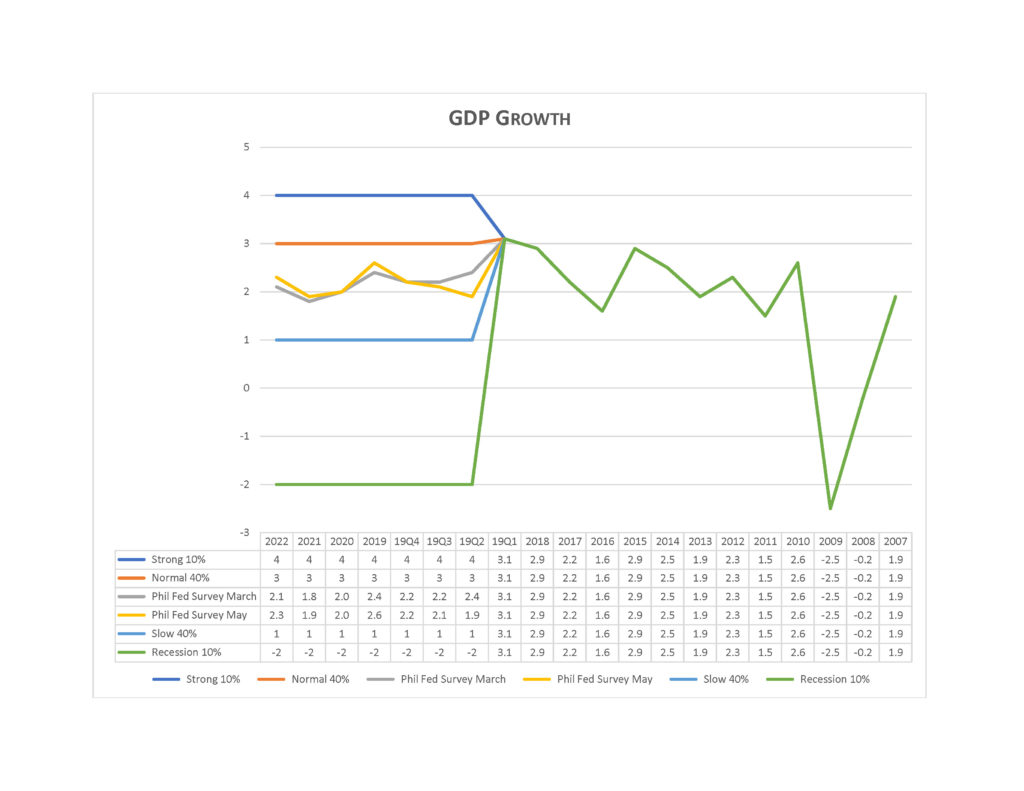
On a longer-term basis, the forecasters in the Philadelphia Fed’s Survey of Professional Forecasters (as of May 10, 2019) predict real GDP will grow at an annual rate of 1.9 percent this quarter and 2.1 percent next quarter. On an annual-average over annual-average basis, the forecasters predict real GDP to grow 2.6 percent in 2019, 2.0 percent in 2020, 1.9 percent in 2021 and 2.3 percent in 2022. The forecasters predict the unemployment rate will average 3.7 percent in 2019, 3.6 percent in 2020, 3.7 percent in 2021, and 3.9 percent in 2022.

For a more in-depth review and analysis of the economy, please see our mini-book on economic analysis and forecasting entitled: Simple and Effective Economic Forecasting.

Stock Market Valuations

Our estimates of the market valuations for two stock market indices, the Dow Jones Industrial Average (DJIA) and the Standard & Poor’s 500 (S&P 500), can be found in the file below:

Conclusion

We continue to believe the economy is in a stable but now more vulnerable state. Recent economic reports have been showing signs of weakening. Nonetheless, the economy has remained fairly strong. In fact, the extremely strong first quarter GDP showing and the strong labor market conditions still give us confidence that the economy, now in its tenth year of expansion, can continue to grow. But we are cautious on this outlook! Please see our complete Economic and Investment Review in the Spring 2019 quarterly issue of the Intrinsic Value Wealth Report Newsletter.

The broad market remains overvalued, although the Dow Jones Industrial Average looks more fairly valued than the broad market. But that does not mean that a market correction is imminent. Markets can and do stay overvalued for long periods of time. As discussed above and in the Economic and Investment Highlights section of this Commentary, we believe the economy is in a stable but vulnerable state that is showing signs of weakening. If the economy remains strong, the markets will likely remain strong. If the economy deteriorates, the markets may well correct. There are other events that could trigger a market correction, of course, but economic conditions are the most likely and foreseeable events that could make that happen.

We believe it is important to maintain a long-term view toward investing. This means that you should continue building your investment portfolio using the Cassandra Stock Selection Model to select individual securities that offer growth and value opportunities.

Chart for Review and Thought
Inverted Yield Curve

Simple and Effective Economic Forecasting Model

Notes (GDP Growth Chart):

  1. See the July 8, 2019 Commentary for an introduction to this model.
  2. Actual numbers 2007 through Q1 2019; forecasted numbers thereafter.
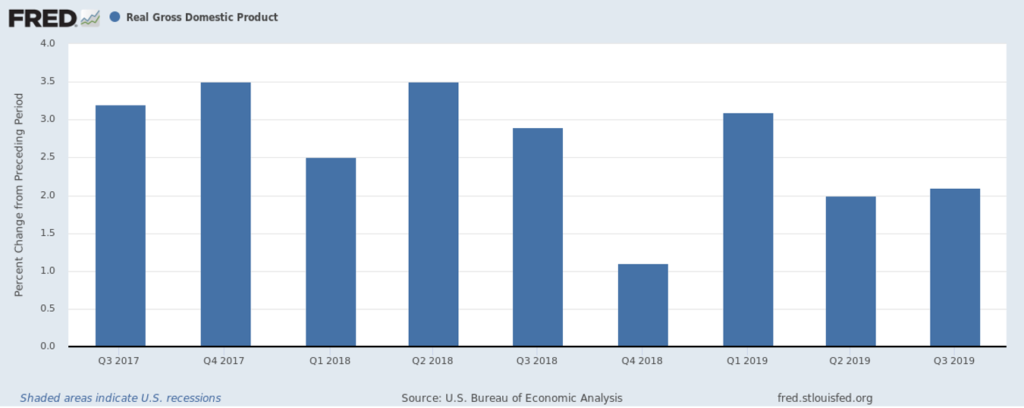
  3. Normal GDP growth is typically in the 2% to 3% range.
  4. A recession is generally defined as two consecutive quarters of negative economic growth as measured by a country’s gross domestic product (GDP).

Announcements

We have been researching the use of crowdsourcing for investment ideas. We will be sending a survey out in the next few weeks to get your input on the economy and the markets; and to get any investment ideas that you would like to share. We will compile this input and distribute the results to you and our other subscribers.

Dr. Paul spoke at FreedomFest during its annual conference in Las Vegas, July 17 – 20, 2019. Please see above for a summary of his panels.

Business 539 – Financial Management – On July 1, 2019, Dr. Wendee started teaching Business 539 – Financial Management at California Baptist University (CBU). Dr. Wendee teaches courses in Finance and Economics at CBU.

Management 3080 – Business Responsibility in Society – Dr. Wendee will be teaching Management 3080 – Business Responsibility in Society at California State University, Los Angeles (CSULA) starting August 22, 2019. Dr. Wendee teaches courses in Management at CSULA.

Business 217 – Microeconomics – Dr. Wendee will be teaching Business 217 – Microeconomics at California Baptist University (CBU) starting September 4, 2019. Dr. Wendee teaches courses in Finance and Economics at CBU.

Business 218 – Macroeconomics – Dr. Wendee will be teaching Business 218 – Macroeconomics at California Baptist University (CBU) starting September 4, 2019. Dr. Wendee teaches courses in Finance and Economics at CBU.

Dr. Wendee will be presenting a paper on enterprise value creation at the International Leadership Association’s annual global conference which is being held in Ottawa, Canada this Fall.

Intrinsic Value Wealth Creation pyramid

We always conclude our commentary with a discussion of the Intrinsic Value Wealth Creation Pyramid. The Intrinsic Value Wealth Creation Pyramid is designed to show some of the major categories for building wealth. It is the result of many years of study of the wealth building process; experience working with clients who have built considerable wealth; and my own personal experience building wealth. Newsletter subscribers should consult the Intrinsic Value Wealth Creation Pyramid as one of many useful investment tools while considering their investment plans.

The chart in this section is an expanded version of the Intrinsic Value Wealth Creation Pyramid Chart referenced in the Forbes.com article entitled, Nine Of The Best Ways To Build Wealth.

RESOURCES

See our Resources section for links to economic and other resources used in the preparation of this Commentary.

Posted in Economic & Business Chart Room, Economic Outlook, Entrepreneurship, Focus List, Investment Recommendations, Investments, Notes From The Field, Special Situations, Uncategorized, VDI/REEP, Visionary Ideas | Tagged , , , , , , , , , , , , , , , , , , , , , , , , | Comments Off on WEEKLY COMMENTARY July 22, 2019

WEEKLY COMMENTARY July 15, 2019

Rising Yield Spread Signals Caution for the Economy

In yet another troubling sign for the health of the economy, investors have been selling junk bonds raising the rate that those bonds must pay to attract new investors. Since March, the extra yield over safe government bonds that triple-C rated corporate debt must pay has risen 0.64 percent versus a decline of 0.09 percent in extra yield for higher ranked B-rated bonds.

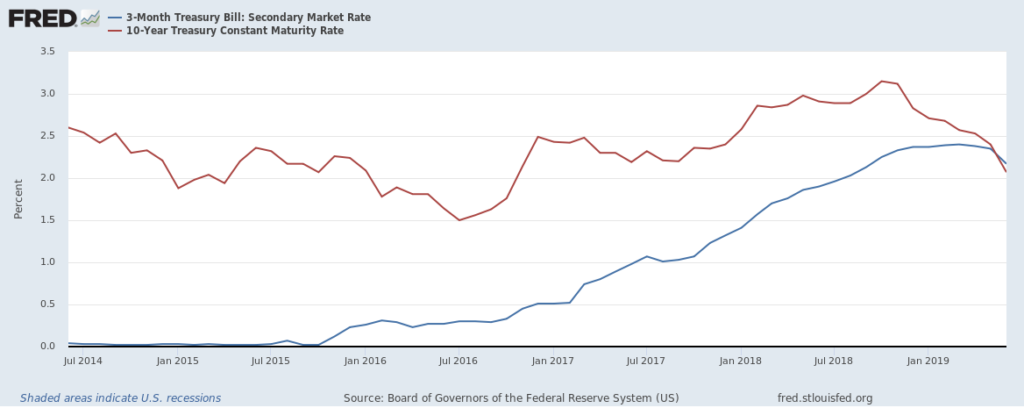
Rising junk bond yields is often an indicator of deteriorating economic health. At the same time, the inverted yield curve (see chart below) that we discussed in our July 1, 2019 Commentary signals a possible recession. Taken together, both the rising yield spread and the inverted yield curve are a strong cautionary signal on the overall health of the economy.

Economic and Investment Highlights

Last Week

U.S. investment funds, which typically represent individual investors, have bought this year 54% of the new government notes and bonds sold at auction through May 31.

Large IPOs, those valued at $10 billion or more, have set a record in the first half of this year for the most number of large IPOs since the dot.com boom of 2000.

Richard Branson’s Virgin Galactic plans to go public later this year making it the first publicly listed human spaceflight company.

Federal Reserve Chairman Jerome Powell signaled that the Fed may cut interest rates this month. In his testimony on Capitol Hill on Wednesday Powell cited slower global growth, trade tensions, and weak inflation as reasons for a possible rate cut. Despite these concerns, the labor market and consumer spending have remained strong.

U.S. manufacturers are increasingly shifting production out of China.

Corporate earnings are forecast to decline by 3% from a year earlier in this reporting season. So far, more than 80 S&P 500 companies have warned that their second quarter results will be weaker than initially expected.

It is reported that more than a dozen European junk bonds offer negative yields. Normally, junk bonds offer very high yields.

The S&P 500 closed above the 3,000 level for the first time on Friday. The Dow closed above the 27,000 level for the first time on Thursday. The Dow Jones Industrial Average, the S&P 500 and the Nasdaq all rose slightly for the week, 1.5% for the Dow, 0.78% for the S&P 500 and 1.0% for the Nasdaq. The 10-year treasury yield ended the week at 2.106%.

The Week Ahead

This link takes you to Econoday’s Economic Calendar and Economic Events and Analysis which shows the upcoming economic reporting events scheduled in the week and months ahead.

Summary

Note: The comments that follow are derived from the economic indicators referenced in the Resources section of this newsletter and other sources in this report.

The Aruoba-Diebold-Scotti Business Conditions Index (ALS) has been trending up the last several weeks and has now crossed over the zero line into positive territory. The ALS Index was relatively flat this past week. This is a very positive indicator for the economy on a short-term basis.

The GDPNow model estimate for real GDP growth (seasonally adjusted annual rate) in the second quarter of 2019 is 1.6 percent. This slight adjustment continues to support the ALS model assessment of an improving short-term economic environment.

The New York Fed Staff Nowcast stands at 1.5% for 2019:Q2 and 1.8% for 2019:Q3.

The Chicago Fed National Activity Index (CFNAI) showed an increase in economic activity in May. The Chicago Fed National Activity Index (CFNAI) was –0.05 in May, up from –0.48 in April.

All told, these short-term economic indicators are a neutral to positive analysis for the economy, at least on a short-term basis.

Expectations that stock prices will rise over the next six months rose this past week and is now at 33.6%, an unusually low level, in the latest AAII Sentiment Survey. The historical average is 38.5% for the survey. Please see the AAII Sentiment Survey for the complete results.

The latest Gross output (GO) reading suggests slow economic growth as we enter 2019.

On a longer-term basis, the forecasters in the Philadelphia Fed’s Survey of Professional Forecasters (as of May 10, 2019) predict real GDP will grow at an annual rate of 1.9 percent this quarter and 2.1 percent next quarter. On an annual-average over annual-average basis, the forecasters predict real GDP to grow 2.6 percent in 2019, 2.0 percent in 2020, 1.9 percent in 2021 and 2.3 percent in 2022. The forecasters predict the unemployment rate will average 3.7 percent in 2019, 3.6 percent in 2020, 3.7 percent in 2021, and 3.9 percent in 2022.

For a more in-depth review and analysis of the economy, please see our mini-book on economic analysis and forecasting entitled: Simple and Effective Economic Forecasting.

Stock Market Valuations

Our estimates of the market valuations for two stock market indices, the Dow Jones Industrial Average (DJIA) and the Standard & Poor’s 500 (S&P 500), can be found in the file below:

Conclusion

We continue to believe the economy is in a stable but now more vulnerable state. Recent economic reports have been showing signs of weakening. Nonetheless, the economy has remained fairly strong. In fact, the extremely strong first quarter GDP showing and the strong labor market conditions still give us confidence that the economy, now in its tenth year of expansion, can continue to grow. But we are cautious on this outlook! Please see our complete Economic and Investment Review in the Spring 2019 quarterly issue of the Intrinsic Value Wealth Report Newsletter.

The broad market remains overvalued, although the Dow Jones Industrial Average looks more fairly valued than the broad market. But that does not mean that a market correction is imminent. Markets can and do stay overvalued for long periods of time. As discussed above and in the Economic and Investment Highlights section of this Commentary, we believe the economy is in a stable but vulnerable state that is showing signs of weakening. If the economy remains strong, the markets will likely remain strong. If the economy deteriorates, the markets may well correct. There are other events that could trigger a market correction, of course, but economic conditions are the most likely and foreseeable events that could make that happen.

We believe it is important to maintain a long-term view toward investing. This means that you should continue building your investment portfolio using the Cassandra Stock Selection Model to select individual securities that offer growth and value opportunities.

Chart for Review and Thought
Inverted Yield Curve

Simple and Effective Economic Forecasting Model

Notes (GDP Growth Chart):

  1. See the July 8, 2019 Commentary for an introduction to this model.
  2. Actual numbers 2007 through Q1 2019; forecasted numbers thereafter.
  3. Normal GDP growth is typically in the 2% to 3% range.
  4. A recession is generally defined as two consecutive quarters of negative economic growth as measured by a country’s gross domestic product (GDP).

Announcements

We have been researching the use of crowdsourcing for investment ideas. We will be sending a survey out in the next few weeks to get your input on the economy and the markets; and to get any investment ideas that you would like to share. We will compile this input and distribute the results to you and our other subscribers.

Dr. Wendee will be speaking at FreedomFest during its annual conference in Las Vegas, July 17 – 20, 2019.

Business 539 – Financial Management – On July 1, 2019, Dr. Wendee started teaching Business 539 – Financial Management at California Baptist University (CBU). Dr. Wendee teaches courses in Finance and Economics at CBU.

Management 3080 – Business Responsibility in Society – Dr. Wendee will be teaching Management 3080 – Business Responsibility in Society at California State University, Los Angeles (CSULA) starting August 22, 2019. Dr. Wendee teaches courses in Management at CSULA.

Business 217 – Microeconomics – Dr. Wendee will be teaching Business 217 – Microeconomics at California Baptist University (CBU) starting September 4, 2019. Dr. Wendee teaches courses in Finance and Economics at CBU.

Business 218 – Macroeconomics – Dr. Wendee will be teaching Business 218 – Macroeconomics at California Baptist University (CBU) starting September 4, 2019. Dr. Wendee teaches courses in Finance and Economics at CBU.

Dr. Wendee will be presenting a paper on enterprise value creation at the International Leadership Association’s annual global conference which is being held in Ottawa, Canada this Fall.

Intrinsic Value Wealth Creation pyramid

We always conclude our commentary with a discussion of the Intrinsic Value Wealth Creation Pyramid. The Intrinsic Value Wealth Creation Pyramid is designed to show some of the major categories for building wealth. It is the result of many years of study of the wealth building process; experience working with clients who have built considerable wealth; and my own personal experience building wealth. Newsletter subscribers should consult the Intrinsic Value Wealth Creation Pyramid as one of many useful investment tools while considering their investment plans.

The chart in this section is an expanded version of the Intrinsic Value Wealth Creation Pyramid Chart referenced in the Forbes.com article entitled, Nine Of The Best Ways To Build Wealth.

RESOURCES

See our Resources section for links to economic and other resources used in the preparation of this Commentary.

Posted in Economic & Business Chart Room, Economic Outlook, Entrepreneurship, Focus List, Investment Recommendations, Investments, Notes From The Field, Special Situations, Uncategorized, VDI/REEP, Visionary Ideas | Tagged , , , , , , , , , , , , , , , , , , , , , , , , | Comments Off on WEEKLY COMMENTARY July 15, 2019

WEEKLY COMMENTARY July 8, 2019

Tracking and Forecasting the Economy – Introducing a New Tool for This Newsletter

Please click the link below for the article entitled, A Simple and Effective Economic Forecasting Model. We are introducing the forecasting approach described in this article as a new feature of the Intrinsic Value Wealth Report Newsletter. This economic forecasting model will make it easy for you to track current economic events and enable you to make an informed judgement on the state of and future direction of the economy. Dr. Wendee developed this tool in 2003 and published an article about it in a sister magazine of a well-known institutional investment publication.

A Simple & Effective Economic Forecasting Model White Paper

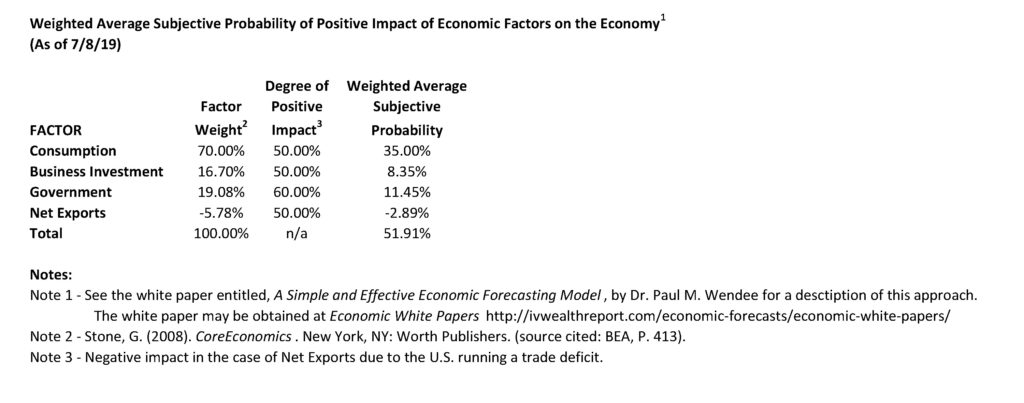
The current analysis of the economy using the Simple and Effective Forecasting model is shown below (see Charts for Review and Thought). A Weighted Average Subjective Probability score of 51.91% indicates a vulnerable economy that likely is facing a period of slow to moderate growth in the coming quarters.

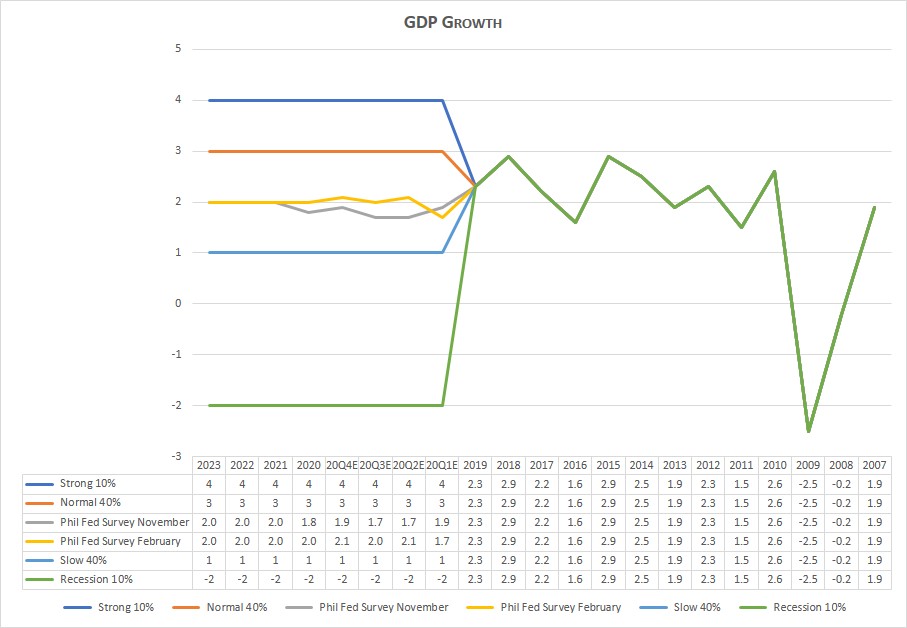
The second chart under Charts for Review and Thought shows the U.S. Gross Domestic Product (GDP) from 2007 to 2019 Q1 with estimates for GDP through 2022.

Economic and Investment Highlights

Last Week

Demand for rental apartments reached a five-year high.

OPEC agreed to extend its output cuts into the first quarter of 2010.

The Institute for Supply Management reported a drop in manufacturing activity as reflected in its manufacturing index declining to 51.7 in June from 52.1 in May. Readings below 50 indicate contraction in manufacturing activity. This is largely the result of slowing global growth and trade tensions.

U.S. new vehicle sales slowed in the first half of the year. This trend is expected to continue.

The U.S. trade gap increased in May 8.4% from April due to rising imports and weak exports.

U.S. employers added 224,000 jobs in June. This was viewed as a strong jobs report. At the same time, more people joined the labor force causing a slight upward adjustment in the unemployment rate. Pay is generally increasing, but not at the strong pace that many economists would expect this far into an economic upcycle. Overall, the jobs report was viewed positively, but does give rise to concern that the Fed may not cut interest rates in the near term by much if at all.

The Dow Jones Industrial Average, the S&P 500 and the Nasdaq all rose slightly for the week, 1.2% for the Dow, 1.65% for the S&P 500 and 1.9% for the Nasdaq. The 10-year treasury yield ended the week at 2.044%.

The Week Ahead

This link takes you to Econoday’s Economic Calendar and Economic Events and Analysis which shows the upcoming economic reporting events scheduled in the week and months ahead.

Summary

Note: The comments that follow are derived from the economic indicators referenced in the Resources section of this newsletter and other sources in this report.

The Aruoba-Diebold-Scotti Business Conditions Index (ALS) has been trending up the last several weeks and has now crossed over the zero line into positive territory. The ALS Index advanced slightly again this past week. This is a very positive indicator for the economy on a short-term basis.

The GDPNow model estimate for real GDP growth (seasonally adjusted annual rate) in the second quarter of 2019 is 1.3 percent on July 3, down from 1.5% on June 28. This slight adjustment continues to support the ALS model assessment of an improving short-term economic environment.

The New York Fed Staff Nowcast stands at 1.5% for 2019:Q2 and 1.7% for 2019:Q3.

The Chicago Fed National Activity Index (CFNAI) showed an increase in economic activity in May. The Chicago Fed National Activity Index (CFNAI) was –0.05 in May, up from –0.48 in April.

All told, these short-term economic indicators are a neutral to positive analysis for the economy, at least on a short-term basis.

Expectations that stock prices will rise over the next six months rose this past week and is now at 29.6%, an unusually low level, in the latest AAII Sentiment Survey. The historical average is 38.5% for the survey. Please see the AAII Sentiment Survey for the complete results.

The latest Gross output (GO) reading suggests slow economic growth as we enter 2019.

On a longer-term basis, the forecasters in the Philadelphia Fed’s Survey of Professional Forecasters (as of May 10, 2019) predict real GDP will grow at an annual rate of 1.9 percent this quarter and 2.1 percent next quarter. On an annual-average over annual-average basis, the forecasters predict real GDP to grow 2.6 percent in 2019, 2.0 percent in 2020, 1.9 percent in 2021 and 2.3 percent in 2022. The forecasters predict the unemployment rate will average 3.7 percent in 2019, 3.6 percent in 2020, 3.7 percent in 2021, and 3.9 percent in 2022.

For a more in-depth review and analysis of the economy, please see our mini-book on economic analysis and forecasting entitled: Simple and Effective Economic Forecasting.

Stock Market Valuations

Our estimates of the market valuations for two stock market indices, the Dow Jones Industrial Average (DJIA) and the Standard & Poor’s 500 (S&P 500), can be found in the file below:

Conclusion

We continue to believe the economy is in a stable but now more vulnerable state. Recent economic reports have been showing signs of weakening. Nonetheless, the economy has remained fairly strong. In fact, the extremely strong first quarter GDP showing and the strong labor market conditions still give us confidence that the economy, now in its tenth year of expansion, can continue to grow. But we are cautious on this outlook! Please see our complete Economic and Investment Review in the Winter 2019 quarterly issue of the Intrinsic Value Wealth Report Newsletter.

The broad market remains overvalued, although the Dow Jones Industrial Average looks more fairly valued than the broad market. But that does not mean that a market correction is imminent. Markets can and do stay overvalued for long periods of time. As discussed above and in the Economic and Investment Highlights section of this Commentary, we believe the economy is in a stable but vulnerable state that is showing signs of weakening. If the economy remains strong, the markets will likely remain strong. If the economy deteriorates, the markets may well correct. There are other events that could trigger a market correction, of course, but economic conditions are the most likely and foreseeable events that could make that happen.

We believe it is important to maintain a long-term view toward investing. This means that you should continue building your investment portfolio using the Cassandra Stock Selection Model to select individual securities that offer growth and value opportunities.

Chart for Review and Thought

Notes (GDP Growth Chart):

  1. Actual numbers 2007 through Q1 2019; forecasted numbers thereafter.
  2. Normal GDP growth is typically in the 2% to 3% range.
  3. A recession is generally defined as two consecutive quarters of negative economic growth as measured by a country’s gross domestic product (GDP).

Announcements

We have been researching the use of crowdsourcing for investment ideas. We will be sending a survey out in the next few weeks to get your input on the economy and the markets; and to get any investment ideas that you would like to share. We will compile this input and distribute the results to you and our other subscribers.

Dr. Wendee will be speaking at FreedomFest during its annual conference in Las Vegas, July 17 – 20, 2019.

Business 539 – Financial Management – On July 1, 2019, Dr. Wendee started teaching Business 539 – Financial Management at California Baptist University (CBU). Dr. Wendee teaches courses in Finance and Economics at CBU.

Management 3080 – Business Responsibility in Society – Dr. Wendee will be teaching Management 3080 – Business Responsibility in Society at California State University, Los Angeles (CSULA) starting August 22, 2019. Dr. Wendee teaches courses in Management at CSULA.

Business 217 – Microeconomics – Dr. Wendee will be teaching Business 217 – Microeconomics at California Baptist University (CBU) starting September 4, 2019. Dr. Wendee teaches courses in Finance and Economics at CBU.

Business 218 – Macroeconomics – Dr. Wendee will be teaching Business 218 – Macroeconomics at California Baptist University (CBU) starting September 4, 2019. Dr. Wendee teaches courses in Finance and Economics at CBU.

Dr. Wendee will be presenting a paper on enterprise value creation at the International Leadership Association’s annual global conference which is being held in Ottawa, Canada this Fall.

Intrinsic Value Wealth Creation pyramid

We always conclude our commentary with a discussion of the Intrinsic Value Wealth Creation Pyramid. The Intrinsic Value Wealth Creation Pyramid is designed to show some of the major categories for building wealth. It is the result of many years of study of the wealth building process; experience working with clients who have built considerable wealth; and my own personal experience building wealth. Newsletter subscribers should consult the Intrinsic Value Wealth Creation Pyramid as one of many useful investment tools while considering their investment plans.

The chart in this section is an expanded version of the Intrinsic Value Wealth Creation Pyramid Chart referenced in the Forbes.com article entitled, Nine Of The Best Ways To Build Wealth.

RESOURCES

See our Resources section for links to economic and other resources used in the preparation of this Commentary.

Posted in Economic & Business Chart Room, Economic Outlook, Entrepreneurship, Focus List, Investment Recommendations, Investments, Notes From The Field, Special Situations, Uncategorized, VDI/REEP, Visionary Ideas | Tagged , , , , , , , , , , , , , , , , , , , , , , , , | Comments Off on WEEKLY COMMENTARY July 8, 2019

WEEKLY COMMENTARY July 1, 2019

Risk-On, Risk-Off

The highly volatile market environment that has been with us for quite some time is characteristic of a phenomenon known as “risk-on, risk-off.” The risk-on, risk-off phenomenon is a market environment where investors flock to safe investments (risk-off) when they are worried about economic and market conditions; and conversely, run to riskier assets (risk-on) when they are optimistic about the investment climate. In reality, any given market environment exhibits this phenomenon as the market rises and falls; but this term is usually reserved for the highly volatile markets that we have been experiencing lately. In markets such as these, investors often switch back and forth between less risk and more risk on a daily basis.

Economic and Investment Highlights

Last Week

Bond yields across the globe have been falling amid concerns of a slowing economy. The 10-year U.S. Treasury fell below 2% the week before last, the first time since 2016, and ended last week at 2%. Currently, the yield curve has inverted with the 10-year Treasury yield below the 3-month Treasury Bill rate (see chart below in Charts for Review and Thought).

U.S. crude oil exports are surging as tensions rise in the Persian Gulf. OPEC officials said they expect to extend their oil production cuts into the second half of the year.

Markets have been exhibiting a “risk-on, risk-off” phenomenon where markets split into two broad categories that move together.

Fed Chairman Powell said the Fed is carefully monitoring the financial markets, the economy, and other factors to determine when the next interest rate move up or down may be warranted. Powell said the amount of tariffs against China and other countries is not currently large enough to pose a threat to the economy; but the Fed is watching for signs of “a loss of confidence or financial market reaction.”

The Conference Board’s index of consumer confidence fell to 121.5 in June from 131.3 in May. This was the lowest level since September 2017 and was attributed to trade tensions and a cooling jobs market.

As indicated by short positions on Bitcoin futures, hedge funds and large traders are betting heavily against Bitcoin. Small investors have largely taken the other side of the trade showing their optimism for the blockchain currency. Bitcoin had traded above $11,000 recently.

Gross Domestic Product (GDP) grew at a strong 3.1% pace in the first quarter of 2019. Consumer spending grew 0.9% in the first quarter, but that was a slower pace than the 2.5% pace in the fourth quarter of last year. Business investment, exports, and government spending all grew at a faster pace. These results reinforce our view that the economy is in a stable but vulnerable state. The Fed recently referred to this situation as “uncertainties” in the economic outlook.

The S&P 500 rose 3.8% in the second quarter; and has risen 17% so far this year. The Dow Jones Industrial Average, the S&P 500 and the Nasdaq all fell slightly for the week, 0.4% for the Dow, 0.29% for the S&P 500 and 0.3% for the Nasdaq. The 10-year treasury yield closed out the quarter at 2%.

The Week Ahead

This link takes you to Econoday’s Economic Calendar and Economic Events and Analysis which shows the upcoming economic reporting events scheduled in the week and months ahead.

Summary

Note: The comments that follow are derived from the economic indicators referenced in the Resources section of this newsletter and other sources in this report.

The Aruoba-Diebold-Scotti Business Conditions Index (ALS) has been trending up the last several weeks and is now very close to the zero line. The ALS Index advanced slightly again this past week. This is a very positive indicator for the economy on a short-term basis.

The GDPNow model estimate for real GDP growth (seasonally adjusted annual rate) in the second quarter of 2019 is 1.5 percent on July 1, unchanged from 1.5% on June 28. This slight adjustment continues to support the ALS model assessment of an improving short-term economic environment.

The New York Fed Staff Nowcast stands at 1.3% for 2019:Q2 and 1.2% for 2019:Q3.

The Chicago Fed National Activity Index (CFNAI) showed an increase in economic activity in May. The Chicago Fed National Activity Index (CFNAI) was –0.05 in May, up from –0.48 in April.

All told, these short-term economic indicators are a neutral to positive analysis for the economy, at least on a short-term basis.

Expectations that stock prices will rise over the next six months rose this past week and is now at 29.6%, an unusually low level, in the latest AAII Sentiment Survey. The historical average is 38.5% for the survey. Please see the AAII Sentiment Survey for the complete results.

The latest Gross output (GO) reading suggests slow economic growth as we enter 2019.

On a longer-term basis, the forecasters in the Philadelphia Fed’s Survey of Professional Forecasters (as of May 10, 2019) predict real GDP will grow at an annual rate of 1.9 percent this quarter and 2.1 percent next quarter. On an annual-average over annual-average basis, the forecasters predict real GDP to grow 2.6 percent in 2019, 2.0 percent in 2020, 1.9 percent in 2021 and 2.3 percent in 2022. The forecasters predict the unemployment rate will average 3.7 percent in 2019, 3.6 percent in 2020, 3.7 percent in 2021, and 3.9 percent in 2022.

For a more in-depth review and analysis of the economy, please see our mini-book on economic analysis and forecasting entitled: Simple and Effective Economic Forecasting.

Stock Market Valuations

Our estimates of the market valuations for two stock market indices, the Dow Jones Industrial Average (DJIA) and the Standard & Poor’s 500 (S&P 500), can be found in the file below:

Conclusion

We continue to believe the economy is in a stable but now more vulnerable state. Recent economic reports have been showing signs of weakening. Nonetheless, the economy has remained fairly strong. In fact, the extremely strong first quarter GDP showing and the strong labor market conditions still give us confidence that the economy, now in its tenth year of expansion, can continue to grow. But we are cautious on this outlook! Please see our complete Economic and Investment Review in the Winter 2019 quarterly issue of the Intrinsic Value Wealth Report Newsletter.

The broad market remains overvalued, although the Dow Jones Industrial Average looks more fairly valued than the broad market. But that does not mean that a market correction is imminent. Markets can and do stay overvalued for long periods of time. As discussed above and in the Economic and Investment Highlights section of this Commentary, we believe the economy is in a stable but vulnerable state that is showing signs of weakening. If the economy remains strong, the markets will likely remain strong. If the economy deteriorates, the markets may well correct. There are other events that could trigger a market correction, of course, but economic conditions are the most likely and foreseeable events that could make that happen.

We believe it is important to maintain a long-term view toward investing. This means that you should continue building your investment portfolio using the Cassandra Stock Selection Model to select individual securities that offer growth and value opportunities.

Chart for Review and Thought

Inverted Yield Curve

Announcements

We have been researching the use of crowdsourcing for investment ideas. We will be sending a survey out in the next few weeks to get your input on the economy and the markets; and to get any investment ideas that you would like to share. We will compile this input and distribute the results to you and our other subscribers.

Dr. Wendee will be speaking at FreedomFest during its annual conference in Las Vegas, July 17 – 20, 2019.

Business 539 – Financial Management – On July 1, 2019, Dr. Wendee started teaching Business 539 – Financial Management at California Baptist University (CBU). Dr. Wendee teaches courses in Finance and Economics at CBU.

Management 3080 – Business Responsibility in Society – Dr. Wendee will be teaching Management 3080 – Business Responsibility in Society at California State University, Los Angeles (CSULA) starting August 22, 2019. Dr. Wendee teaches courses in Management at CSULA.

Business 217 – Microeconomics – Dr. Wendee will be teaching Business 217 – Microeconomics at California Baptist University (CBU) starting September 4, 2019. Dr. Wendee teaches courses in Finance and Economics at CBU.

Business 218 – Macroeconomics – Dr. Wendee will be teaching Business 218 – Macroeconomics at California Baptist University (CBU) starting September 4, 2019. Dr. Wendee teaches courses in Finance and Economics at CBU.

Dr. Wendee will be presenting a paper on enterprise value creation at the International Leadership Association’s annual global conference which is being held in Ottawa, Canada this Fall.

Dr. Wendee spoke at the Investment Club of America (formerly the Las Vegas Investment Club) on June 24th at the Orleans Hotel in Las Vegas.  He spoke on the topic of his popular Forbes article, Nine of the Best Ways to Build Wealth.

Intrinsic Value Wealth Creation pyramid

We always conclude our commentary with a discussion of the Intrinsic Value Wealth Creation Pyramid. The Intrinsic Value Wealth Creation Pyramid is designed to show some of the major categories for building wealth. It is the result of many years of study of the wealth building process; experience working with clients who have built considerable wealth; and my own personal experience building wealth. Newsletter subscribers should consult the Intrinsic Value Wealth Creation Pyramid as one of many useful investment tools while considering their investment plans.

The chart in this section is an expanded version of the Intrinsic Value Wealth Creation Pyramid Chart referenced in the Forbes.com article entitled, Nine Of The Best Ways To Build Wealth.

RESOURCES

See our Resources section for links to economic and other resources used in the preparation of this Commentary.

Posted in Economic & Business Chart Room, Economic Outlook, Entrepreneurship, Focus List, Investment Recommendations, Investments, Notes From The Field, Special Situations, Uncategorized, VDI/REEP, Visionary Ideas | Tagged , , , , , , , , , , , , , , , , , , , , , , , , | Comments Off on WEEKLY COMMENTARY July 1, 2019

WEEKLY COMMENTARY June 24, 2019

How Much Would You Pay for Bitcoin?

How much would you pay for an ounce of gold? How much would you pay for an ounce of silver? More importantly, tell me why you would pay that price for an ounce of gold or silver. In other words, what is the intrinsic value of those assets?

This is a question I always ask my students in the finance and other classes I teach. I’ve asked the same question of experts in the trading of these assets. No one, not even the professionals, can tell me the intrinsic value of these assets. The reason is that these assets do not have an intrinsic value. Only financial assets such as stocks, real estate, and other investments that produce a cash flow stream have an intrinsic value. And without an intrinsic value, you don’t know if you are overpaying, underpaying, or paying just the right price for an asset. Finance textbooks discuss this concept at length. So does Warren Buffett in his Owner’s Manual for Berkshire Hathaway stock. In the Owner’s Manual, Buffett states: “Intrinsic value is an all-important concept that offers the only logical approach to evaluating the relative attractiveness of investments and businesses. Intrinsic value can be defined simply: It is the discounted value of the cash that can be taken out of a business during its remaining life.”

So how much would you pay for Bitcoin? It traded above $11,000 last week. Is Bitcoin overvalued, undervalued, or priced just right? The answer is: You don’t know! It is an asset like gold and silver that doesn’t have an intrinsic value.

Economic and Investment Highlights

Last Week

Bitcoin rose to $9,396.33 on Monday, its highest level in more than a year. Late Friday it had risen above $10,000 and by Saturday morning, it had traded above $11,000. Facebook announced plans to launch its own cryptocurrency.

In a further sign of concern over European economic growth, the president of the European Central Bank (ECB) said the ECB is considering new stimulus as early as July.

Presidents Trump and Xi agreed to meet in Japan this week during the G-20 summit to continue trade talks.

There are indications that the benefits from the 2017 Republican tax cut were temporary, representing a short-term boost to the economy rather than a long-term benefit. Employee bonuses have slowed in 2019; business orders for capital goods such as equipment have slowed since 2017; and new hiring has slowed to its lowest level since 2010. Overall, there is an increasing number of indications that economic growth is moderating to a more normal level from the very robust growth recorded in 2018.

The Fed left interest rates unchanged at its policy meeting on Wednesday but indicated that a rate cut would be considered if the economy falters. The Fed is now referring to “uncertainties” in the economic outlook.

The shares of Slack rose 49% to $38.62 from the IPO price of $26 on their first day of trading.

Manufacturing has been slowing in the U.S. and other key economies around the world. The purchasing managers index for U.S. manufacturing activity declined to 50.1 in June from 50.5 in May. This is the lowest level in almost a decade.  A reading above 50.0 indicates growth.

Existing home sales rose in May.

The Dow Jones Industrial Average, the S&P 500 and the Nasdaq all rose for the week, 2.4% for the Dow, 2.2% for the S&P 500 and 3.0% for the Nasdaq. Bond prices also rose, with the 10-year treasury yield declining to 2% for the first time since 2016.

The Week Ahead

This link takes you to Econoday’s Economic Calendar and Economic Events and Analysis which shows the upcoming economic reporting events scheduled in the week and months ahead.

Summary

Note: The comments that follow are derived from the economic indicators referenced in the Resources section of this newsletter and other sources in this report.

The Aruoba-Diebold-Scotti Business Conditions Index (ALS) has been trending up the last several weeks and is now very close to the zero line. The ALS Index advanced slightly again this past week. This is a very positive indicator for the economy on a short-term basis.

The GDPNow model estimate for real GDP growth (seasonally adjusted annual rate) in the second quarter of 2019 is 2.0 percent on June 18, down from 2.1% on June 14. This slight adjustment continues to support the ALS model assessment of an improving short-term economic environment.

The New York Fed Staff Nowcast stands at 1.4% for 2019:Q2 and 1.3% for 2019:Q3.

The Chicago Fed National Activity Index (CFNAI) showed an increase in economic activity in May. The Chicago Fed National Activity Index (CFNAI) was –0.05 in May, up from –0.48 in April.

All told, these short-term economic indicators are a neutral to positive analysis for the economy, at least on a short-term basis.

Expectations that stock prices will rise over the next six months rose this past week and is now at 29.5%, an unusually low level, in the latest AAII Sentiment Survey. The historical average is 38.5% for the survey. Please see the AAII Sentiment Survey for the complete results.

The latest Gross output (GO) reading suggests slow economic growth as we enter 2019.

On a longer-term basis, the forecasters in the Philadelphia Fed’s Survey of Professional Forecasters (as of May 10, 2019) predict real GDP will grow at an annual rate of 1.9 percent this quarter and 2.1 percent next quarter. On an annual-average over annual-average basis, the forecasters predict real GDP to grow 2.6 percent in 2019, 2.0 percent in 2020, 1.9 percent in 2021 and 2.3 percent in 2022. The forecasters predict the unemployment rate will average 3.7 percent in 2019, 3.6 percent in 2020, 3.7 percent in 2021, and 3.9 percent in 2022.

For a more in-depth review and analysis of the economy, please see our mini-book on economic analysis and forecasting entitled: Simple and Effective Economic Forecasting.

Stock Market Valuations

Our estimates of the market valuations for two stock market indices, the Dow Jones Industrial Average (DJIA) and the Standard & Poor’s 500 (S&P 500), can be found in the file below:

Conclusion

We continue to believe the economy is in a stable but now more vulnerable state. Recent economic reports have been showing signs of weakening. Nonetheless, the economy has remained fairly strong. In fact, the extremely strong first quarter GDP showing and the strong labor market conditions still give us confidence that the economy, now in its tenth year of expansion, can continue to grow. But we are cautious on this outlook! Please see our complete Economic and Investment Review in the Winter 2019 quarterly issue of the Intrinsic Value Wealth Report Newsletter.

With the market rising again this past week, the broad market remains overvalued, although the Dow Jones Industrial Average looks more fairly valued than the broad market. But that does not mean that a market correction is imminent. Markets can and do stay overvalued for long periods of time. As discussed above and in the Economic and Investment Highlights section of this Commentary, we believe the economy is in a stable but vulnerable state that is showing signs of weakening. If the economy remains strong, the markets will likely remain strong. If the economy deteriorates, the markets may well correct. There are other events that could trigger a market correction, of course, but economic conditions are the most likely and foreseeable events that could make that happen.

We believe it is important to maintain a long-term view toward investing. This means that you should continue building your investment portfolio using the Cassandra Stock Selection Model to select individual securities that offer growth and value opportunities.

Chart for Review and Thought

NYSE Bullish Percent Index

Announcements

We have been researching the use of crowdsourcing for investment ideas. We will be sending a survey out in the next few weeks to get your input on the economy and the markets; and to get any investment ideas that you would like to share. We will compile this input and distribute the results to you and our other subscribers.

Dr. Wendee will be speaking at the Las Vegas Investment Club on June 24th.  He will be speaking on the topic of his popular Forbes article, Nine of the Best Ways to Build Wealth. Please contact Mike Lathigee at mike@mikelathigee.com if you would like to attend.

Dr. Wendee will be speaking at FreedomFest during its annual conference in Las Vegas, July 17 – 20, 2019.Dr.

Business 539 – Financial Management – On May 9, 2019, Dr. Wendee started teachingBusiness 539 – Financial Management at California Baptist University (CBU). Dr. Wendee teaches courses in Finance and Economics at CBU.

Management 3080 – Business Responsibility in Society – Dr. Wendee will be teaching Management 3080 – Business Responsibility in Society at California State University, Los Angeles (CSULA) starting August 22, 2019. Dr. Wendee teaches courses in Management at CSULA.

Dr. Wendee will be presenting a paper on enterprise value creation at the International Leadership Association’s annual global conference which is being held in Ottawa, Canada this Fall.

Dr. Wendee attended AT&T’s SHAPE event at Warner Brothers Studio in Los Angeles last week. The SHAPE event explored topics such as 5G, AR and VR.

Intrinsic Value Wealth Creation pyramid

We always conclude our commentary with a discussion of the Intrinsic Value Wealth Creation Pyramid. The Intrinsic Value Wealth Creation Pyramid is designed to show some of the major categories for building wealth. It is the result of many years of study of the wealth building process; experience working with clients who have built considerable wealth; and my own personal experience building wealth. Newsletter subscribers should consult the Intrinsic Value Wealth Creation Pyramid as one of many useful investment tools while considering their investment plans.

The chart in this section is an expanded version of the Intrinsic Value Wealth Creation Pyramid Chart referenced in the Forbes.com article entitled, Nine Of The Best Ways To Build Wealth.

RESOURCES

See our Resources section for links to economic and other resources used in the preparation of this Commentary.

Posted in Economic & Business Chart Room, Economic Outlook, Entrepreneurship, Focus List, Investment Recommendations, Investments, Notes From The Field, Special Situations, Uncategorized, VDI/REEP, Visionary Ideas | Tagged , , , , , , , , , , , , , , , , , , , , , , , , | Comments Off on WEEKLY COMMENTARY June 24, 2019

WEEKLY COMMENTARY June 17, 2019

Is the Hot IPO Market Foretelling a Bust in the Bubble?

Is the hot IPO market once again a sign of a bubble?

Despite the disappointing IPO results of Uber and Lyft (both of which currently trade below their IPO prices), the tech IPO market has been relatively robust. As highlighted below, the IPOs of CrowdStrike and Chewy have been very successful so far, as has Fiverr International. All three of these trade 50% or more in excess of their IPO prices.

Slack Technologies is doing its IPO this week. Expectations are that it will be a very successful IPO. Technology IPOs conducted in 2019 are up 30% on average, with ten of the twenty-six IPOs up over 50% from their IPO prices (according to Dealogic). By comparison, the Nasdaq composite is up 18% in 2019. Overall, the IPO market is expected to set a record in terms of dollars raised this year.

But many of these hot IPO companies are posting huge operating losses. We have seen this before! And each time we do, it has preceded a bust in the prices of the asset bubble. Will we see it again? It is extremely likely we will see it again, and we are watching this situation very closely.

Economic and Investment Highlights

Last Week

West Texas Intermediate futures fell to $51.14 on the New York Mercantile Exchange on Wednesday, the lowest settlement level since January, over worries of global growth and fears of an oil glut.

CrowdStrike shares soured 71% in post-IPO trading on their first day of trading as a public company. Chewy shares rose 59% in its post-IPO trading.

U.S. inflation slowed in May with the Consumer Price Index (CPI) rising by only 1.8% from the previous year.

White House press secretary Sarah Sanders will leave her post at the end of June. While she is leaving on good terms with the White House, it nonetheless may create some instability in the White House, especially during the transition to her successor.

The U.S. is adamantly claiming that Iran was responsible for two attacks on fuel tankers in the Gulf of Oman. The U.S. believes Iran is trying to disrupt the flow of oil.

Retail sales rose 0.5% in May from April.

The Dow Jones Industrial Average, the S&P 500 and the Nasdaq rose for the week, 0.4% for the Dow, 0.5% for the S&P 500 and 0.7% for the Nasdaq.

The Week Ahead

This link takes you to Econoday’s Economic Calendar and Economic Events and Analysis which shows the upcoming economic reporting events scheduled in the week and months ahead.

Summary

Note: The comments that follow are derived from the economic indicators referenced in the Resources section of this newsletter and other sources in this report.

The Aruoba-Diebold-Scotti Business Conditions Index (ALS) has been trending up the last several weeks and is now very close to the zero line. The ALS Index advanced slightly again this past week. This is a very positive indicator for the economy on a short-term basis.

The GDPNow model estimate for real GDP growth (seasonally adjusted annual rate) in the second quarter of 2019 is 2.1 percent on June 14. This slight adjustment continues to support the ALS model assessment of an improving short-term economic environment.

The New York Fed Staff Nowcast stands at 1.0% for 2019:Q2 and 1.3% for 2019:Q3.

The Chicago Fed National Activity Index (CFNAI) showed a decline in economic activity in April. The Chicago Fed National Activity Index (CFNAI) was –0.45 in April, down from +0.05 in March. All told, these short-term economic indicators are a neutral to positive analysis for the economy, at least on a short-term basis.

All told, these short-term economic indicators are a neutral to positive analysis for the economy, at least on a short-term basis.

Expectations that stock prices will rise over the next six months is at 22.5%, an unusually low level, in the latest AAII Sentiment Survey. The historical average is 38.5% for the survey. Please see the AAII Sentiment Survey for the complete results.

The latest Gross output (GO) reading suggests slow economic growth as we enter 2019.

On a longer-term basis, the forecasters in the Philadelphia Fed’s Survey of Professional Forecasters (as of May 10, 2019) predict real GDP will grow at an annual rate of 1.9 percent this quarter and 2.1 percent next quarter. On an annual-average over annual-average basis, the forecasters predict real GDP to grow 2.6 percent in 2019, 2.0 percent in 2020, 1.9 percent in 2021 and 2.3 percent in 2022. The forecasters predict the unemployment rate will average 3.7 percent in 2019, 3.6 percent in 2020, 3.7 percent in 2021, and 3.9 percent in 2022.

For a more in-depth review and analysis of the economy, please see our mini-book on economic analysis and forecasting entitled: Simple and Effective Economic Forecasting.

Stock Market Valuations

Our estimates of the market valuations for two stock market indices, the Dow Jones Industrial Average (DJIA) and the Standard & Poor’s 500 (S&P 500), can be found in the file below:

Conclusion

We continue to believe the economy is in a stable but now more vulnerable state. Recent economic reports have been showing signs of weakening. Nonetheless, the economy has remained fairly strong. In fact, the extremely strong first quarter GDP showing and the strong labor market conditions still give us confidence that the economy, now in its tenth year of expansion, can continue to grow. But we are cautious on this outlook! Please see our complete Economic and Investment Review in the Winter 2019 quarterly issue of the Intrinsic Value Wealth Report Newsletter.

With the market rising again this past week, the broad market remains overvalued, although the Dow Jones Industrial Average looks more fairly valued than the broad market. But that does not mean that a market correction is imminent. Markets can and do stay overvalued for long periods of time. As discussed above and in the Economic and Investment Highlights section of this Commentary, we believe the economy is in a stable but vulnerable state that is showing signs of weakening. If the economy remains strong, the markets will likely remain strong. If the economy deteriorates, the markets may well correct. There are other events that could trigger a market correction, of course, but economic conditions are the most likely and foreseeable events that could make that happen.

We believe it is important to maintain a long-term view toward investing. This means that you should continue building your investment portfolio using the Cassandra Stock Selection Model to select individual securities that offer growth and value opportunities.

Chart for Review and Thought

Consumer Price Index for All Urban Consumers

Announcements

We have been researching the use of crowdsourcing for investment ideas. We will be sending a survey out in the next few weeks to get your input on the economy and the markets; and to get any investment ideas that you would like to share. We will compile this input and distribute the results to you and our other subscribers.

Dr. Wendee will be speaking at the Las Vegas Investment Club on June 24th.  He will be speaking on the topic of his popular Forbes article, Nine of the Best Ways to Build Wealth. Please contact Mike Lathigee at mike@mikelathigee.com if you would like to attend.

Dr. Wendee will be speaking at FreedomFest during its annual conference in Las Vegas, July 17 – 20, 2019.

Dr. Wendee was a judge at the FundingPost June PitchFest Events on June 11 & 13, 2019 in San Diego and Irvine. Click on this link for details on the event:
https://www.fundingpost.com/event/reg1.asp?event=433

Business 539 – Financial Management – On May 9, 2019, Dr. Wendee started teachingBusiness 539 – Financial Management at California Baptist University (CBU). Dr. Wendee teaches courses in Finance and Economics at CBU.

Management 3080 – Business Responsibility in Society – Dr. Wendee will be teaching Management 3080 – Business Responsibility in Society at California State University, Los Angeles (CSULA) starting August 22, 2019. Dr. Wendee teaches courses in Management at CSULA.

Dr. Wendee will be presenting a paper on enterprise value creation at the International Leadership Association’s annual global conference which is being held in Ottawa, Canada this Fall.

Dr. Wendee is attending the Institute for Portfolio Alternatives (IPA) conference at the Omni Hotel in Chicago this week.

IPA Conference at the Omni Hotel in Chicago

Intrinsic Value Wealth Creation pyramid

We always conclude our commentary with a discussion of the Intrinsic Value Wealth Creation Pyramid. The Intrinsic Value Wealth Creation Pyramid is designed to show some of the major categories for building wealth. It is the result of many years of study of the wealth building process; experience working with clients who have built considerable wealth; and my own personal experience building wealth. Newsletter subscribers should consult the Intrinsic Value Wealth Creation Pyramid as one of many useful investment tools while considering their investment plans.

The chart in this section is an expanded version of the Intrinsic Value Wealth Creation Pyramid Chart referenced in the Forbes.com article entitled, Nine Of The Best Ways To Build WealthI

RESOURCES

See our Resources section for links to economic and other resources used in the preparation of this Commentary.

Posted in Economic & Business Chart Room, Economic Outlook, Entrepreneurship, Focus List, Investment Recommendations, Investments, Notes From The Field, Special Situations, Uncategorized, VDI/REEP, Visionary Ideas | Tagged , , , , , , , , , , , , , , , , , , , , , , , , | Comments Off on WEEKLY COMMENTARY June 17, 2019

WEEKLY COMMENTARY June 10, 2019

Fed Considering Rate Cuts As Early As June

The Fed sees trade tensions as a risk to the U.S. economy. This is giving them pause in their current policy of holding rates steady. There are now signs of a weakening U.S. economy as well. As a result of these new developments, the Fed has begun deliberating the possibility of a rate cut as early as their June or July meetings.

The economy still remains strong, but as we have been saying in our Commentary and economic reports, the U.S. economy is fragile. The Fed has revised down its expectations for economic growth for this year to 2% from the 3% growth of last year. The Fed currently does not expect inflation to hit its 2% target this year.

Economic and Investment Highlights

Last Week

Tariffs and trade tensions are increasingly hurting U.S. industries in both higher costs to manufacturers and lower demand for U.S. products. Factories are on track for their weakest performance since 2016. Manufacturing job growth has slowed since late 2018. Manufacturing output has declined in three of the past four months. Manufacturing accounts for 11% of U.S. gross domestic product, down from 16% twenty years ago. The HIS Market survey of sentiment among U.S. purchasing managers hit a three-year low in May; while a survey of the Institute for Supply Management was at its lowest point since October 2016 in April.

Kevin Hassett, the chairman of the Council of Economic Advisors, is leaving his post. While he is leaving on good terms with the White House, it nonetheless may create some instability in U.S. economic policy, especially during the transition to his successor.

The Nasdaq dropped 1.6% on Monday, putting it in a correction.

The World Bank lowered its global growth forecast for 2019 to 2.6% from 2.9% in January.

U.S. crude futures declined into a bear market over worries of global growth and fears of an oil glut.

Central banks around the world have begun considering rate reductions over concerns of global economic slowing.

U.S. hiring slowed in May as companies are starting to have concerns about trade tensions, slowing global economic growth, and emerging strains on the U.S. economy.

Bond yields across the globe continued falling, reflecting concerns that global economic growth is slowing. The yield on the 10-year treasury came very close to 2% last week.

The. U.S. and Mexico resolved their dispute on immigration and the tariffs on Mexican imports were averted. Trump had threatened a 5% tariff on Mexican goods out of an apparent frustration with Mexico’s lack of action in stemming the flow of Central American asylum seekers.

The Dow Jones Industrial Average reversed back up and posted its best weekly results in over six months. Both the S&P 500 and the Nasdaq rose for the week, 1% for the S&P 500 and 1.7% for the Nasdaq.

The Week Ahead

This link takes you to Econoday’s Economic Calendar and Economic Events and Analysis which shows the upcoming economic reporting events scheduled in the week and months ahead.

Summary

Note: The comments that follow are derived from the economic indicators referenced in the Resources section of this newsletter and other sources in this report.

The Aruoba-Diebold-Scotti Business Conditions Index (ALS) has been trending up the last several weeks and is now very close to the zero line. The ALS Index advanced slightly again this past week. This is a very positive indicator for the economy on a short-term basis.

The GDPNow model estimate for real GDP growth (seasonally adjusted annual rate) in the second quarter of 2019 is 1.4 percent on June 7, down from 1.5 percent on June 6. This slight adjustment continues to support the ALS model assessment of an improving short-term economic environment.

The New York Fed Staff Nowcast stands at 1.0% for 2019:Q2 and 1.3% for 2019:Q3.

The Chicago Fed National Activity Index (CFNAI) showed a decline in economic activity in April. The Chicago Fed National Activity Index (CFNAI) was –0.45 in April, down from +0.05 in March.

All told, these short-term economic indicators are a neutral to positive analysis for the economy, at least on a short-term basis.

Expectations that stock prices will rise over the next six months is at 22.5%, an unusually low level, in the latest AAII Sentiment Survey. The historical average is 38.5% for the survey. Please see the AAII Sentiment Survey for the complete results.

The latest Gross output (GO) reading suggests slow economic growth as we enter 2019.

On a longer-term basis, the forecasters in the Philadelphia Fed’s Survey of Professional Forecasters (as of May 10, 2019) predict real GDP will grow at an annual rate of 1.9 percent this quarter and 2.1 percent next quarter. On an annual-average over annual-average basis, the forecasters predict real GDP to grow 2.6 percent in 2019, 2.0 percent in 2020, 1.9 percent in 2021 and 2.3 percent in 2022. The forecasters predict the unemployment rate will average 3.7 percent in 2019, 3.6 percent in 2020, 3.7 percent in 2021, and 3.9 percent in 2022.

For a more in-depth review and analysis of the economy, please see our mini-book on economic analysis and forecasting entitled: Simple and Effective Economic Forecasting.

Stock Market Valuations

Our estimates of the market valuations for two stock market indices, the Dow Jones Industrial Average (DJIA) and the Standard & Poor’s 500 (S&P 500), can be found in the file below:

Conclusion

We continue to believe the economy is in a stable but now more vulnerable state. Recent economic reports have been showing signs of weakening. Nonetheless, the economy has remained fairly strong. In fact, the extremely strong first quarter GDP showing and the strong labor market conditions still give us confidence that the economy, now in its tenth year of expansion, can continue to grow. But we are cautious on this outlook! Please see our complete Economic and Investment Review in the Winter 2019 quarterly issue of the Intrinsic Value Wealth Report Newsletter.

With the market rebound this past week, the broad market remains overvalued, although the Dow Jones Industrial Average looks more fairly valued than the broad market. But that does not mean that a market correction is imminent. Markets can and do stay overvalued for long periods of time. As discussed above and in the Economic and Investment Highlights section of this Commentary, we believe the economy is in a stable but vulnerable state that is showing signs of weakening. If the economy remains strong, the markets will likely remain strong. If the economy deteriorates, the markets may well correct. There are other events that could trigger a market correction, of course, but economic conditions are the most likely and foreseeable events that could make that happen.

We believe it is important to maintain a long-term view toward investing. This means that you should continue building your investment portfolio using the Cassandra Stock Selection Model to select individual securities that offer growth and value opportunities.

Chart for Review and Thought

Interest Rates 1934 to 2019

Announcements

We have been researching the use of crowdsourcing for investment ideas. We will be sending a survey out in the next few weeks to get your input on the economy and the markets; and to get any investment ideas that you would like to share. We will compile this input and distribute the results to you and our other subscribers.

Dr. Wendee will be speaking at the Las Vegas Investment Club on June 24th.  He will be speaking on the topic of his popular Forbes article, Nine of the Best Ways to Build Wealth. Please contact Mike Lathigee at mike@mikelathigee.com if you would like to attend.

Dr. Wendee will be speaking at FreedomFest during its annual conference in Las Vegas, July 17 – 20, 2019.

Dr. Wendee will be a judge at the FundingPost June PitchFest Event on June 11, 2019 in San Diego. Click on this link for details on the event: 
https://www.fundingpost.com/event/reg1.asp?event=433

Business 539 – Financial Management – On May 9, 2019, Dr. Wendee started teachingBusiness 539 – Financial Management at California Baptist University (CBU). Dr. Wendee teaches courses in Finance and Economics at CBU.

Management 3080 – Business Responsibility in Society – Dr. Wendee will be teaching Management 3080 – Business Responsibility in Society at California State University, Los Angeles (CSULA) starting August 22, 2019. Dr. Wendee teaches courses in Management at CSULA.

Dr. Wendee will be presenting a paper on enterprise value creation at the International Leadership Association’s annual global conference which is being held in Ottawa, Canada this Fall.

Intrinsic Value Wealth Creation pyramid

We always conclude our commentary with a discussion of the Intrinsic Value Wealth Creation Pyramid. The Intrinsic Value Wealth Creation Pyramid is designed to show some of the major categories for building wealth. It is the result of many years of study of the wealth building process; experience working with clients who have built considerable wealth; and my own personal experience building wealth. Newsletter subscribers should consult the Intrinsic Value Wealth Creation Pyramid as one of many useful investment tools while considering their investment plans.

The chart in this section is an expanded version of the Intrinsic Value Wealth Creation Pyramid Chart referenced in the Forbes.com article entitled, Nine Of The Best Ways To Build Wealth

RESOURCES

See our Resources section for links to economic and other resources used in the preparation of this Commentary.

Posted in Economic & Business Chart Room, Economic Outlook, Entrepreneurship, Focus List, Investment Recommendations, Investments, Notes From The Field, Special Situations, Uncategorized, VDI/REEP, Visionary Ideas | Tagged , , , , , , , , , , , , , , , , , , , , , , , , | Comments Off on WEEKLY COMMENTARY June 10, 2019

WEEKLY COMMENTARY June 3, 2019

Keep You Powder Dry!

At the current time, we are not investing any of our cash reserves until the stock markets reverse back up in a more positive trend. As noted below, both the S&P 500 and the Dow were down significantly last week. The markets ended essentially flat today, with the Dow closing up 4.74 points and the S&P 500 closing down 7.61 points.

We have not sold any positions during this latest market selloff. That is not our style. But when we invest cash reserves back into the market, we have found that it pays to wait for the market to stop dropping, if it has been doing so.

The mechanics of the Cassandra Model tell us which individual stocks to sell, or considering selling, when their time has come. And it tells us which individual stocks to buy when we do put cash reserves into the market, either because we have sold a position and have that cash to reinvest, or as a result of our policy of staging into the market instead of dumping a large sum of cash into the market at one time. These policies have done extremely well for us over many years and over many market cycles.

As is the case with Newton’s Law of Motion, which states that objects that are in motion will stay in motion until a force diverts them, stocks that are moving in a particular direction tend to stay moving in that direction – until they don’t. Eventually some event or condition will make them reverse direction. We use a variety of economic and financial tools to help us discern when the markets are reversing from a trend. It is these tools that will tell us when to start investing our cash reserves in this market. That has not happened yet. We will keep you advised through this Commentary section of our newsletter when we believe it is time to start investing cash reserves.

The phrase “keep your powder dry,” reportedly first used by Oliver Cromwell at the Battle of Edgehill in 1642, has come to mean to stay calm and wait for a better opportunity. We give the same advice to investors in this rather volatile market.

Economic and Investment Highlights

Last Week

European Union election results showed a widening of divisions in the European bloc, posing the threat of greater instability in the EU.

Tariffs and trade tensions are increasingly hurting U.S. industries in both higher costs to manufacturers and lower demand for U.S. products. Trade tensions have also been hurting stock prices and bond yields world-wide.

Bond yields across the globe have been falling, reflecting concerns that global economic growth is slowing.

U.S. crude oil supplies have been growing at the strongest pace since 2016, stoking fears of oversupply.

Home price growth slowed in March; and U.S. new and existing home sales fell in April, continuing a softening in the U.S. housing sector. In a potentially positive sign for housing, mortgage rates dropped below 4%.

The Fed sees trade tensions as a risk to the U.S. economy. This is giving them pause in their current policy of holding rates steady.

Trump threatened a 5% tariff on Mexican goods out of an apparent frustration with Mexico’s lack of action in stemming the flow of Central American asylum seekers.

Enrollment in U.S. colleges and universities declined for the seventh straight year.

U.S. inflation picked up in April with the price index for personal consumption expenditures rising a seasonally-adjusted 0.31% in April from March. The core PCE price index rose 0.25%. Inflation still remains well below the Fed’s 2% target, a level considered by many economists to be consistent with solid economic growth.

The Dow Jones Industrial Average declined for the sixth consecutive week. The S&P 500 declined 1.3% for the week.

The Week Ahead

This link takes you to Econoday’s Economic Calendar and Economic Events and Analysis which shows the upcoming economic reporting events scheduled in the week and months ahead.

Summary

Note: The comments that follow are derived from the economic indicators referenced in the Resources section of this newsletter and other sources in this report.

The Aruoba-Diebold-Scotti Business Conditions Index (ALS) has been trending up the last several weeks and is now very close to the zero line. The ALS Index advanced slightly again this past week. This is a very positive indicator for the economy on a short-term basis.

The GDPNow model estimate for real GDP growth (seasonally adjusted annual rate) in the second quarter of 2019 is 1.3 percent on June 3, up from 1.2 percent on May 31. This slight adjustment continues to support the ALS model assessment of an improving short-term economic environment.

The New York Fed Staff Nowcast stands at 1.5% for 2019:Q2.

The Chicago Fed National Activity Index (CFNAI) showed a decline in economic activity in April. The Chicago Fed National Activity Index (CFNAI) was –0.45 in April, down from +0.05 in March.

All told, these short-term economic indicators are a positive analysis for the economy, at least on a short-term basis. It should be noted that all but the CFNAI showed slight upticks in the past week. There was no new reporting for the CFNAI in the past week.

Expectations that stock prices will rise over the next six months is at 24.8%, an unusually low level, in the latest AAII Sentiment Survey. The historical average is 38.5% for the survey. Two out of 5 individual investors are pessimistic about the short-term outlook for stocks. Please see the AAII Sentiment Survey for the complete results.

The latest Gross output (GO) reading suggests slow economic growth as we enter 2019.

On a longer-term basis, the forecasters in the Philadelphia Fed’s Survey of Professional Forecasters (as of May 10, 2019) predict real GDP will grow at an annual rate of 1.9 percent this quarter and 2.1 percent next quarter. On an annual-average over annual-average basis, the forecasters predict real GDP to grow 2.6 percent in 2019, 2.0 percent in 2020, 1.9 percent in 2021 and 2.3 percent in 2022. The forecasters predict the unemployment rate will average 3.7 percent in 2019, 3.6 percent in 2020, 3.7 percent in 2021, and 3.9 percent in 2022.

For a more in-depth review and analysis of the economy, please see our mini-book on economic analysis and forecasting entitled: Simple and Effective Economic Forecasting.

Stock Market Valuations

Our estimates of the market valuations for two stock market indices, the Dow Jones Industrial Average (DJIA) and the Standard & Poor’s 500 (S&P 500), can be found in the file below:

Conclusion

We continue to believe the economy is in a stable but somewhat vulnerable state, although recent economic reports have been showing signs of weakening. Nonetheless, it has remained fairly strong. In fact, the extremely strong first quarter GDP showing and the strong labor market conditions still give us confidence that the economy, now in its tenth year of expansion, can continue to grow. But we are cautious on this outlook! Please see our complete Economic and Investment Review in the Winter 2019 quarterly issue of the Intrinsic Value Wealth Report Newsletter.

Even with the further pullback in the market this past week, the broad market remains overvalued, although the Dow Jones Industrial Average looks more fairly valued than the broad market. But that does not mean that a market correction is imminent. Markets can and do stay overvalued for long periods of time. As discussed above and in the Economic and Investment Highlights section of this Commentary, we believe the economy is in a stable but vulnerable state. If the economy remains strong, the markets will likely remain strong. If the economy deteriorates, the markets may well correct. There are other events that could trigger a market correction, of course, but economic conditions are the most likely and foreseeable events that could make that happen.

We believe it is important to maintain a long-term view toward investing. This means that you should continue building your investment portfolio using the Cassandra Stock Selection Model to select individual securities that offer growth and value opportunities.

Chart for Review and Thought


The New York Stock Exchange Bullish Percent Index Went Into Bear Confirmed
Status on May 14, 2019

Announcements

We have been researching the use of crowdsourcing for investment ideas. We will be sending a survey out in the next few weeks to get your input on the economy and the markets; and to get any investment ideas that you would like to share. We will compile this input and distribute the results to you and our other subscribers.

Dr. Wendee will be speaking at the Las Vegas Investment Club on June 24th.  He will be speaking on the topic of his popular Forbes article, Nine of the Best Ways to Build Wealth. Please contact Mike Lathigee at mike@mikelathigee.com if you would like to attend.

Dr. Wendee will be speaking at FreedomFest during its annual conference in Las Vegas, July 17 – 20, 2019.

Dr. Wendee will be a judge at the FundingPost June PitchFest Event on June 11, 2019 in San Diego. Click on this link for details on the event: 
https://www.fundingpost.com/event/reg1.asp?event=433

Business 539 – Financial Management – On May 9, 2019, Dr. Wendee started teachingBusiness 539 – Financial Management at California Baptist University (CBU). Dr. Wendee teaches courses in Finance and Economics at CBU.

Management 3080 – Business Responsibility in Society – Dr. Wendee will be teaching Management 3080 – Business Responsibility in Society at California State University, Los Angeles (CSULA) starting August 22, 2019. Dr. Wendee teaches courses in Management at CSULA.

Dr. Wendee will be presenting a paper on enterprise value creation at the International Leadership Association’s annual global conference which is being held in Ottawa, Canada this Fall.

Our coffeehouse in Vista, California, Bistro on Main Street, had a record-breaking crowd during Vista’s Strawberry Festival over the Memorial Day Weekend.

Intrinsic Value Wealth Creation pyramid

We always conclude our commentary with a discussion of the Intrinsic Value Wealth Creation Pyramid. The Intrinsic Value Wealth Creation Pyramid is designed to show some of the major categories for building wealth. It is the result of many years of study of the wealth building process; experience working with clients who have built considerable wealth; and my own personal experience building wealth. Newsletter subscribers should consult the Intrinsic Value Wealth Creation Pyramid as one of many useful investment tools while considering their investment plans.

The chart in this section is an expanded version of the Intrinsic Value Wealth Creation Pyramid Chart referenced in the Forbes.com article entitled, Nine Of The Best Ways To Build Wealth

RESOURCES

See our Resources section for links to economic and other resources used in the preparation of this Commentary.

Posted in Economic & Business Chart Room, Economic Outlook, Entrepreneurship, Focus List, Investment Recommendations, Investments, Notes From The Field, Special Situations, Uncategorized, VDI/REEP, Visionary Ideas | Tagged , , , , , , , , , , , , , , , , , , , , , , , , | Comments Off on WEEKLY COMMENTARY June 3, 2019

WEEKLY COMMENTARY May 27, 2019

Some Of The Best Known Tech IPOs Sell For Less As Public Companies Then When They Were Private

What do Uber, Snap, Dropbox, and Cloudera all have in common? The price of their shares as public companies is lower than their price as private companies.

Venture capitalists (VCs) and private equity (PE) investors often view tech startups as industry disrupters, despite their often-heavy current losses. Venture capitalists and private equity firms fund the growth of these disrupters in the hope that they will make many multiples of return over their investment. These VC and PE firms are very patient, willing to wait for long periods of time to get these returns. Public investors, on the other hand, are more concerned about seeing revenues and profit in the foreseeable future. They are not willing to wait for years for the visions of the disrupters to play out.

Startups of U.S. companies that went public since 2015 have done well overall, though. Their public valuations are 90% on average higher than the valuations on the last private funding round. But these four companies that we have mentioned above have not lived up to expectations.

Economic and Investment Highlights

Last Week

Spending on factories, equipment, and other capital goods slowed in the first quarter.

Fed Chairman Powell warned again of the risks of rising corporate debt. We have been citing this concern for quite some time (see for example our Economic and Investment Review in the Winter edition of this newsletter).

Economic distortions in Europe prevail due to the widespread and continuing use of negative interest rates. Negative interest rates have been a policy solution to jump-start European economies for the past five years; but European central banks that implemented these policy initiatives have so far been unable to return to a positive rate environment.

Retail sales at several major chains slowed in the latest quarter.

U.S. new and existing home sales fell in April, continuing a softening in the U.S. housing sector.

Durable goods orders fell 2.1% in April.

One-quarter of working Americans have no retirement savings.

Prime Minister Theresa May is resigning as Britain’s prime minister after failing to win support for her Brexit deal.

The Dow Jones Industrial Average declined for the fifth consecutive week. The S&P 500 declined 1.2% for the week.

The Week Ahead

This link takes you to Econoday’s Economic Calendar and Economic Events and Analysis which shows the upcoming economic reporting events scheduled in the week and months ahead.

Summary

Note: The comments that follow are derived from the economic indicators referenced in the Resources section and other sources at the end of this report.

The Aruoba-Diebold-Scotti Business Conditions Index (ALS) has been trending up the last several weeks and is now very close to the zero line. The ALS Index advanced slightly again this past week. This is a very positive indicator for the economy on a short-term basis.

The GDPNow model estimate for real GDP growth (seasonally adjusted annual rate) in the second quarter of 2019 is 1.3 percent on May 24, up from 1.2 percent on May 16. This slight adjustment continues to support the ALS model assessment of an improving short-term economic environment.

The New York Fed Staff Nowcast stands at 1.4% for 2019:Q2. The Chicago Fed National Activity Index (CFNAI) showed a decline in economic activity in April.

The Chicago Fed National Activity Index (CFNAI) was –0.45 in April, down from +0.05 in March.

All told, these short-term economic indicators are a positive analysis for the economy, at least on a short-term basis. However, all but the ALS showed a slight decline in the past week.

Expectations that stock prices will rise over the next six months declined 5.1 percentage points to 24.7%, an unusually low level, in the latest AAII Sentiment Survey. The historical average is 38.5% for the survey. Please see the AAII Sentiment Survey for the complete results.

The latest Gross output (GO) reading suggests slow economic growth as we enter 2019.

On a longer-term basis, the forecasters in the Philadelphia Fed’s Survey of Professional Forecasters (as of May 10, 2019) predict real GDP will grow at an annual rate of 1.9 percent this quarter and 2.1 percent next quarter. On an annual-average over annual-average basis, the forecasters predict real GDP to grow 2.6 percent in 2019, 2.0 percent in 2020, 1.9 percent in 2021 and 2.3 percent in 2022. The forecasters predict the unemployment rate will average 3.7 percent in 2019, 3.6 percent in 2020, 3.7 percent in 2021, and 3.9 percent in 2022.

For a more in-depth review and analysis of the economy, please see our mini-book on economic analysis and forecasting entitled: Simple and Effective Economic Forecasting.

Stock Market Valuations

Our estimates of the market valuations for two stock market indices, the Dow Jones Industrial Average (DJIA) and the Standard & Poor’s 500 (S&P 500), can be found in the file below:

Conclusion

We continue believe the economy is in a stable but somewhat vulnerable state. Nonetheless, it has remained fairly strong. In fact, the extremely strong first quarter GDP showing and the strong labor market conditions give us more confidence that the economy, now in its tenth year of expansion, can continue to grow. Please see our complete Economic and Investment Review in the Winter 2019 quarterly issue of the Intrinsic Value Wealth Report Newsletter.

Even with the further pullback in the market this past week, the broad market remains overvalued, although the Dow Jones Industrial Average looks more fairly valued than the broad market. But that does not mean that a market correction is imminent. Markets can and do stay overvalued for long periods of time. As discussed above in the Economic and Investment Highlights section of this Commentary, we believe the economy is in a stable but vulnerable state. If the economy remains strong, the markets will likely remain strong. If the economy deteriorates, the markets may well correct. There are other events that could trigger a market correction, of course, but economic conditions are the most likely and foreseeable events that could make that happen.

We believe it is important to maintain a long-term view toward investing. This means that you should continue building your investment portfolio using the Cassandra Stock Selection Model to select individual securities that offer growth and value opportunities.

Chart for Review and Thought


The New York Stock Exchange Bullish Percent Index Went Into Bear Confirmed Status on May 14, 2019

Announcements

We have been researching the use of crowdsourcing for investment ideas. We will be sending a survey out in the next few weeks to get your input on the economy and the markets; and to get any investment ideas that you would like to share. We will compile this input and distribute the results to you and our other subscribers.

Dr. Wendee will be speaking at the Las Vegas Investment Club on June 24th.  He will be speaking on the topic of his popular Forbes article, Nine of the Best Ways to Build Wealth. Please contact Mike Lathigee at mike@mikelathigee.com if you would like to attend.

Dr. Wendee will be speaking at FreedomFest during its annual conference in Las Vegas, July 17 – 20, 2019.

Dr. Wendee will be a judge at the FundingPost June PitchFest Event on June 11, 2019 in San Diego. Click on this link for details on the event: 
https://www.fundingpost.com/event/reg1.asp?event=433

Business 539 – Financial Management – On May 9, 2019, Dr. Wendee started teachingBusiness 539 – Financial Management at California Baptist University (CBU). Dr. Wendee teaches courses in Finance and Economics at CBU.

Management 3080 – Business Responsibility in Society – Dr. Wendee will be teaching Management 3080 – Business Responsibility in Society at California State University, Los Angeles (CSULA) starting May 29, 2019. Dr. Wendee teaches courses in Management at CSULA.

Dr. Wendee will be presenting a paper on enterprise value creation at the International Leadership Association’s annual global conference which is being held in Ottawa, Canada this Fall.

Intrinsic Value Wealth Creation pyramid

We always conclude our commentary with a discussion of the Intrinsic Value Wealth Creation Pyramid. The Intrinsic Value Wealth Creation Pyramid is designed to show some of the major categories for building wealth. It is the result of many years of study of the wealth building process; experience working with clients who have built considerable wealth; and my own personal experience building wealth. Newsletter subscribers should consult the Intrinsic Value Wealth Creation Pyramid as one of many useful investment tools while considering their investment plans.

The chart in this section is an expanded version of the Intrinsic Value Wealth Creation Pyramid Chart referenced in the Forbes.com article entitled, Nine Of The Best Ways To Build Wealth.

RESOURCES

See our Resources section for links to economic and other resources used in the preparation of this Commentary.

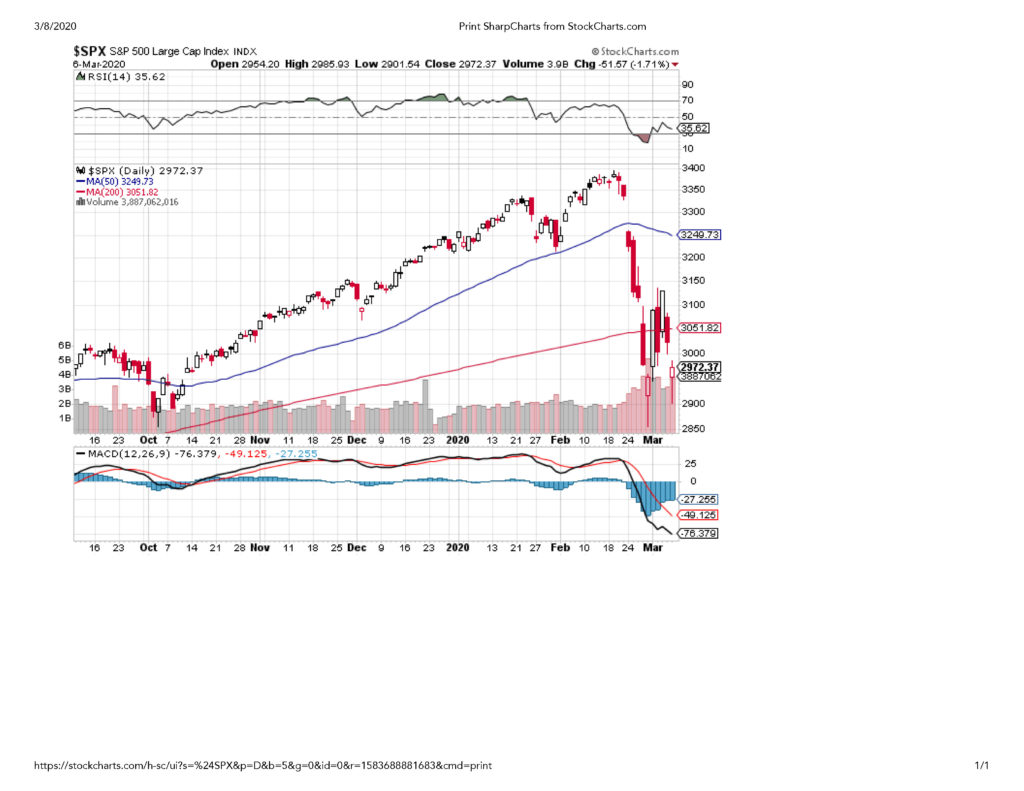
Posted in Economic & Business Chart Room, Economic Outlook, Entrepreneurship, Focus List, Investment Recommendations, Investments, Notes From The Field, Special Situations, Uncategorized, VDI/REEP, Visionary Ideas | Tagged , , , , , , , , , , , , , , , , , , , , , , , , | Comments Off on WEEKLY COMMENTARY May 27, 2019

WEEKLY COMMENTARY May 20, 2019

Trade Talks Stalled – Markets React Adversely

Despite the breakdown in trade talks between the U.S. and China last week, and the imposition by the U.S. of a 25% tariff on $200 billion of Chinese goods, both sides have indicated they are anxious to continue trade talks. China has invited U.S. trade officials to Beijing to continue the talks. The breakdown in talks last week appears to have been the result of miscues on both sides. Nonetheless, U.S.-China tensions escalated when China laid out plans for tariffs of its own on $60 billion of U.S. exports to China; and the U.S. raised the possibility of $300 billion of new Chinese products which could be subject to 25% tariffs.

Economic and Investment Highlights

Last Week

Job growth at small firms has fallen to the lowest level in eight years due to the tight labor market. The U.S. labor market is at its tightest levels in 50 years.

There is an increasing trend of loans to borrowers with heavy debt loads. This raises the prospect of higher defaults should the economy falter. Some housing economists also contend that the increased demand from these loans is artificially raising housing prices.

Retail sales slipped a seasonally adjusted 0.2% in April from March.

Factory output fell 0.5% in April from March.

U.S. companies have been buying back their own shares at a strong pace for more than a year. Share buybacks increase companies’ earnings per share as there are fewer shares outstanding after a buyback. Companies often buy back their shares when markets decline and they have cash on hand to do the buybacks.

The S&P 500 declined again for the second straight week. The Dow Jones Industrial Average declined for the fourth consecutive week. The point & figure chart of the New York Stock Exchange Bullish Percent Index went into Bull Correction status on May 14, 2019 (see Chart for Review and Thought below).

The Week Ahead

This link takes you to Econoday’s Economic Calendar and Economic Events and Analysis which shows the upcoming economic reporting events scheduled in the week and months ahead.

Summary

Note: The comments that follow are derived from the economic indicators referenced in the Resources section and other sources at the end of this report.

The Aruoba-Diebold-Scotti Business Conditions Index (ALS) has been trending up the last several weeks and is now very close to the zero line. The ALS Index advanced slightly again this past week. This is a very positive indicator for the economy on a short-term basis.

The GDPNow model estimate for real GDP growth (seasonally adjusted annual rate) in the second quarter of 2019 is 1.2 percent on May 16. This reading continues to support the ALS model assessment of an improving short-term economic environment.

The New York Fed Staff Nowcast stands at 1.8% for 2019:Q2.

The Chicago Fed National Activity Index (CFNAI) showed a decline in economic activity in April. The Chicago Fed National Activity Index (CFNAI) was –0.45 in April, down from +0.05 in March.

All told, these short-term economic indicators are a positive analysis for the economy, at least on a short-term basis. However, all but the ALS showed a slight decline in the past week.

Expectations that stock prices will rise over the next six months declined 13.3 percentage points to 29.8% in the latest AAII Sentiment Survey. The historical average is 38.5% for the survey. Please see the AAII Sentiment Survey for the complete results.

The latest Gross output (GO) reading suggests slow economic growth as we enter 2019.

On a longer-term basis, the forecasters in the Philadelphia Fed’s Survey of Professional Forecasters (as of May 10, 2019) predict real GDP will grow at an annual rate of 1.9 percent this quarter and 2.1 percent next quarter. On an annual-average over annual-average basis, the forecasters predict real GDP to grow 2.6 percent in 2019, 2.0 percent in 2020, 1.9 percent in 2021 and 2.3 percent in 2022. The forecasters predict the unemployment rate will average 3.7 percent in 2019, 3.6 percent in 2020, 3.7 percent in 2021, and 3.9 percent in 2022.

For a more in-depth review and analysis of the economy, please see our mini-book on economic analysis and forecasting entitled: Simple and Effective Economic Forecasting.

Stock Market Valuations

Our estimates of the market valuations for two stock market indices, the Dow Jones Industrial Average (DJIA) and the Standard & Poor’s 500 (S&P 500), can be found in the file below:

Stock Market Valuations are not available for this week. Please see last week’s Commentary for the valuations for that week.

Conclusion

We continue believe the economy is in a stable but somewhat vulnerable state. Nonetheless, it has remained fairly strong. In fact, the extremely strong first quarter GDP showing and the strong labor market conditions give us more confidence that the economy, now in its tenth year of expansion, can continue to grow. Please see our complete Economic and Investment Review in the Winter 2019 quarterly issue of the Intrinsic Value Wealth Report Newsletter.

Even with the further pullback in the market this past week, it remains overvalued. But that does not mean that a market correction is imminent. Markets can and do stay overvalued for long periods of time. As discussed above in the Economic and Investment Highlights section of this Commentary, we believe the economy is in a stable but vulnerable state. If the economy remains strong, the markets will likely remain strong. If the economy deteriorates, the markets may well correct. There are other events that could trigger a market correction, of course, but economic conditions are the most likely and foreseeable events that could make that happen.

We believe it is important to maintain a long-term view toward investing. This means that you should continue building your investment portfolio using the Cassandra Stock Selection Model to select individual securities that offer growth and value opportunities.

Chart for Review and Thought

The New York Stock Exchange Bullish Percent Index Went Into Bull Correction Status on May 14, 2019

Announcements

We have been researching the use of crowdsourcing for investment ideas. We will be sending a survey out in the next few weeks to get your input on the economy and the markets; and to get any investment ideas that you would like to share. We will compile this input and distribute the results to you and our other subscribers.

Dr. Wendee will be speaking at the Las Vegas Investment Club on June 24th.  He will be speaking on the topic of his popular Forbes article, Nine of the Best Ways to Build Wealth. Please contact Mike Lathigee at mike@mikelathigee.com if you would like to attend.

Dr. Wendee will be speaking at FreedomFest during its annual conference in Las Vegas, July 17 – 20, 2019.

Dr. Wendee will be a judge at the FundingPost June PitchFest Event on June 11, 2019 in San Diego. Click on this link for details on the event: 
https://www.fundingpost.com/event/reg1.asp?event=433

Dr. Wendee attended the Money show in Las Vegas this past week.

Business 539 – Financial Management – On May 9, 2019, Dr. Wendee started teaching Business 539 – Financial Management at California Baptist University (CBU). Dr. Wendee teaches courses in Finance and Economics at CBU.

Management 3080 – Business Responsibility in Society – Dr. Wendee will be teaching Management 3080 – Business Responsibility in Society at California State University, Los Angeles (CSULA) starting May 29, 2019. Dr. Wendee teaches courses in Management at CSULA.

Intrinsic Value Wealth Creation pyramid

We always conclude our commentary with a discussion of the Intrinsic Value Wealth Creation Pyramid. The Intrinsic Value Wealth Creation Pyramid is designed to show some of the major categories for building wealth. It is the result of many years of study of the wealth building process; experience working with clients who have built considerable wealth; and my own personal experience building wealth. Newsletter subscribers should consult the Intrinsic Value Wealth Creation Pyramid as one of many useful investment tools while considering their investment plans.

The chart in this section is an expanded version of the Intrinsic Value Wealth Creation Pyramid Chart referenced in the Forbes.com article entitled, Nine Of The Best Ways To Build Wealth.I

RESOURCES

Economic Indicators

Below are links to a few of the many resources that we follow on a continuous basis to track the economy and financial markets on a short-term and long-term basis.

Real-Time and Current Economic Conditions

The Federal Reserve Bank of Philadelphia’s Aruoba-Diebold-Scotti Business Conditions (ADS) Index is designed to track real business conditions at high frequency. Click Aruoba-Diebold-Scotti Business Conditions Index to access this model.

Click GDPNow to access The Federal Reserve Bank of Atlanta’s GDPNow Forecasting Model.

The Federal Reserve Bank of New York’s Nowcast report tracks the evolution of the FRBNY Staff Nowcast of GDP growth and the impact of new data releases on the forecast. Click Nowcast to access the report and background information on the report.

The Chicago Fed National Activity Index (CFNAI) is a monthly index designed to gauge overall economic activity and related inflationary pressure. Click CFNAI to access this index.

Economy At A Glance

The National Economic Trends charts provided by the Federal Reserve Bank of St. Louis (FRED) can be accessed by clicking the Economy At A Glance link below:

Economy At A Glance

Gross Output

Gross Output is a measure that may be more useful than the Gross Domestic Product (GDP) measure, as it looks at the top line of national income accounting. It is also a good measure to use in conjunction with GDP to get a better overall picture of the economy. This measure can be accessed by clicking the links below:

Gross Output By Industry

MSkousen.com

Gross Output (GO)

Surveys of Professional Forecasters

The Survey of Professional Forecasters’ web page offers the actual releases, documentation, mean and median forecasts of all the respondents in the Fed’s Survey of Professional Forecasters.  Click the following link to be taken to the Federal Reserve Bank of Philadelphia’s website to access the current survey: Survey of Professional Forecasters.

The Livingston Survey of Professional Forecasters’ web page offers the actual releases, documentation, mean and median forecasts of all the respondents in the Fed’s Livingston Survey. Click the following link to be taken to the Federal Reserve Bank of Philadelphia’s website to access the current survey: Livingston Survey.

Econoday

Econoday offers some excellent resources for understanding and forecasting the economy. The link below takes you to Econoday’s Economic Calendar and Economic Events and Analysis sections. Please see Econoday’s Economic Calendar for upcoming economic reporting events in the week and months ahead.

AAII Investor Sentiment Survey

The AAII Investor Sentiment Survey measures the percentage of individual investors who are bullish, bearish, and neutral on the stock market for the next six months: AAII Investor Sentiment Survey.

Posted in Economic & Business Chart Room, Economic Outlook, Entrepreneurship, Focus List, Investment Recommendations, Investments, Notes From The Field, Special Situations, Uncategorized, VDI/REEP, Visionary Ideas | Tagged , , , , , , , , , , , , , , , , , , , , , , , , , | Comments Off on WEEKLY COMMENTARY May 20, 2019