SPECIAL REPORT: Are the Best Investors Forgetful or Dead?

Note: This article is reproduced from the March 29, 2016 edition of the Intrinsic Value Wealth Report.

A central theme of the Intrinsic Value Wealth Report is that investors should invest in good businesses that are growing – and not pay too much for those businesses. Warren Buffett summed it up as investing in “…the right businesses, with the right people, at the right price.” (Buffett, Warren., “Warren Buffett Talks Business.” The University of North Carolina.

 Center for Public Television, 1995). At the Intrinsic Value Wealth Report, we publish the Cassandra Stock Selection Model to help you find these types of companies. The candidate list of stocks generated by the Cassandra Stock Selection Model is divided into five groupings that are segmented by market capitalization. We do this to give investors a choice of stocks in which to invest. The candidate list ranges from the more conservative stocks (larger capitalization stocks) to the more aggressive stocks (smaller capitalization stocks) – the assumption being made that risk increases the lower the market capitalization; a supposition that generally holds true.

Another central theme of the Intrinsic Value Wealth Report is that investors should hold these stocks for a long period of time – at least three to five years, if not longer. We are strong believers that once you make a stock investment, you should pretend that the market is closed and not look at the market again until you make your next stock purchase selection. That is not to say that you should neglect the stocks you hold in your portfolio. Quite to the contrary! You have invested in a business, and like any business, you should monitor how the business is doing – but you should forget about its stock price, at least in the short run.

One of the chief reasons for our philosophy of investing for the long term, and not watching the stock prices every day, is that as human beings we tend to be ruled by our emotions. The average investor goes through cycles of greed and fear – getting greedy when stock prices are going up; and becoming fearful when stock prices fall. And the reaction usually manifests itself in an overreaction on either side – that is to say that people are either very greedy or very fearful. Jason Zweig, a columnist with the Wall Street Journal, states the phenomenon this way:  “…the more stocks go up and the faster they rise, the more likely you become to expect more of the same. And when they go down, your expectations fall with them. (Zweig, J., “The Worst Advice? ‘Just Trust Your Gut’.” The Wall Street Journal, March 19-20, 2016, P. B1). Zweig also references a study by Yale professors Robert Shiller and William Goetzmann, along with Case Western Reserve University professor Dasol Kim, where they show that “…investors’ forecasts regularly look more like aftercasts – simple projections of the recent past into the future.” While Zweig was commenting primarily on expectations for the stock market as a whole, this phenomenon applies to individual stocks as well. Zweig quotes the founding father of modern securities analysis, Benjamin Graham, as saying: “The investor’s chief problem – and even his worst enemy – is likely to be himself.”

So how do investors perform when they resist the temptation to trade in and out of their stock holdings, which is contrary to what many advisors, and their own gut instincts, would have them do? Many studies support the notion that less trading leads to overall better investment results. According to one source, “…Fidelity [Investments] had studied which customer investing accounts performed the best: They were the ones held by people who had forgotten they even had Fidelity accounts, and so did no buying or selling from them.” When this story was told on Bloomberg Radio, the Bloomberg commentator noted that he had noticed a similar phenomenon with families fighting over inherited assets: “Because of the extended court battles, in some cases, the accounts couldn’t be touched for 10 or 20 years: No buying new investments or selling old ones. Those families subsequently found that the period of inactivity was the time when their investments performed best.”  (Kimelman, John, “The Virtues of Inactive Investing,” Barrons online, September 10, 2014). This anecdotal evidence suggests that the best investors are either forgetful or dead!

As a former trust investment officer for a large Midwest bank, and having managed over $200 million in trust account assets during that time, I also have witnessed this phenomenon of how well long-term accounts have performed. The investment policy at the trust company was to diversify the accounts and follow a strategy of long-term buy and hold investing. The accounts that pursued this strategy were most often the best performers.

The bottom line is this: Find the right businesses, with the right people managing them, that are selling at the right price; and as long as they remain good companies, hold onto them forever (or, at least as long as you can!). The Intrinsic Value Wealth Report provides the Cassandra Stock Selection Model, which generates and publishes an excellent candidate list of stocks in various market capitalization ranges, so that you can choose your desired level of risk. You should buy stocks from this list following the Step-By-Step Instructions for Using the Cassandra Stock Selection Model. The Cassandra Stock Selection Model is designed to find good businesses, with good growth prospects, that are selling at reasonable prices. The model has produced an excellent Track Record in doing so.

Once you have chosen your companies and put them into your portfolio, hold them for the long-term. If we at the Intrinsic Value Wealth Report have done our job, we have helped you get into the right businesses, with the right people, at the right price. Your job is to hold onto them and check them every once in a while to ensure that they are still good businesses. Checking up on your companies is not difficult – it is simply a matter of using some good common sense to see if these are still good businesses. If you use good common sense, you will know if they are! The various articles in the Intrinsic Value Wealth Report can enhance your good common investment sense to help you become a more knowledgeable investor and better able to assess the ongoing prospects of the companies in which you invest. When chosen right, most of your companies will be good for the long haul and will be companies you will want to hold for the long-term. You won’t be making a lot of changes in your portfolio using the system that we use and advocate at the Intrinsic Value Wealth Report. But, we believe you will get some very good long-term investment results!

Posted in Economic & Business Chart Room, Economic Outlook, Entrepreneurship, Focus List, Investment Recommendations, Investments, Notes From The Field, Special Situations, Uncategorized, VDI/REEP, Visionary Ideas | Tagged , , , , , , , , , , , , , , , , , , , , , , , , | Comments Off on SPECIAL REPORT: Are the Best Investors Forgetful or Dead?

WEEKLY COMMENTARY March 9, 2020

The Coronavirus, The Economy, and The Markets – An Update

Last week, I summarized where I believe we are in terms of the economy and the markets given the worldwide spread of the coronavirus. This week’s summary is much the same as last week. The rapid spread of the coronavirus is significantly affecting the markets and investor confidence, despite last week’s rise in the market. The spread of the virus is also beginning to have an impact on the U.S. and global economies. There is an economic phenomenon known as the ripple effect. I have been telling students in my economics classes and other audiences to which I have spoken about this phenomenon. The risk of the ripple effect is real and is already being seen throughout global economies. Please see my discussion below under Conclusions for my thoughts on where we currently stand on these fronts and a brief discussion of the ripple effect.

Economic and Investment Highlights

Last Week

The coronavirus continues to disrupt supply chains, production, and sales across a wide array of industries.

ECB chief Lagarde said the bank would support the Eurozone economy against the impact of the coronavirus.

The OECD said global economic growth would slow sharply due to the effects of the coronavirus.

Former General Electric CEO Jack Welch died at the age of 84.

The Fed cut interest rates by one-half point in an emergency move in response to the coronavirus fears. More economists and investors have now raised concerns about the possibility of a recession.

The House passed a $8.3 billion emergency spending package to help combat the impact of the coronavirus.

Mortgage rates fell to their lowest level ever.

New coronavirus cases are increasing at a fast pace worldwide. Virus cases on record are now more than 100,000 on a global basis.

U.S. Treasury yields fell to new lows. The 10-year treasury yield ended the week at 0.709%.

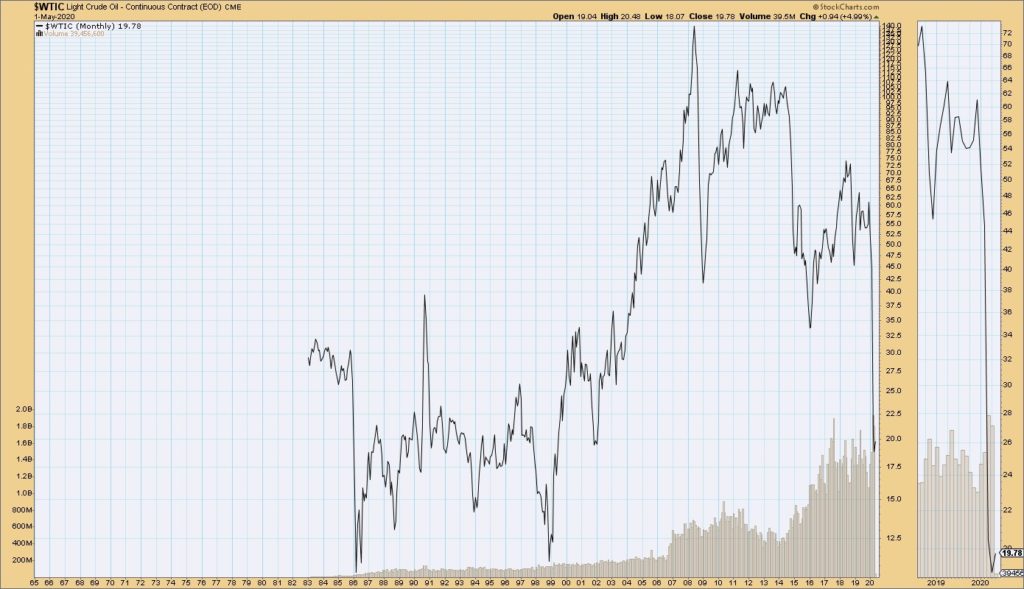
Oil prices marked their worst day since the financial crisis as Russia and Saudi Arabia failed to cement an agreement on production. Oil ended the week at $41.28, the lowest level since 2016.

The Dow, the S&P 500, and the Nasdaq were up for the week. The Dow was up 1.8%; the S&P 500 was up 0.61%; and the Nasdaq was up 0.1%. The 10-year treasury yield ended the week at 0.709%. Gold closed at $1,670.80 for the week.

The Week Ahead

This link takes you to Econoday’s Economic Calendar and Economic Events and Analysis which shows the upcoming economic reporting events scheduled in the week and months ahead.

Summary

Note: The comments that follow are derived from the economic indicators referenced in the Resources section of this newsletter and other sources in this report.

The Aruoba-Diebold-Scotti Business Conditions Index (ALS) has been trending up the last several weeks from having dipped in 2019. This is a positive indicator for the economy on a short-term basis.

The GDPNow model estimate for real GDP growth (seasonally adjusted annual rate) in the first quarter of 2020 is 3.1 percent. This reading continues to support the ALS model assessment of an improving short-term economic environment.

The New York Fed Staff Nowcast stands at 1.4% for 2020:Q1.

The Chicago Fed National Activity Index (CFNAI) showed an increase in economic activity in January. The Chicago Fed National Activity Index (CFNAI) was -0.25 in January, up from -0.51 in December.

All told, these short-term economic indicators are a neutral to positive analysis for the economy, at least on a short-term basis.

Expectations that stock prices will rise over the next six months is now at 38.74% in the latest AAII Sentiment Survey. The historical average is 38.0% for the survey. 21.62% of the investors in the survey described their short-term outlook as neutral and 39.64% were bearish. Please see the AAII Sentiment Survey for the complete results.

The latest Gross output (GO) reading suggests moderate economic growth as we enter 2020.

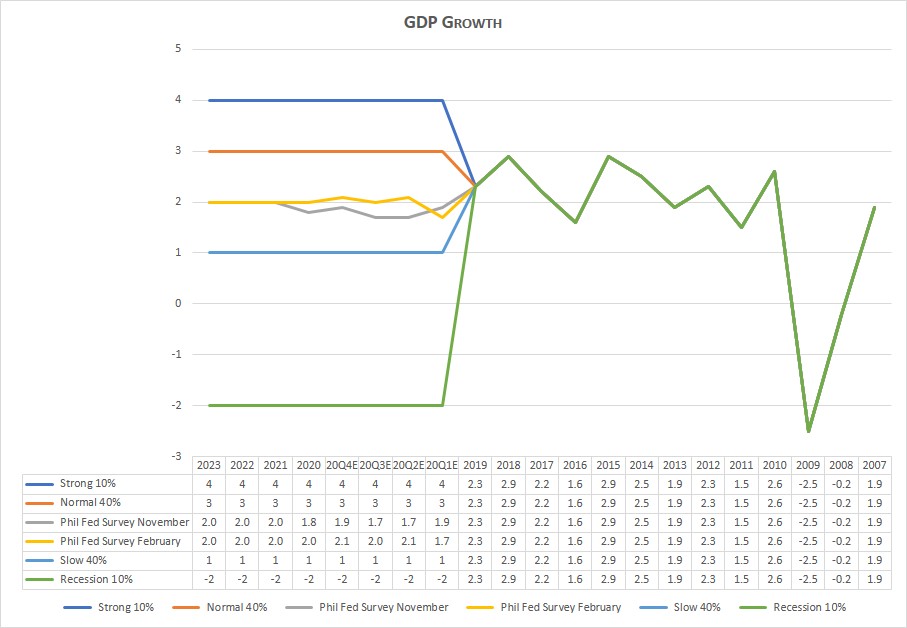
On a longer-term basis, the forecasters in the Philadelphia Fed’s Survey of Professional Forecasters (as of February 14, 2019) predict real GDP will grow at an annual rate of 1.7 percent for the first quarter of 2020, 2.1 percent for the second quarter of 2020, 2.0 percent in the third quarter of 2020, 2.1 percent in the fourth quarter of 2020, and 2.2 percent in the first quarter of 2021. On an annual-average over annual-average basis, the forecasters predict real GDP to grow 2.0 percent in 2020, 2.0 percent in 2021, 2.0 percent in 2022 and 2.0 percent in 2023. The forecasters predict the unemployment rate will average 3.6 percent in 2020, 3.6 percent in 2021, 3.7 percent in 2022, and 3.9 percent in 2023.

For a more in-depth review and analysis of the economy, please see our mini-book on economic analysis and forecasting entitled: Simple and Effective Economic Forecasting.

Stock Market Valuations

Our estimates of the market valuations for two stock market indices, the Dow Jones Industrial Average (DJIA) and the Standard & Poor’s 500 (S&P 500), can be found in the file below:

Conclusion

We continue to believe the economy is in a stable but somewhat vulnerable state. Nonetheless, it has remained fairly strong. In fact, robust consumer spending and strong labor market conditions still give us confidence that the economy, now in its tenth year of expansion, can continue to grow. But we are cautious on this outlook. There are several reasons for our caution. U.S. business growth has been mixed. And global economic growth has been mixed as well. The new coronavirus is becoming a global economic threat, although it is still too early to tell how much of an effect it will ultimately have. Debt is at high levels for consumers, businesses, and government (at all levels). Finally, this is an election year that will likely have significant consequences either positively or negatively depending on the outcome of the elections. And of course, it is still too early to tell what the outcome of the elections will be.

As I mentioned above, there is an economic phenomenon known as the ripple effect. Simply put, the ripple effect occurs when an event, good or bad, causes an economic chain reaction that ripples throughout an economy like the ripples on a body of water when a stone is dropped in the water. I have been telling students in my economics classes and other audiences to which I have spoken about this phenomenon and warning them of the adverse consequences of such a ripple effect as a consequence of the coronavirus. This is particularly true in today’s interconnected global economy. The risk of the ripple effect is real and is already being seen throughout global economies.

The broad market remains overvalued, although the Dow Jones Industrial Average looks more fairly valued than the broad market. But that does not mean that a further market decline is imminent. Markets can and do stay overvalued for long periods of time. As discussed above and in the Economic and Investment Highlights section of this Commentary, we believe the economy is in a stable but vulnerable state. If the economy remains strong, the markets will likely remain strong. If the economy deteriorates, the markets may well correct. There are other events, such as the coronavirus, that could trigger a further market decline, of course, but economic conditions are the most likely and foreseeable events that could make that happen.

We believe it is important to maintain a long-term view toward investing. This means that you should continue building your investment portfolio using the Cassandra Stock Selection Model to select individual securities that offer growth and value opportunities.

Chart for Review and Thought

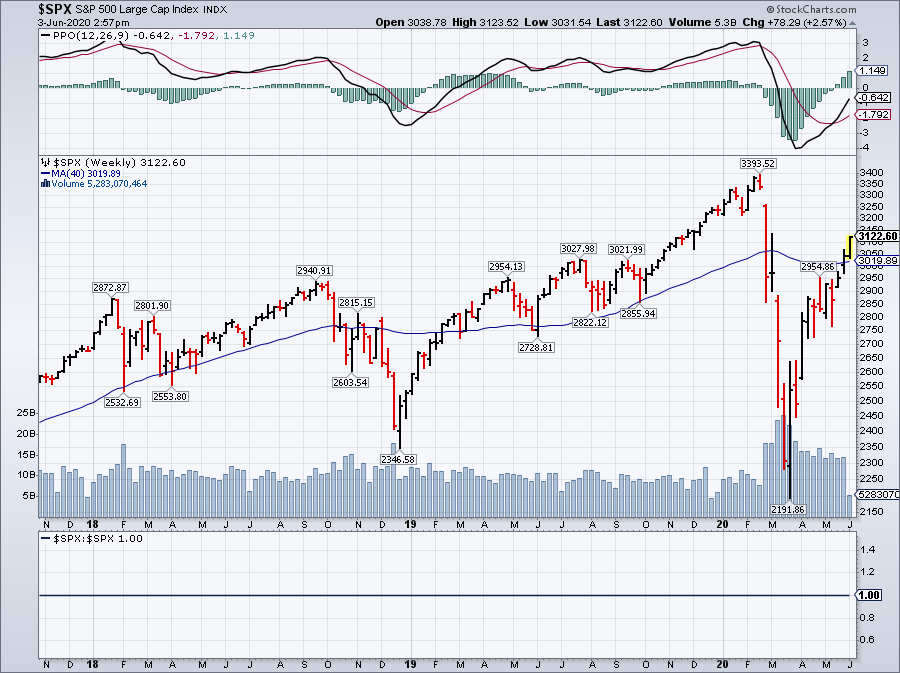
S & P 500

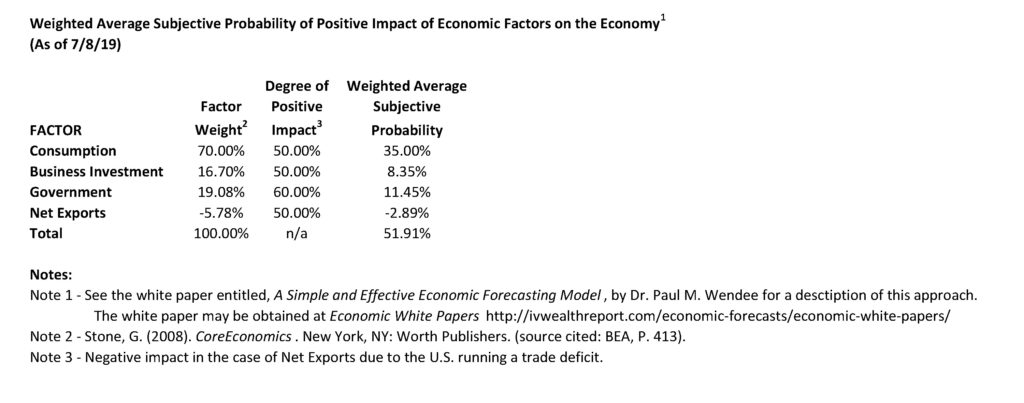
Simple and Effective Economic Forecasting Model

Notes (GDP Growth Chart):

  1. See the July 8, 2019 Commentary for an introduction to this model.
  2. Actual numbers 2007 through 2019; forecasted numbers thereafter.
  3. Normal GDP growth is typically in the 2% to 3% range.
  4. A recession is generally defined as two consecutive quarters of negative economic growth as measured by a country’s gross domestic product (GDP).

Announcements

Dr. Wendee spoke at the Investment Club of America’s annual economic summit, called Econosummit, on Sunday March 1, 2020 in Las Vegas.

Dr. Wendee attended the The National Due Diligence Alliance (TNDDA) investment banking conference, which was held March 6-8, 2020 at the Four Seasons Resort in Dallas, Texas. This is a conference held several times throughout the year for investment bankers and registered investment advisers to learn about new opportunities in the Alternative Investment asset classes.

TNDDA Meeting in Dallas, Texas

We have been researching the use of crowdsourcing for investment ideas. We will be sending a survey out in the next few weeks to get your input on the economy and the markets; and to get any investment ideas that you would like to share. We will compile this input and distribute the results to you and our other subscribers.

Dr. Wendee has been researching and writing a new theory of economics known as, The Value Creation Theory of the Economy (also known as, Intrinsinomics). The full paper on Intrinsinomics will be published in the near future.

Finance 3350: Personal Finance-Portfolio & Risk Management– Dr. Wendee started teaching Finance 3350 – Portfolio & Risk Management at California State University, Los Angeles (CSULA) starting January 2020. Dr. Wendee teaches courses in Management and Finance at CSULA.

Business 4970:Strategic Management – Dr. Wendee started teaching  Business 4970:Strategic Management  at California State University, Los Angeles (CSULA) starting January 2020. Dr. Wendee teaches courses in Management and Finance at CSULA.

Business 218 – Macroeconomics – Dr. Wendee started teaching Business 218 – Macroeconomics at California Baptist University (CBU) starting January 2020. Dr. Wendee teaches courses in Finance and Economics at CBU.

Dr. Wendee presented a paper on his new theory of economics known as, The Value Creation Theory of the Economy (also known as, Intrinsinomics), at the International Leadership Association’s annual global conference which was held in Ottawa, Canada last Fall.

Dr. Wendee is working on a financial planning modeling program which will be available in the near future. The modeling program is designed to assist anyone in creating a financial plan and is customizable for each person’s unique financial planning goals.

Intrinsic Value Wealth Creation pyramid

We always conclude our commentary with a discussion of the Intrinsic Value Wealth Creation Pyramid. The Intrinsic Value Wealth Creation Pyramid is designed to show some of the major categories for building wealth. It is the result of many years of study of the wealth building process; experience working with clients who have built considerable wealth; and my own personal experience building wealth. Newsletter subscribers should consult the Intrinsic Value Wealth Creation Pyramid as one of many useful investment tools while considering their investment plans.

The chart in this section is an expanded version of the Intrinsic Value Wealth Creation Pyramid Chart referenced in the Forbes.com article entitled, Nine Of The Best Ways To Build Wealth.

RESOURCES

See our Resources section for links to economic and other resources used in the preparation of this Commentary.
Posted in Economic & Business Chart Room, Economic Outlook, Entrepreneurship, Focus List, Investment Recommendations, Investments, Notes From The Field, Special Situations, Uncategorized, VDI/REEP, Visionary Ideas | Tagged , , , , , , , , , , , , , , , , , , , , , , , , | Comments Off on WEEKLY COMMENTARY March 9, 2020

WEEKLY COMMENTARY March 2, 2020

The Coronavirus, The Economy, and The Markets

I spoke at the Investment Club of America’s Economic Summit this past weekend. The title of my talk was, The Coronavirus, The Economy, and The Markets. In my talk, I summarized where I believe we are in terms of the economy and the markets given the worldwide spread of the coronavirus. The rapid spread of the coronavirus is significantly affecting the markets and investor confidence, as evidenced by last week’s market drop into correction territory. The spread of the virus is also beginning to have an impact on the U.S. and global economies. Please see my discussion below under Conclusions for my thoughts on where we currently stand on these fronts.

Economic and Investment Highlights

Last Week

Berkshire Hathaway underperformed the S&P 500 again last year. Berkshire has underperformed the market in the past few years.

The yield on the 10-year Treasury fell to an all-time low as investors flocked to safe haven assets like U.S. Treasuries.

Federal health authorities now expect a wider spread of the coronavirus in the U.S. and are preparing for a potential pandemic.

Some U.S. firms say they could lose as much as half of their annual revenue from China if the coronavirus epidemic extends through summer. Amazon sellers that built their businesses using Chinese manufacturing are experiences problems as Chinese factories are shutting down due to the coronavirus.

Trump said the risk to Americans from the coronavirus remains fairly low. He put Vice President Mike Pence in charge of the federal response to the virus. However, many countries are realizing that keeping the virus out of their countries is difficult in a connected world.

The coronavirus is disrupting supply chains, production, and sales across a wide array of industries.

All three major U.S. stock indexes declined into correction territory, defined as a drop of 10 percent or more from a recent peak. They also posted their biggest one-day drop.

A swarm of locusts has swept across more than 10 nations on two continents and put millions of Africans at risk of starvation.

U.S. stocks had their worst week since the financial crisis.

The Fed signaled it stands ready to cut rates to cushion the economy if necessary.

The Dow, the S&P 500, and the Nasdaq all fell for the week. The Dow was down 12.4%; the S&P 500 was down 11.49%; and the Nasdaq was down 10.5%. The 10-year treasury yield ended the week at 1.127%. Gold closed at $1,564.10 for the week.

The Week Ahead

This link takes you to Econoday’s Economic Calendar and Economic Events and Analysis which shows the upcoming economic reporting events scheduled in the week and months ahead.

Summary

Note: The comments that follow are derived from the economic indicators referenced in the Resources section of this newsletter and other sources in this report.

The Aruoba-Diebold-Scotti Business Conditions Index (ALS) has been trending up the last several weeks from having dipped in 2019. This is a positive indicator for the economy on a short-term basis.

The GDPNow model estimate for real GDP growth (seasonally adjusted annual rate) in the first quarter of 2020 is 2.7percent. This reading continues to support the ALS model assessment of an improving short-term economic environment.

The New York Fed Staff Nowcast stands at 1.4% for 2020:Q1.

The Chicago Fed National Activity Index (CFNAI) showed a decrease in economic activity in December. The Chicago Fed National Activity Index (CFNAI) was -0.25 in January, up from from -0.51 in December.

All told, these short-term economic indicators are a neutral to positive analysis for the economy, at least on a short-term basis.

Expectations that stock prices will rise over the next six months is now at 40.6% in the latest AAII Sentiment Survey. The historical average is 38.0% for the survey. 30.8% of the investors in the survey described their short-term outlook as neutral and 28.7% were bearish. Please see the AAII Sentiment Survey for the complete results.

The latest Gross output (GO) reading suggests moderate economic growth as we enter 2020.

On a longer-term basis, the forecasters in the Philadelphia Fed’s Survey of Professional Forecasters (as of February 14, 2019) predict real GDP will grow at an annual rate of 1.7 percent for the first quarter of 2020, 2.1 percent for the second quarter of 2020, 2.0 percent in the third quarter of 2020, 2.1 percent in the fourth quarter of 2020, and 2.2 percent in the first quarter of 2021. On an annual-average over annual-average basis, the forecasters predict real GDP to grow 2.0 percent in 2020, 2.0 percent in 2021, 2.0 percent in 2022 and 2.0 percent in 2023. The forecasters predict the unemployment rate will average 3.6 percent in 2020, 3.6 percent in 2021, 3.7 percent in 2022, and 3.9 percent in 2023.

For a more in-depth review and analysis of the economy, please see our mini-book on economic analysis and forecasting entitled: Simple and Effective Economic Forecasting.

Stock Market Valuations

Our estimates of the market valuations for two stock market indices, the Dow Jones Industrial Average (DJIA) and the Standard & Poor’s 500 (S&P 500), can be found in the file below:

Conclusion

We continue to believe the economy is in a stable but somewhat vulnerable state. Nonetheless, it has remained fairly strong. In fact, robust consumer spending and strong labor market conditions still give us confidence that the economy, now in its tenth year of expansion, can continue to grow. But we are cautious on this outlook. There are several reasons for our caution. U.S. business growth has been mixed. And global economic growth has been mixed as well. The new coronavirus is becoming a global economic threat, although it is still too early to tell how much of an effect it will ultimately have. Debt is at high levels for consumers, businesses, and government (at all levels). Finally, this is an election year that will likely have significant consequences either positively or negatively depending on the outcome of the elections. And of course, it is still too early to tell what the outcome of the elections will be.

With the steep drop in the markets last week, we are now in a market correction that has no immediate solution for the underlying cause (i.e., the coronavirus). Before last week’s drop, the market was very overvalued. But even with the drop in the market, it still is not really cheap. The PE ratio on the Dow is 19.73 and the PE ratio on the S&P 500 is 22.23.

So, the broad market remains overvalued, although the Dow Jones Industrial Average looks more fairly valued than the broad market. But that does not mean that a further market decline is imminent. Markets can and do stay overvalued for long periods of time. As discussed above and in the Economic and Investment Highlights section of this Commentary, we believe the economy is in a stable but vulnerable state. If the economy remains strong, the markets will likely remain strong. If the economy deteriorates, the markets may well correct. There are other events, such as the coronavirus, that could trigger a further market decline, of course, but economic conditions are the most likely and foreseeable events that could make that happen.

We believe it is important to maintain a long-term view toward investing. This means that you should continue building your investment portfolio using the Cassandra Stock Selection Model to select individual securities that offer growth and value opportunities.

Chart for Review and Thought

S & P 500

Simple and Effective Economic Forecasting Model

Notes (GDP Growth Chart):

  1. See the July 8, 2019 Commentary for an introduction to this model.
  2. Actual numbers 2007 through 2019; forecasted numbers thereafter.
  3. Normal GDP growth is typically in the 2% to 3% range.
  4. A recession is generally defined as two consecutive quarters of negative economic growth as measured by a country’s gross domestic product (GDP).

Announcements

Dr. Wendee spoke at the Investment Club of America’s annual economic summit, called Econosummit, on Sunday March 1, 2020 in Las Vegas.

We have been researching the use of crowdsourcing for investment ideas. We will be sending a survey out in the next few weeks to get your input on the economy and the markets; and to get any investment ideas that you would like to share. We will compile this input and distribute the results to you and our other subscribers.

Dr. Wendee has been researching and writing a new theory of economics known as, The Value Creation Theory of the Economy (also known as, Intrinsinomics). The full paper on Intrinsinomics will be published in the near future.

Finance 3350: Personal Finance-Portfolio & Risk Management– Dr. Wendee started teaching Finance 3350 – Portfolio & Risk Management at California State University, Los Angeles (CSULA) starting January 2020. Dr. Wendee teaches courses in Management and Finance at CSULA.

Business 4970:Strategic Management – Dr. Wendee started teaching  Business 4970:Strategic Management  at California State University, Los Angeles (CSULA) starting January 2020. Dr. Wendee teaches courses in Management and Finance at CSULA.

Business 218 – Macroeconomics – Dr. Wendee started teaching Business 218 – Macroeconomics at California Baptist University (CBU) starting January 2020. Dr. Wendee teaches courses in Finance and Economics at CBU.

Dr. Wendee presented a paper on his new theory of economics known as, The Value Creation Theory of the Economy (also known as, Intrinsinomics), at the International Leadership Association’s annual global conference which was held in Ottawa, Canada last Fall.

Dr. Wendee is working on a financial planning modeling program which will be available in the near future. The modeling program is designed to assist anyone in creating a financial plan and is customizable for each person’s unique financial planning goals.

Intrinsic Value Wealth Creation pyramid

We always conclude our commentary with a discussion of the Intrinsic Value Wealth Creation Pyramid. The Intrinsic Value Wealth Creation Pyramid is designed to show some of the major categories for building wealth. It is the result of many years of study of the wealth building process; experience working with clients who have built considerable wealth; and my own personal experience building wealth. Newsletter subscribers should consult the Intrinsic Value Wealth Creation Pyramid as one of many useful investment tools while considering their investment plans.

The chart in this section is an expanded version of the Intrinsic Value Wealth Creation Pyramid Chart referenced in the Forbes.com article entitled, Nine Of The Best Ways To Build Wealth.

RESOURCES

See our Resources section for links to economic and other resources used in the preparation of this Commentary.

Posted in Economic & Business Chart Room, Economic Outlook, Entrepreneurship, Focus List, Investment Recommendations, Investments, Notes From The Field, Special Situations, Uncategorized, VDI/REEP, Visionary Ideas | Tagged , , , , , , , , , , , , , , , , , , , , , , , , | Comments Off on WEEKLY COMMENTARY March 2, 2020

WEEKLY COMMENTARY February 24, 2020

Point and Figure Charting Revisited

With the global economy continuing to show signs of weakness as the coronavirus continues its spread, now is perhaps the time to revisit a tool that we have used successfully in the past to assess a stock market reentry or exit point. I wrote about this model in the Winter 2019 Intrinsic Value Wealth Report. The model that I am referring to is called the Point and Figure Charting Model. The current markets have not dropped enough, in our opinion, to consider a reentry yet; but should the markets continue their decline, the Point and Figure Charting Model may help investors decide when to get back into the markets. We will be monitoring this situation.

Economic and Investment Highlights

Last Week

In a sign that the coronavirus is beginning to have a negative effect on the global economy, Apple said that its revenue projections in the current quarter will be impacted.

Japan’s economy is facing the prospect of a recession due to the coronavirus’s effect on tourism and production.

China postponed its annual political conclave in an effort to help contain the coronavirus.

Highlighting the troubles facing traditional retailers, Walmart posted sluggish holiday sales.

The Dow, the S&P 500, and the Nasdaq all fell for the week. The Dow was down 1.4%; the S&P 500 was down 1.25%; and the Nasdaq was down 1.6%. The 10-year treasury yield ended the week at 1.470%. Gold closed at $1,644.60 for the week.

The Week Ahead

This link takes you to Econoday’s Economic Calendar and Economic Events and Analysis which shows the upcoming economic reporting events scheduled in the week and months ahead.

Summary

Note: The comments that follow are derived from the economic indicators referenced in the Resources section of this newsletter and other sources in this report.

The Aruoba-Diebold-Scotti Business Conditions Index (ALS) has been trending up the last several weeks from having dipped in 2019. This is a positive indicator for the economy on a short-term basis.

The GDPNow model estimate for real GDP growth (seasonally adjusted annual rate) in the first quarter of 2020 is 2.7percent. This reading continues to support the ALS model assessment of an improving short-term economic environment.

The New York Fed Staff Nowcast stands at 1.4% for 2020:Q1.

The Chicago Fed National Activity Index (CFNAI) showed a decrease in economic activity in December. The Chicago Fed National Activity Index (CFNAI) was -0.35 in December, down from +0.41 in November.

All told, these short-term economic indicators are a neutral to positive analysis for the economy, at least on a short-term basis.

Expectations that stock prices will rise over the next six months is now at 40.6% in the latest AAII Sentiment Survey. The historical average is 38.0% for the survey. 30.8% of the investors in the survey described their short-term outlook as neutral and 28.7% were bearish. Please see the AAII Sentiment Survey for the complete results.

The latest Gross output (GO) reading suggests moderate economic growth as we enter 2020.

On a longer-term basis, the forecasters in the Philadelphia Fed’s Survey of Professional Forecasters (as of February 14, 2019) predict real GDP will grow at an annual rate of 1.7 percent for the first quarter of 2020, 2.1 percent for the second quarter of 2020, 2.0 percent in the third quarter of 2020, 2.1 percent in the fourth quarter of 2020, and 2.2 percent in the first quarter of 2021. On an annual-average over annual-average basis, the forecasters predict real GDP to grow 2.0 percent in 2020, 2.0 percent in 2021, 2.0 percent in 2022 and 2.0 percent in 2023. The forecasters predict the unemployment rate will average 3.6 percent in 2020, 3.6 percent in 2021, 3.7 percent in 2022, and 3.9 percent in 2023.

For a more in-depth review and analysis of the economy, please see our mini-book on economic analysis and forecasting entitled: Simple and Effective Economic Forecasting.

Stock Market Valuations

Our estimates of the market valuations for two stock market indices, the Dow Jones Industrial Average (DJIA) and the Standard & Poor’s 500 (S&P 500), can be found in the file below:

Conclusion

We continue to believe the economy is in a stable but somewhat vulnerable state. Nonetheless, it has remained fairly strong. In fact, robust consumer spending and strong labor market conditions still give us confidence that the economy, now in its tenth year of expansion, can continue to grow. But we are cautious on this outlook. There are several reasons for our caution. U.S. business growth has been mixed. And global economic growth has been mixed as well. The new coronavirus is becoming a global economic threat, although it is still too early to tell how much of an effect it will ultimately have. Debt is at high levels for consumers, businesses, and government (at all levels). Finally, this is an election year that will likely have significant consequences either positively or negatively depending on the outcome of the elections. And of course, it is still too early to tell what the outcome of the elections will be.

The broad market remains overvalued, although the Dow Jones Industrial Average looks more fairly valued than the broad market. But that does not mean that a market correction is imminent. Markets can and do stay overvalued for long periods of time. As discussed above and in the Economic and Investment Highlights section of this Commentary, we believe the economy is in a stable but vulnerable state. If the economy remains strong, the markets will likely remain strong. If the economy deteriorates, the markets may well correct. There are other events that could trigger a market correction, of course, but economic conditions are the most likely and foreseeable events that could make that happen.

We believe it is important to maintain a long-term view toward investing. This means that you should continue building your investment portfolio using the Cassandra Stock Selection Model to select individual securities that offer growth and value opportunities.

Chart for Review and Thought

Industrial Production

Simple and Effective Economic Forecasting Model

Notes (GDP Growth Chart):

  1. See the July 8, 2019 Commentary for an introduction to this model.
  2. Actual numbers 2007 through 2019; forecasted numbers thereafter.
  3. Normal GDP growth is typically in the 2% to 3% range.
  4. A recession is generally defined as two consecutive quarters of negative economic growth as measured by a country’s gross domestic product (GDP).

Announcements

Dr. Wendee will be speaking at the Investment Club of America’s annual economic summit, called Econosummit, on Sunday March 1, 2020 in Las Vegas.

We have been researching the use of crowdsourcing for investment ideas. We will be sending a survey out in the next few weeks to get your input on the economy and the markets; and to get any investment ideas that you would like to share. We will compile this input and distribute the results to you and our other subscribers.

Dr. Wendee has been researching and writing a new theory of economics known as, The Value Creation Theory of the Economy (also known as, Intrinsinomics). The full paper on Intrinsinomics will be published in the near future.

Finance 3350: Personal Finance-Portfolio & Risk Management– Dr. Wendee started teaching Finance 3350 – Portfolio & Risk Management at California State University, Los Angeles (CSULA) starting January 2020. Dr. Wendee teaches courses in Management and Finance at CSULA.

Business 4970:Strategic Management – Dr. Wendee started teaching  Business 4970:Strategic Management  at California State University, Los Angeles (CSULA) starting January 2020. Dr. Wendee teaches courses in Management and Finance at CSULA.

Business 218 – Macroeconomics – Dr. Wendee started teaching Business 218 – Macroeconomics at California Baptist University (CBU) starting January 2020. Dr. Wendee teaches courses in Finance and Economics at CBU.

Dr. Wendee presented a paper on his new theory of economics known as, The Value Creation Theory of the Economy (also known as, Intrinsinomics), at the International Leadership Association’s annual global conference which was held in Ottawa, Canada last Fall.

Dr. Wendee is working on a financial planning modeling program which will be available in the near future. The modeling program is designed to assist anyone in creating a financial plan and is customizable for each person’s unique financial planning goals.

Intrinsic Value Wealth Creation pyramid

We always conclude our commentary with a discussion of the Intrinsic Value Wealth Creation Pyramid. The Intrinsic Value Wealth Creation Pyramid is designed to show some of the major categories for building wealth. It is the result of many years of study of the wealth building process; experience working with clients who have built considerable wealth; and my own personal experience building wealth. Newsletter subscribers should consult the Intrinsic Value Wealth Creation Pyramid as one of many useful investment tools while considering their investment plans.

The chart in this section is an expanded version of the Intrinsic Value Wealth Creation Pyramid Chart referenced in the Forbes.com article entitled, Nine Of The Best Ways To Build Wealth.

RESOURCES

See our Resources section for links to economic and other resources used in the preparation of this Commentary.

Posted in Economic & Business Chart Room, Economic Outlook, Entrepreneurship, Focus List, Investment Recommendations, Investments, Notes From The Field, Special Situations, Uncategorized, VDI/REEP, Visionary Ideas | Tagged , , , , , , , , , , , , , , , , , , , , , , , , | Comments Off on WEEKLY COMMENTARY February 24, 2020

WEEKLY COMMENTARY February 17, 2020

Latest Survey of Professional Forecasters forecast shows a stronger economy in 2020

The Federal Reserve Bank of Philadelphia released its latest Survey of Professional Forecasters on Friday. The forecasters see a stronger U.S. economy in 2020 in this forecast than they did in their last forecast in November. As detailed in the discussion of this forecast below, both economic output and the jobs situation in 2020 look stronger than they did three months ago.

Economic and Investment Highlights

Last Week

Trump released a proposed $4.8 trillion budget that proposes steep cuts in social welfare programs and foreign aid; and increases veterans and defense spending.

T-Mobile’s takeover of Sprint was approved.

Credit card debt in the U.S. was at a record $930 billion in last year’s Q4. Some card holders are showing signs of being in trouble.

OPEC expects the impact of the coronavirus will depress global oil demand.

China is taking measures such as tax relief in an effort to stabilize its economy in the midst of the coronavirus outbreak.

McClatchy, the second largest U.S. newspaper group, filed for bankruptcy protection.

The U.S. and the Taliban agreed to the first step of a peace deal.

Europe’s trade surplus with the U.S. hit a record in 2019.

U.S. Consumer spending picked up slightly in January.

Business activity slowed slightly in January.

The Dow, the S&P 500, and the Nasdaq all closed up at least 1% for the week. The 10-year treasury yield ended the week at 1.587%. Gold closed at $1,582.70 for the week.

The Week Ahead

This link takes you to Econoday’s Economic Calendar and Economic Events and Analysis which shows the upcoming economic reporting events scheduled in the week and months ahead.

Summary

Note: The comments that follow are derived from the economic indicators referenced in the Resources section of this newsletter and other sources in this report.

The Aruoba-Diebold-Scotti Business Conditions Index (ALS) has been trending up the last several weeks from having dipped in 2019. This is a positive indicator for the economy on a short-term basis.

The GDPNow model estimate for real GDP growth (seasonally adjusted annual rate) in the first quarter of 2020 is 2.7 percent. This reading continues to support the ALS model assessment of an improving short-term economic environment.

The New York Fed Staff Nowcast stands at 1.4% for 2020:Q1.

The Chicago Fed National Activity Index (CFNAI) showed a decrease in economic activity in December. The Chicago Fed National Activity Index (CFNAI) was -0.35 in December, down from +0.41 in November.

All told, these short-term economic indicators are a neutral to positive analysis for the economy, at least on a short-term basis.

Expectations that stock prices will rise over the next six months is now at 40.6% in the latest AAII Sentiment Survey. The historical average is 38.0% for the survey. 30.8% of the investors in the survey described their short-term outlook as neutral and 28.7% were bearish. Please see the AAII Sentiment Survey for the complete results.

The latest Gross output (GO) reading suggests moderate economic growth as we enter 2020.

On a longer-term basis, the forecasters in the Philadelphia Fed’s Survey of Professional Forecasters (as of February 14, 2019) predict real GDP will grow at an annual rate of 1.7 percent for the first quarter of 2020, 2.1 percent for the second quarter of 2020, 2.0 percent in the third quarter of 2020, 2.1 percent in the fourth quarter of 2020, and 2.2 percent in the first quarter of 2021. On an annual-average over annual-average basis, the forecasters predict real GDP to grow 2.0 percent in 2020, 2.0 percent in 2021, 2.0 percent in 2022 and 2.0 percent in 2023. The forecasters predict the unemployment rate will average 3.6 percent in 2020, 3.6 percent in 2021, 3.7 percent in 2022, and 3.9 percent in 2023.

For a more in-depth review and analysis of the economy, please see our mini-book on economic analysis and forecasting entitled: Simple and Effective Economic Forecasting.

Stock Market Valuations

Our estimates of the market valuations for two stock market indices, the Dow Jones Industrial Average (DJIA) and the Standard & Poor’s 500 (S&P 500), can be found in the file below:

Conclusion

We continue to believe the economy is in a stable but somewhat vulnerable state. Nonetheless, it has remained fairly strong. In fact, robust consumer spending and strong labor market conditions still give us confidence that the economy, now in its tenth year of expansion, can continue to grow. But we are cautious on this outlook. There are several reasons for our caution. U.S. business growth has been mixed. And global economic growth has been mixed as well. The new coronavirus is becoming a global economic threat, although it is still too early to tell how much of an effect it will ultimately have. Debt is at high levels for consumers, businesses, and government (at all levels). Finally, this is an election year that will likely have significant consequences either positively or negatively depending on the outcome of the elections. And of course, it is still too early to tell what the outcome of the elections will be.

The broad market remains overvalued, although the Dow Jones Industrial Average looks more fairly valued than the broad market. But that does not mean that a market correction is imminent. Markets can and do stay overvalued for long periods of time. As discussed above and in the Economic and Investment Highlights section of this Commentary, we believe the economy is in a stable but vulnerable state. If the economy remains strong, the markets will likely remain strong. If the economy deteriorates, the markets may well correct. There are other events that could trigger a market correction, of course, but economic conditions are the most likely and foreseeable events that could make that happen.

We believe it is important to maintain a long-term view toward investing. This means that you should continue building your investment portfolio using the Cassandra Stock Selection Model to select individual securities that offer growth and value opportunities.

Chart for Review and Thought

Unemployment Rate

Simple and Effective Economic Forecasting Model

Notes (GDP Growth Chart):

  1. See the July 8, 2019 Commentary for an introduction to this model.
  2. Actual numbers 2007 through Q1 2019; forecasted numbers thereafter.
  3. Normal GDP growth is typically in the 2% to 3% range.
  4. A recession is generally defined as two consecutive quarters of negative economic growth as measured by a country’s gross domestic product (GDP).

Announcements

We have been researching the use of crowdsourcing for investment ideas. We will be sending a survey out in the next few weeks to get your input on the economy and the markets; and to get any investment ideas that you would like to share. We will compile this input and distribute the results to you and our other subscribers.

Dr. Wendee has been researching and writing a new theory of economics known as, The Value Creation Theory of the Economy (also known as, Intrinsinomics). The full paper on Intrinsinomics will be published in the near future.

Finance 3350: Personal Finance-Portfolio & Risk Management– Dr. Wendee started teaching Finance 3350 – Portfolio & Risk Management at California State University, Los Angeles (CSULA) starting January 2020. Dr. Wendee teaches courses in Management and Finance at CSULA.

Business 4970:Strategic Management – Dr. Wendee started teaching  Business 4970:Strategic Management  at California State University, Los Angeles (CSULA) starting January 2020. Dr. Wendee teaches courses in Management and Finance at CSULA.

Business 218 – Macroeconomics – Dr. Wendee started teaching Business 218 – Macroeconomics at California Baptist University (CBU) starting January 2020. Dr. Wendee teaches courses in Finance and Economics at CBU.

Dr. Wendee presented a paper on his new theory of economics known as, The Value Creation Theory of the Economy (also known as, Intrinsinomics), at the International Leadership Association’s annual global conference which was held in Ottawa, Canada last Fall.

Dr. Wendee is working on a financial planning modeling program which will be available in the near future. The modeling program is designed to assist anyone in creating a financial plan and is customizable for each person’s unique financial planning goals.

Intrinsic Value Wealth Creation pyramid

We always conclude our commentary with a discussion of the Intrinsic Value Wealth Creation Pyramid. The Intrinsic Value Wealth Creation Pyramid is designed to show some of the major categories for building wealth. It is the result of many years of study of the wealth building process; experience working with clients who have built considerable wealth; and my own personal experience building wealth. Newsletter subscribers should consult the Intrinsic Value Wealth Creation Pyramid as one of many useful investment tools while considering their investment plans.

The chart in this section is an expanded version of the Intrinsic Value Wealth Creation Pyramid Chart referenced in the Forbes.com article entitled, Nine Of The Best Ways To Build Wealth.Intrinsic.

RESOURCES

See our Resources section for links to economic and other resources used in the preparation of this Commentary.

Posted in Economic & Business Chart Room, Economic Outlook, Entrepreneurship, Focus List, Investment Recommendations, Investments, Notes From The Field, Special Situations, Uncategorized, VDI/REEP, Visionary Ideas | Tagged , , , , , , , , , , , , , , , , , , , , , , , , | Comments Off on WEEKLY COMMENTARY February 17, 2020

WEEKLY COMMENTARY February 10, 2020

Too Early To Tell…

Bernie Sanders is ahead in the Democratic polls and the stock market is setting all-time highs. What is happening here? The simple answer is that it is too early to tell the outcome of the Democratic race – let alone the November elections. And at the time of this writing, Iowa still has not declared a winner! Stay tuned…at some point the stock market will start reacting. But for now, it is still too early to tell.

Economic and Investment Highlights

Last Week

The coronavirus continued to worsen and has closed China to the rest of the world.

The Kansas City Chiefs beat the San Francisco 49ers in Super Bowl LIV.

Oil prices slid to bear market territory over fears of a global economic slowdown due to the coronavirus.

Global manufacturing seems to be steadying after a long slowdown; but fresh concerns about its health have arisen due to the coronavirus.

Trump hailed the strong economy in his State of the Union address.

Trump was acquitted by the Senate in his impeachment trial.

The trade deficit narrowed in 2019 for the first time in six years.

Job gains again showed strength in January, with 225,000 jobs added and wages climbing 3.1% from a year earlier.

The Dow closed up 3.0% for the week. The S&P 500 closed up 3.17% and the Nasdaq closed up 4.0%. The 10-year treasury yield ended the week at 1.578%.

The Week Ahead

This link takes you to Econoday’s Economic Calendar and Economic Events and Analysis which shows the upcoming economic reporting events scheduled in the week and months ahead.

Summary

Note: The comments that follow are derived from the economic indicators referenced in the Resources section of this newsletter and other sources in this report.

The Aruoba-Diebold-Scotti Business Conditions Index (ALS) has been trending up the last several weeks and is now comfortably above the zero line. This is a very positive indicator for the economy on a short-term basis.

The GDPNow model estimate for real GDP growth (seasonally adjusted annual rate) in the first quarter of 2020 is 2.7 percent. This reading continues to support the ALS model assessment of an improving short-term economic environment.

The New York Fed Staff Nowcast stands at 1.7% for 2020:Q1.

The Chicago Fed National Activity Index (CFNAI) showed a decrease in economic activity in December. The Chicago Fed National Activity Index (CFNAI) was -0.35 in December, down from +0.41 in November.

All told, these short-term economic indicators are a neutral to positive analysis for the economy, at least on a short-term basis.

Expectations that stock prices will rise over the next six months is now at 33.9% in the latest AAII Sentiment Survey. The historical average is 38.0% for the survey. 30.9% of the investors in the survey described their short-term outlook as neutral and 35.2% were bearish. Please see the AAII Sentiment Survey for the complete results.

The latest Gross output (GO) reading suggests moderate economic growth as we enter 2020.

On a longer-term basis, the forecasters in the Philadelphia Fed’s Survey of Professional Forecasters (as of November 15, 2019) predict real GDP will grow at an annual rate of 1.7 percent for the fourth quarter of 2019, 1.9 percent for the first quarter of 2020, 1.7 percent in the second quarter of 2020, 1.7 percent in the third quarter of 2020, 1.9 percent in the fourth quarter of 2020. On an annual-average over annual-average basis, the forecasters predict real GDP to grow 2.3 percent in 2019, 1.8 percent in 2020, 2.0 percent in 2021 and 2.0 percent in 2022. The forecasters predict the unemployment rate will average 3.7 percent in 2019, 3.7 percent in 2020, 3.7 percent in 2021, and 3.9 percent in 2022.

For a more in-depth review and analysis of the economy, please see our mini-book on economic analysis and forecasting entitled: Simple and Effective Economic Forecasting.

Stock Market Valuations

Our estimates of the market valuations for two stock market indices, the Dow Jones Industrial Average (DJIA) and the Standard & Poor’s 500 (S&P 500), can be found in the file below:

Conclusion

We continue to believe the economy is in a stable but somewhat vulnerable state. Nonetheless, it has remained fairly strong. In fact, robust consumer spending and strong labor market conditions still give us confidence that the economy, now in its tenth year of expansion, can continue to grow. But we are cautious on this outlook! There are several reasons for our caution. U.S. business growth has been mixed. And global economic growth has been mixed as well. The new coronavirus is becoming a global economic threat, although it is still too early to tell how much of an effect it will ultimately have. Debt is at high levels for consumers, businesses, and government (at all levels). Finally, this is an election year that will likely have significant consequences either positively or negatively depending on the outcome of the elections. And of course, it is still too early to tell what the outcome of the elections will be.

The broad market remains overvalued, although the Dow Jones Industrial Average looks more fairly valued than the broad market. But that does not mean that a market correction is imminent. Markets can and do stay overvalued for long periods of time. As discussed above and in the Economic and Investment Highlights section of this Commentary, we believe the economy is in a stable but vulnerable state. If the economy remains strong, the markets will likely remain strong. If the economy deteriorates, the markets may well correct. There are other events that could trigger a market correction, of course, but economic conditions are the most likely and foreseeable events that could make that happen.

We believe it is important to maintain a long-term view toward investing. This means that you should continue building your investment portfolio using the Cassandra Stock Selection Model to select individual securities that offer growth and value opportunities.

Chart for Review and Thought

Real GDP

Simple and Effective Economic Forecasting Model

Notes (GDP Growth Chart):

  1. See the July 8, 2019 Commentary for an introduction to this model.
  2. Actual numbers 2007 through Q1 2019; forecasted numbers thereafter.
  3. Normal GDP growth is typically in the 2% to 3% range.
  4. A recession is generally defined as two consecutive quarters of negative economic growth as measured by a country’s gross domestic product (GDP).

Announcements

We have been researching the use of crowdsourcing for investment ideas. We will be sending a survey out in the next few weeks to get your input on the economy and the markets; and to get any investment ideas that you would like to share. We will compile this input and distribute the results to you and our other subscribers.

Dr. Wendee has been researching and writing a new theory of economics known as, The Value Creation Theory of the Economy (also known as, Intrinsinomics). The full paper on Intrinsinomics will be published in the near future.

Finance 3350: Personal Finance-Portfolio & Risk Management– Dr. Wendee started teaching Finance 3350 – Portfolio & Risk Management at California State University, Los Angeles (CSULA) starting January 2020. Dr. Wendee teaches courses in Management and Finance at CSULA.

Business 4970:Strategic Management – Dr. Wendee started teaching  Business 4970:Strategic Management  at California State University, Los Angeles (CSULA) starting January 2020. Dr. Wendee teaches courses in Management and Finance at CSULA.

Business 218 – Macroeconomics – Dr. Wendee started teaching Business 218 – Macroeconomics at California Baptist University (CBU) starting January 2020. Dr. Wendee teaches courses in Finance and Economics at CBU.

Dr. Wendee presented a paper on his new theory of economics known as, The Value Creation Theory of the Economy (also known as, Intrinsinomics), at the International Leadership Association’s annual global conference which was held in Ottawa, Canada last Fall.

Dr. Wendee is working on a financial planning modeling program which will be available in the near future. The modeling program is designed to assist anyone in creating a financial plan and is customizable for each person’s unique financial planning goals.

Intrinsic Value Wealth Creation pyramid

We always conclude our commentary with a discussion of the Intrinsic Value Wealth Creation Pyramid. The Intrinsic Value Wealth Creation Pyramid is designed to show some of the major categories for building wealth. It is the result of many years of study of the wealth building process; experience working with clients who have built considerable wealth; and my own personal experience building wealth. Newsletter subscribers should consult the Intrinsic Value Wealth Creation Pyramid as one of many useful investment tools while considering their investment plans.

The chart in this section is an expanded version of the Intrinsic Value Wealth Creation Pyramid Chart referenced in the Forbes.com article entitled, Nine Of The Best Ways To Build Wealth.

RESOURCES

See our Resources section for links to economic and other resources used in the preparation of this Commentary.

Posted in Economic & Business Chart Room, Economic Outlook, Entrepreneurship, Focus List, Investment Recommendations, Investments, Notes From The Field, Special Situations, Uncategorized, VDI/REEP, Visionary Ideas | Tagged , , , , , , , , , , , , , , , , , , , , , , , , | Comments Off on WEEKLY COMMENTARY February 10, 2020

WEEKLY COMMENTARY January 6, 2020

The Deadweight Loss of California’s 1,200 New Laws

California started the new year with almost 1,200 new laws. The laws included coverage on issues ranging from gun control, high interest rate loans, protection for exotic animals, and increased pay for low wage jobs. Most of these new laws reflect the liberal perspective of California’s Democratic majority.

Dr. Wendee has been researching and writing a new theory of economics known as, The Value Creation Theory of the Economy (also known as, Intrinsinomics). In this theory, Dr. Wendee shows how excessive government regulation, such as that found in California, creates a deadweight loss which reduces economic prosperity. The full paper on Intrinsinomics will be published in the near future.

Economic and Investment Highlights

Last Week

Many online retailers are struggling to adjust to taxes after the Supreme Court gave states the right to tax online transactions.

Many homeowners are taking cash-out mortgages and are paying higher interest rates to do so.

Stocks of many of the most hyped IPOs of 2019 are trading before their last private market valuations.

A few of the big tech companies’ stocks are driving the stock market indexes. 2019 was one of the best years for stock market indexes around the world in a decade.

2019 was the fourth best year for mergers and acquisitions on a global basis. Total 2019 M&A activity was $3.8 trillion (through December 27th).

North American oil and gas companies have more than $200 billion of debt maturing over the next four years.

California started the new year with almost 1,200 new laws.

China loosened its monetary policy.

Manufacturing in the U.S. and Asia stabilized, while manufacturing in Europe continued to slump.

A survey of U.S. CEOs showed fear of a recession as the number one concern going into the new year.

The U.S. launched an airstrike in Iraq which killed a top Iranian general and an Iraqi paramilitary commander.

U.S. auto sales slowed in 2019. Auto executives expect a continued slowdown in 2020.

Former Fed Chair Ben Bernanke said he believes the Fed has sufficient tools to counter a potential recession.

U.S. stock mutual funds posted a 28.3% average gain in 2019.

The Dow Jones Industrial Average and the S&P 500 both fell from records last week, while the Nasdaq rose slightly.  The Dow fell 0.04%, the S&P 500 fell 0.16%; and the Nasdaq rose 0.2%. The 10-year treasury yield ended the week at 1.787%.

The Week Ahead

This link takes you to Econoday’s Economic Calendar and Economic Events and Analysis which shows the upcoming economic reporting events scheduled in the week and months ahead.

Summary

Note: The comments that follow are derived from the economic indicators referenced in the Resources section of this newsletter and other sources in this report.

The Aruoba-Diebold-Scotti Business Conditions Index (ALS) has been trending up the last several weeks and is now comfortably above the zero line, although the ALS Index dipped slightly this past week. This is a very positive indicator for the economy on a short-term basis.

The GDPNow model estimate for real GDP growth (seasonally adjusted annual rate) in the fourth quarter of 2019 is 2.3 percent. This reading continues to support the ALS model assessment of an improving short-term economic environment.

The New York Fed Staff Nowcast stands at 1.2% for both 2019:Q4 and 2020:Q1..

The Chicago Fed National Activity Index (CFNAI) showed an increase in economic activity in November. The Chicago Fed National Activity Index (CFNAI) was +0.56 in November, up from –0.76 in October.

All told, these short-term economic indicators are a neutral to positive analysis for the economy, at least on a short-term basis.

Expectations that stock prices will rise over the next six months is now at 37.2% in the latest AAII Sentiment Survey. The historical average is 38.5% for the survey. 40.9% of the investors in the survey described their short-term outlook as neutral and 21.9% were bearish. Please see the AAII Sentiment Survey for the complete results.

The latest Gross output (GO) reading suggests moderate economic growth as we enter 2020.

On a longer-term basis, the forecasters in the Philadelphia Fed’s Survey of Professional Forecasters (as of November 15, 2019) predict real GDP will grow at an annual rate of 1.7 percent for the fourth quarter of 2019, 1.9 percent for the first quarter of 2020, 1.7 percent in the second quarter of 2020, 1.7 percent in the third quarter of 2020, 1.9 percent in the fourth quarter of 2020. On an annual-average over annual-average basis, the forecasters predict real GDP to grow 2.3 percent in 2019, 1.8 percent in 2020, 2.0 percent in 2021 and 2.0 percent in 2022. The forecasters predict the unemployment rate will average 3.7 percent in 2019, 3.7 percent in 2020, 3.7 percent in 2021, and 3.9 percent in 2022.

For a more in-depth review and analysis of the economy, please see our mini-book on economic analysis and forecasting entitled: Simple and Effective Economic Forecasting.

Stock Market Valuations

Our estimates of the market valuations for two stock market indices, the Dow Jones Industrial Average (DJIA) and the Standard & Poor’s 500 (S&P 500), can be found in the file below:

Conclusion

We continue to believe the economy is in a stable but somewhat vulnerable state. Recent economic reports have been showing signs of strengthening, particularly in the business sector, which had been weakening for some time. Overall, the economy has remained very strong. In fact, the extremely strong first and second quarter GDP showing, along with a better than expected 1.9% third quarter growth in GDP, and the strong labor market conditions give us confidence that the economy, now in its tenth year of expansion, can continue to grow. But we are cautious on this outlook! Please see our complete Economic and Investment Review in the Spring 2019 quarterly issue of the Intrinsic Value Wealth Report Newsletter.

The broad market remains overvalued, although the Dow Jones Industrial Average looks more fairly valued than the broad market. But that does not mean that a market correction is imminent. Markets can and do stay overvalued for long periods of time. As discussed above and in the Economic and Investment Highlights section of this Commentary, we believe the economy is in a stable but somewhat vulnerable state. If the economy remains strong, the markets will likely remain strong. If the economy deteriorates, the markets may well correct. There are other events that could trigger a market correction, of course, but economic conditions are the most likely and foreseeable events that could make that happen.

We believe it is important to maintain a long-term view toward investing. This means that you should continue building your investment portfolio using the Cassandra Stock Selection Model to select individual securities that offer growth and value opportunities.

Chart for Review and Thought

Employment

Simple and Effective Economic Forecasting Model

Notes (GDP Growth Chart):

  1. See the July 8, 2019 Commentary for an introduction to this model.
  2. Actual numbers 2007 through Q1 2019; forecasted numbers thereafter.
  3. Normal GDP growth is typically in the 2% to 3% range.
  4. A recession is generally defined as two consecutive quarters of negative economic growth as measured by a country’s gross domestic product (GDP).

Announcements

We have been researching the use of crowdsourcing for investment ideas. We will be sending a survey out in the next few weeks to get your input on the economy and the markets; and to get any investment ideas that you would like to share. We will compile this input and distribute the results to you and our other subscribers.

Dr. Wendee has been researching and writing a new theory of economics known as, The Value Creation Theory of the Economy (also known as, Intrinsinomics). The full paper on Intrinsinomics will be published in the near future.

Finance 3350: Personal Finance-Portfolio & Risk Management – Dr. Wendee will be teaching Finance 3350 – Portfolio & Risk Management at California State University, Los Angeles (CSULA) starting January 2020. Dr. Wendee teaches courses in Management and Finance at CSULA.

Business 4970:Strategic Management – Dr. Wendee will be teaching  Business 4970:Strategic Management  at California State University, Los Angeles (CSULA) starting January 2020. Dr. Wendee teaches courses in Management and Finance at CSULA.

Business 218 – Macroeconomics – Dr. Wendee will be teaching Business 218 – Macroeconomics at California Baptist University (CBU) starting January 2020. Dr. Wendee teaches courses in Finance and Economics at CBU.

Dr. Wendee presented a paper on his new theory of economics known as, The Value Creation Theory of the Economy (also known as, Intrinsinomics), at the International Leadership Association’s annual global conference which was held in Ottawa, Canada last Fall.

Intrinsic Value Wealth Creation pyramid

We always conclude our commentary with a discussion of the Intrinsic Value Wealth Creation Pyramid. The Intrinsic Value Wealth Creation Pyramid is designed to show some of the major categories for building wealth. It is the result of many years of study of the wealth building process; experience working with clients who have built considerable wealth; and my own personal experience building wealth. Newsletter subscribers should consult the Intrinsic Value Wealth Creation Pyramid as one of many useful investment tools while considering their investment plans.

The chart in this section is an expanded version of the Intrinsic Value Wealth Creation Pyramid Chart referenced in the Forbes.com article entitled, Nine Of The Best Ways To Build Wealth.

RESOURCES

See our Resources section for links to economic and other resources used in the preparation of this Commentary.
Posted in Economic & Business Chart Room, Economic Outlook, Entrepreneurship, Focus List, Investment Recommendations, Investments, Notes From The Field, Special Situations, Uncategorized, VDI/REEP, Visionary Ideas | Tagged , , , , , , , , , , , , , , , , , , , , , , , , | Comments Off on WEEKLY COMMENTARY January 6, 2020

WEEKLY COMMENTARY August 12, 2019

Are Negative Interest Rates a Possibility in the U.S.?

Are negative interest rates a possibility in the U.S.? It is possible, though not likely. Negative interest rates are a rare phenomenon where investors are in effect paying to have their money invested, or in reality stored for them, instead of getting a return on their investment. This is a relatively new phenomenon that has been observed in some countries around the world, most notably Europe and Japan. There is currently around $15 trillion of government debt around the world that has negative interest rates. Many of the holders of debt with negative interest rates are institutions that must hold government debt due to regulations requiring them to do so. While the U.S. has so far avoided negative interest rates, as interest rates in the U.S. continue to decline, some investors fear that negative interest rates could come to the U.S. We can only wait and see if this happens.

Economic and Investment Highlights

Last Week

The yield last week on the three-month treasury exceeded the yield on the ten-year treasury by the widest margin since 2007, a phenomenon known as an inverted yield curve (see chart below in Charts for Review and Thought). The ten-year treasury ended the week at 1.731%, a multiyear low. The inverted yield curve is an often-watched recession indicator. A major force driving these yield declines is the ongoing trade tensions which give rise to concerns of a slowing worldwide economy. When investors have such concerns, they often buy relatively safe assets such as U.S. treasury bonds, which increases these bonds’ prices and drives their yields down.

Central banks in India, Thailand, and New Zealand aggressively cut rates.

Gold prices rose above $1500 per troy ounce, the first time in six years.

There is evidence that inflated bond ratings are back in vogue, as competition heats up in the credit rating industry. Inflated bond ratings were blamed as being a driver of the financial crisis.

Mortgage rates have declined to their lowest levels in three years, prompting a wave of mortgage refinancing.

The housing market in some small and mid-size cities such as Boise, Idaho and South Bend, Indiana, has been on an upswing. This is largely a result of shrinking inventory in these less-expensive markets.

The Dow Jones Industrial Average, the S&P 500 and the Nasdaq all fell last week, 0.7% for the Dow, 0.46% for the S&P 500 and 0.6% for the Nasdaq. The 10-year treasury yield ended the week at 1.731%.

The Week Ahead

This link takes you to Econoday’s Economic Calendar and Economic Events and Analysis which shows the upcoming economic reporting events scheduled in the week and months ahead.

Summary

Note: The comments that follow are derived from the economic indicators referenced in the Resources section of this newsletter and other sources in this report.

The Aruoba-Diebold-Scotti Business Conditions Index (ALS) has been trending up the last several weeks and is now very close the zero line. The ALS Index was relatively flat this past week. This is a very positive indicator for the economy on a short-term basis.

The GDPNow model estimate for real GDP growth (seasonally adjusted annual rate) in the third quarter of 2019 is 1.9 percent. This slight adjustment continues to support the ALS model assessment of an improving short-term economic environment.

The New York Fed Staff Nowcast stands at 1.6% for 2019:Q3.

The Chicago Fed National Activity Index (CFNAI) showed an increase in economic activity in May. The Chicago Fed National Activity Index (CFNAI) was –0.02 in June, up slightly from –0.03 in May.

All told, these short-term economic indicators are a neutral to positive analysis for the economy, at least on a short-term basis.

Expectations that stock prices will rise over the next six months is now at 21.7%, an unusually low level, in the latest AAII Sentiment Survey. The historical average is 38.5% for the survey. Nearly half of the investors in the survey described their short-term outlook as bearish. Please see the AAII Sentiment Survey for the complete results.

The latest Gross output (GO) reading suggests slow economic growth as we enter 2019.

On a longer-term basis, the forecasters in the Philadelphia Fed’s Survey of Professional Forecasters (as of August 9, 2019) predict real GDP will grow at an annual rate of 1.8 percent this quarter, 2.0 percent next quarter, and 1.9 percent in the first quarter of 2020. On an annual-average over annual-average basis, the forecasters predict real GDP to grow 2.3 percent in 2019, 1.9 percent in 2020, 2.0 percent in 2021 and 2.1 percent in 2022. The forecasters predict the unemployment rate will average 3.7 percent in 2019, 3.6 percent in 2020, 3.9 percent in 2021, and 4.0 percent in 2022.

For a more in-depth review and analysis of the economy, please see our mini-book on economic analysis and forecasting entitled: Simple and Effective Economic Forecasting.

Stock Market Valuations

Our estimates of the market valuations for two stock market indices, the Dow Jones Industrial Average (DJIA) and the Standard & Poor’s 500 (S&P 500), can be found in the file below:

Conclusion

We continue to believe the economy is in a stable but now more vulnerable state. Recent economic reports have been showing signs of weakening. Nonetheless, the economy has remained fairly strong. In fact, the extremely strong first and second GDP showing and the strong labor market conditions still give us confidence that the economy, now in its tenth year of expansion, can continue to grow. But we are cautious on this outlook! Please see our complete Economic and Investment Review in the Spring 2019 quarterly issue of the Intrinsic Value Wealth Report Newsletter.

The broad market remains overvalued, although the Dow Jones Industrial Average looks more fairly valued than the broad market. But that does not mean that a market correction is imminent. Markets can and do stay overvalued for long periods of time. As discussed above and in the Economic and Investment Highlights section of this Commentary, we believe the economy is in a stable but vulnerable state that is showing signs of weakening. If the economy remains strong, the markets will likely remain strong. If the economy deteriorates, the markets may well correct. There are other events that could trigger a market correction, of course, but economic conditions are the most likely and foreseeable events that could make that happen.

We believe it is important to maintain a long-term view toward investing. This means that you should continue building your investment portfolio using the Cassandra Stock Selection Model to select individual securities that offer growth and value opportunities.

Chart for Review and Thought

Inverted Yield Curve

Simple and Effective Economic Forecasting Model

Notes (GDP Growth Chart):

  1. See the July 8, 2019 Commentary for an introduction to this model.
  2. Actual numbers 2007 through Q1 2019; forecasted numbers thereafter.
  3. Normal GDP growth is typically in the 2% to 3% range.
  4. A recession is generally defined as two consecutive quarters of negative economic growth as measured by a country’s gross domestic product (GDP).

Announcements

We have been researching the use of crowdsourcing for investment ideas. We will be sending a survey out in the next few weeks to get your input on the economy and the markets; and to get any investment ideas that you would like to share. We will compile this input and distribute the results to you and our other subscribers.

Business 539 – Financial Management – On July 1, 2019, Dr. Wendee started teaching Business 539 – Financial Management at California Baptist University (CBU). Dr. Wendee teaches courses in Finance and Economics at CBU.

Management 3080 – Business Responsibility in Society – Dr. Wendee will be teaching Management 3080 – Business Responsibility in Society at California State University, Los Angeles (CSULA) starting August 22, 2019. Dr. Wendee teaches courses in Management at CSULA.

Business 217 – Microeconomics – Dr. Wendee will be teaching Business 217 – Microeconomics at California Baptist University (CBU) starting September 4, 2019. Dr. Wendee teaches courses in Finance and Economics at CBU.

Business 218 – Macroeconomics – Dr. Wendee will be teaching Business 218 – Macroeconomics at California Baptist University (CBU) starting September 4, 2019. Dr. Wendee teaches courses in Finance and Economics at CBU.

Dr. Wendee will be presenting a paper on enterprise value creation at the International Leadership Association’s annual global conference which is being held in Ottawa, Canada this Fall.

Intrinsic Value Wealth Creation pyramid

We always conclude our commentary with a discussion of the Intrinsic Value Wealth Creation Pyramid. The Intrinsic Value Wealth Creation Pyramid is designed to show some of the major categories for building wealth. It is the result of many years of study of the wealth building process; experience working with clients who have built considerable wealth; and my own personal experience building wealth. Newsletter subscribers should consult the Intrinsic Value Wealth Creation Pyramid as one of many useful investment tools while considering their investment plans.

The chart in this section is an expanded version of the Intrinsic Value Wealth Creation Pyramid Chart referenced in the Forbes.com article entitled, Nine Of The Best Ways To Build Wealth.

RESOURCES

See our Resources section for links to economic and other resources used in the preparation of this Commentary.
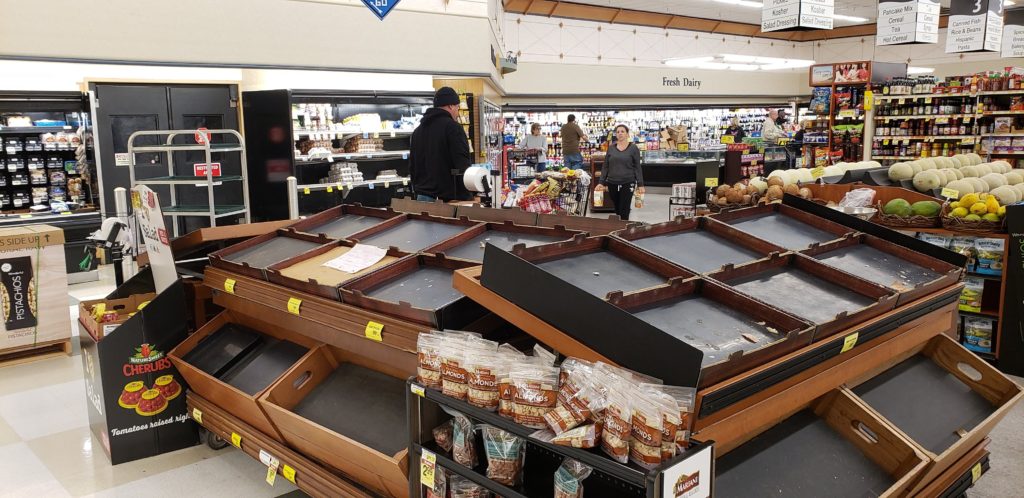
Posted in Economic & Business Chart Room, Economic Outlook, Entrepreneurship, Focus List, Investment Recommendations, Investments, Notes From The Field, Special Situations, Uncategorized, VDI/REEP, Visionary Ideas | Tagged , , , , , , , , , , , , , , , , , , , , , , , , | Comments Off on WEEKLY COMMENTARY August 12, 2019

WEEKLY COMMENTARY August 5, 2019

The Fed Cut Interest Rates by a Quarter of a Percentage Point in a Mid-Cycle Adjustment

The Fed cut interest rates by a quarter of a percentage point, the first rate cut since 2008. The Fed’s new short-term interest rate target range is now 2% to 2.25%. The Fed didn’t rule out future rate cuts but said there is nothing in the economic landscape that suggests future rate cuts will be necessary. They called this a “mid-cycle adjustment” and said they would continue to closely monitor the situation.

Economic and Investment Highlights

Last Week

It is reported that bond yields around the world have fallen so far that Chinese junk bonds have become attractive due to their higher yields.

Home ownership rates for younger Americans have fallen over the past decade.

Federal government borrowing is set to top $1 trillion for the second year in a row.

Corporate earnings have been showing more resilience that had been expected as the results have been coming in.

Personal consumption expenditures rose a seasonally adjusted 0.3% in June from May.

The PCE price index rose a seasonally adjusted 0.12% in June, a very moderate pace which kept the inflation rate on track to be below the Fed’s 2% inflation target.

The Conference Board’s index of consumer confidence rose to 135.7 in July from 124.3 in June.

The Fed cut interest rates by a quarter of a percentage point, the first rate cut since 2008.

The Eurozone economy’s growth rate fell sharply to a pace that is less than half of what it was at the beginning of the year.

Trump extended tariffs to nearly all Chinese goods. The tariffs are scheduled to take effect September 1st.

Consumer debt, not counting mortgage debt, has risen to $4 trillion; the highest it has ever been. Student debt is $1.5 trillion and auto debt is $1.3 trillion.

The July jobs report was positive showing that steady hiring growth has extended into the second half of 2019.

The Dow Jones Industrial Average, the S&P 500 and the Nasdaq all declined last week, 2.6% for the Dow, 3.10% for the S&P 500 and 3.9% for the Nasdaq. The 10-year treasury yield ended the week at 1.864%.

The Week Ahead

This link takes you to Econoday’s Economic Calendar and Economic Events and Analysis which shows the upcoming economic reporting events scheduled in the week and months ahead.

Summary

Note: The comments that follow are derived from the economic indicators referenced in the Resources section of this newsletter and other sources in this report.

The Aruoba-Diebold-Scotti Business Conditions Index (ALS) has been trending up the last several weeks and has now crossed over the zero line into positive territory. The ALS Index rose slightly this past week. This is a very positive indicator for the economy on a short-term basis.

The GDPNow model estimate for real GDP growth (seasonally adjusted annual rate) in the second quarter of 2019 is n/a. This slight adjustment continues to support the ALS model assessment of an improving short-term economic environment.

The New York Fed Staff Nowcast stands at 1.5% for 2019:Q2 and 1.8% for 2019:Q3.

The Chicago Fed National Activity Index (CFNAI) showed an increase in economic activity in May. The Chicago Fed National Activity Index (CFNAI) was –0.05 in May, up from –0.48 in April.

All told, these short-term economic indicators are a neutral to positive analysis for the economy, at least on a short-term basis.

Expectations that stock prices will rise over the next six months rose this past week and is now at n/a, an unusually low level, in the latest AAII Sentiment Survey. The historical average is 38.5% for the survey. Please see the AAII Sentiment Survey for the complete results.

The latest Gross output (GO) reading suggests slow economic growth as we enter 2019.

On a longer-term basis, the forecasters in the Philadelphia Fed’s Survey of Professional Forecasters (as of May 10, 2019) predict real GDP will grow at an annual rate of 1.9 percent this quarter and 2.1 percent next quarter. On an annual-average over annual-average basis, the forecasters predict real GDP to grow 2.6 percent in 2019, 2.0 percent in 2020, 1.9 percent in 2021 and 2.3 percent in 2022. The forecasters predict the unemployment rate will average 3.7 percent in 2019, 3.6 percent in 2020, 3.7 percent in 2021, and 3.9 percent in 2022.

For a more in-depth review and analysis of the economy, please see our mini-book on economic analysis and forecasting entitled: Simple and Effective Economic Forecasting.

Stock Market Valuations

Our estimates of the market valuations for two stock market indices, the Dow Jones Industrial Average (DJIA) and the Standard & Poor’s 500 (S&P 500), can be found in the file below:

Conclusion

We continue to believe the economy is in a stable but now more vulnerable state. Recent economic reports have been showing signs of weakening. Nonetheless, the economy has remained fairly strong. In fact, the extremely strong first and second GDP showing and the strong labor market conditions still give us confidence that the economy, now in its tenth year of expansion, can continue to grow. But we are cautious on this outlook! Please see our complete Economic and Investment Review in the Spring 2019 quarterly issue of the Intrinsic Value Wealth Report Newsletter.

The broad market remains overvalued, although the Dow Jones Industrial Average looks more fairly valued than the broad market. But that does not mean that a market correction is imminent. Markets can and do stay overvalued for long periods of time. As discussed above and in the Economic and Investment Highlights section of this Commentary, we believe the economy is in a stable but vulnerable state that is showing signs of weakening. If the economy remains strong, the markets will likely remain strong. If the economy deteriorates, the markets may well correct. There are other events that could trigger a market correction, of course, but economic conditions are the most likely and foreseeable events that could make that happen.

We believe it is important to maintain a long-term view toward investing. This means that you should continue building your investment portfolio using the Cassandra Stock Selection Model to select individual securities that offer growth and value opportunities.

Chart for Review and Thought

Inverted Yield Curve

Simple and Effective Economic Forecasting Model

Notes (GDP Growth Chart):

  1. See the July 8, 2019 Commentary for an introduction to this model.
  2. Actual numbers 2007 through Q1 2019; forecasted numbers thereafter.
  3. Normal GDP growth is typically in the 2% to 3% range.
  4. A recession is generally defined as two consecutive quarters of negative economic growth as measured by a country’s gross domestic product (GDP).

Announcements

We have been researching the use of crowdsourcing for investment ideas. We will be sending a survey out in the next few weeks to get your input on the economy and the markets; and to get any investment ideas that you would like to share. We will compile this input and distribute the results to you and our other subscribers.

Business 539 – Financial Management – On July 1, 2019, Dr. Wendee started teaching Business 539 – Financial Management at California Baptist University (CBU). Dr. Wendee teaches courses in Finance and Economics at CBU.

Management 3080 – Business Responsibility in Society – Dr. Wendee will be teaching Management 3080 – Business Responsibility in Society at California State University, Los Angeles (CSULA) starting August 22, 2019. Dr. Wendee teaches courses in Management at CSULA.

Business 217 – Microeconomics – Dr. Wendee will be teaching Business 217 – Microeconomics at California Baptist University (CBU) starting September 4, 2019. Dr. Wendee teaches courses in Finance and Economics at CBU.

Business 218 – Macroeconomics – Dr. Wendee will be teaching Business 218 – Macroeconomics at California Baptist University (CBU) starting September 4, 2019. Dr. Wendee teaches courses in Finance and Economics at CBU.

Dr. Wendee will be presenting a paper on enterprise value creation at the International Leadership Association’s annual global conference which is being held in Ottawa, Canada this Fall.

Intrinsic Value Wealth Creation pyramid

We always conclude our commentary with a discussion of the Intrinsic Value Wealth Creation Pyramid. The Intrinsic Value Wealth Creation Pyramid is designed to show some of the major categories for building wealth. It is the result of many years of study of the wealth building process; experience working with clients who have built considerable wealth; and my own personal experience building wealth. Newsletter subscribers should consult the Intrinsic Value Wealth Creation Pyramid as one of many useful investment tools while considering their investment plans.

The chart in this section is an expanded version of the Intrinsic Value Wealth Creation Pyramid Chart referenced in the Forbes.com article entitled, Nine Of The Best Ways To Build Wealth.

RESOURCES

See our Resources section for links to economic and other resources used in the preparation of this Commentary.
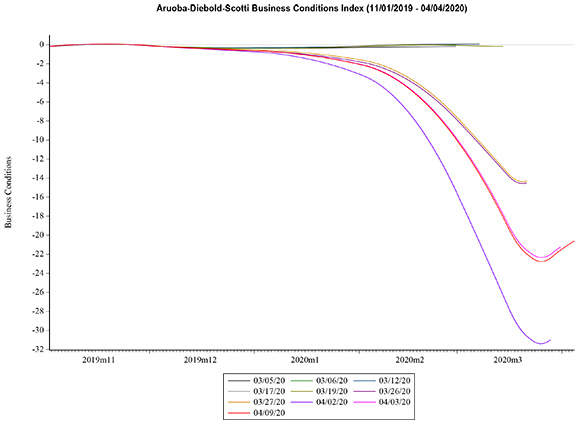
Posted in Economic & Business Chart Room, Economic Outlook, Entrepreneurship, Focus List, Investment Recommendations, Investments, Notes From The Field, Special Situations, Uncategorized, VDI/REEP, Visionary Ideas | Tagged , , , , , , , , , , , , , , , , , , , , , , , , | Comments Off on WEEKLY COMMENTARY August 5, 2019

WEEKLY COMMENTARY July 29, 2019

The National Due Diligence Alliance (TNDDA) Meeting in Phoenix

Dr. Paul attended The National Due Diligence Alliance (TNDDA) investment banking conference, which was held July 26-28, 2019 at the Phoenician Hotel & Resort in Phoenix, Arizona. This is a conference held several times throughout the year for investment bankers and registered investment advisers to learn about new opportunities in the Alternative Investment asset classes.

TNDDA Meeting at the Phoenician Hotel & Resort

Economic and Investment Highlights

Last Week

The White House and Congress agreed on overall spending levels and raising the debt ceiling. The deal reached allows for $2.7 trillion in spending over two years and suspends the debt ceiling until the end of July 2021.

U.S. home sales declined in June. Prices in major West Coast markets declined for the first time since 2012.

The International Monetary Fund (IMF) said that the deceleration in trade is slowing global economic growth more that had been previously expected.

Boris Johnson won the race to become Britain’s new prime minister. He is expected to launch an all-out push to have Britain exit the EU.

The European Central Bank (ECB) signaled that it is preparing to cut interest rates and resume a bond-buying program.

The Agriculture Department is preparing to send $16 billion to farmers hurt by the trade wars with China and wet weather.

The U.S. home ownership rate fell to 64.1% for the April to June period. This was the second consecutive quarterly drop.

The U.S. economy grew at a slower, but still solid, 2.1% pace in the second quarter. Higher consumer spending offset slower business investment. By comparison, the economy grew at a 3.1% pace in the first quarter. Businesses were cautious for a number of reasons including the global trade situation. Nonresidential fixed investment fell 0.6% in the second quarter compared with an increase of 4.4% in the first quarter. U.S. exports fell 5.2% while imports rose slightly. Consumer spending rose at an inflation adjusted 4.3% annualized rate in the second quarter. Overall, low unemployment and rising incomes have been helping the economy while slowing global growth, a strong dollar, and trade tensions have been a drag on the economy. Anemic corporate earnings growth and slowing residential investment have also been a drag on the economy. Residential investment fell at a 1.5% annual rate in the second quarter. Government spending rose at a 5% annual rate. Consumer sentiment remains high and unemployment is very low at 3.7% (as of June). The personal savings rate is at an historically high rate of 8.1%.

The Dow Jones Industrial Average, the S&P 500 and the Nasdaq all rose last week, 0.1% for the Dow, 1.65% for the S&P 500 and 2.3% for the Nasdaq. The 10-year treasury yield ended the week at 2.081%.

The Week Ahead

This link takes you to Econoday’s Economic Calendar and Economic Events and Analysis which shows the upcoming economic reporting events scheduled in the week and months ahead.

Summary

Note: The comments that follow are derived from the economic indicators referenced in the Resources section of this newsletter and other sources in this report.

The Aruoba-Diebold-Scotti Business Conditions Index (ALS) has been trending up the last several weeks and has now crossed over the zero line into positive territory. The ALS Index rose slightly this past week. This is a very positive indicator for the economy on a short-term basis.

The GDPNow model estimate for real GDP growth (seasonally adjusted annual rate) in the second quarter of 2019 is n/a. This slight adjustment continues to support the ALS model assessment of an improving short-term economic environment.

The New York Fed Staff Nowcast stands at 1.5% for 2019:Q2 and 1.8% for 2019:Q3.

The Chicago Fed National Activity Index (CFNAI) showed an increase in economic activity in May. The Chicago Fed National Activity Index (CFNAI) was –0.05 in May, up from –0.48 in April.

All told, these short-term economic indicators are a neutral to positive analysis for the economy, at least on a short-term basis.

Expectations that stock prices will rise over the next six months rose this past week and is now at n/a, an unusually low level, in the latest AAII Sentiment Survey. The historical average is 38.5% for the survey. Please see the AAII Sentiment Survey for the complete results.

The latest Gross output (GO) reading suggests slow economic growth as we enter 2019.

On a longer-term basis, the forecasters in the Philadelphia Fed’s Survey of Professional Forecasters (as of May 10, 2019) predict real GDP will grow at an annual rate of 1.9 percent this quarter and 2.1 percent next quarter. On an annual-average over annual-average basis, the forecasters predict real GDP to grow 2.6 percent in 2019, 2.0 percent in 2020, 1.9 percent in 2021 and 2.3 percent in 2022. The forecasters predict the unemployment rate will average 3.7 percent in 2019, 3.6 percent in 2020, 3.7 percent in 2021, and 3.9 percent in 2022.

For a more in-depth review and analysis of the economy, please see our mini-book on economic analysis and forecasting entitled: Simple and Effective Economic Forecasting.

Stock Market Valuations

Our estimates of the market valuations for two stock market indices, the Dow Jones Industrial Average (DJIA) and the Standard & Poor’s 500 (S&P 500), can be found in the file below:

Conclusion

We continue to believe the economy is in a stable but now more vulnerable state. Recent economic reports have been showing signs of weakening. Nonetheless, the economy has remained fairly strong. In fact, the extremely strong first and second GDP showing and the strong labor market conditions still give us confidence that the economy, now in its tenth year of expansion, can continue to grow. But we are cautious on this outlook! Please see our complete Economic and Investment Review in the Spring 2019 quarterly issue of the Intrinsic Value Wealth Report Newsletter.

The broad market remains overvalued, although the Dow Jones Industrial Average looks more fairly valued than the broad market. But that does not mean that a market correction is imminent. Markets can and do stay overvalued for long periods of time. As discussed above and in the Economic and Investment Highlights section of this Commentary, we believe the economy is in a stable but vulnerable state that is showing signs of weakening. If the economy remains strong, the markets will likely remain strong. If the economy deteriorates, the markets may well correct. There are other events that could trigger a market correction, of course, but economic conditions are the most likely and foreseeable events that could make that happen.

We believe it is important to maintain a long-term view toward investing. This means that you should continue building your investment portfolio using the Cassandra Stock Selection Model to select individual securities that offer growth and value opportunities.

Chart for Review and Thought

Inverted Yield Curve

Simple and Effective Economic Forecasting Model

Notes (GDP Growth Chart):

  1. See the July 8, 2019 Commentary for an introduction to this model.
  2. Actual numbers 2007 through Q1 2019; forecasted numbers thereafter.
  3. Normal GDP growth is typically in the 2% to 3% range.
  4. A recession is generally defined as two consecutive quarters of negative economic growth as measured by a country’s gross domestic product (GDP).

Announcements

We have been researching the use of crowdsourcing for investment ideas. We will be sending a survey out in the next few weeks to get your input on the economy and the markets; and to get any investment ideas that you would like to share. We will compile this input and distribute the results to you and our other subscribers.

Dr. Paul attended The National Due Diligence Alliance (TNDDA) meeting at the Phoenician Hotel & Resort in Phoenix, Arizona this past weekend.

Business 539 – Financial Management – On July 1, 2019, Dr. Wendee started teaching Business 539 – Financial Management at California Baptist University (CBU). Dr. Wendee teaches courses in Finance and Economics at CBU.

Management 3080 – Business Responsibility in Society – Dr. Wendee will be teaching Management 3080 – Business Responsibility in Society at California State University, Los Angeles (CSULA) starting August 22, 2019. Dr. Wendee teaches courses in Management at CSULA.

Business 217 – Microeconomics – Dr. Wendee will be teaching Business 217 – Microeconomics at California Baptist University (CBU) starting September 4, 2019. Dr. Wendee teaches courses in Finance and Economics at CBU.

Business 218 – Macroeconomics – Dr. Wendee will be teaching Business 218 – Macroeconomics at California Baptist University (CBU) starting September 4, 2019. Dr. Wendee teaches courses in Finance and Economics at CBU.

Dr. Wendee will be presenting a paper on enterprise value creation at the International Leadership Association’s annual global conference which is being held in Ottawa, Canada this Fall.

Intrinsic Value Wealth Creation pyramid

We always conclude our commentary with a discussion of the Intrinsic Value Wealth Creation Pyramid. The Intrinsic Value Wealth Creation Pyramid is designed to show some of the major categories for building wealth. It is the result of many years of study of the wealth building process; experience working with clients who have built considerable wealth; and my own personal experience building wealth. Newsletter subscribers should consult the Intrinsic Value Wealth Creation Pyramid as one of many useful investment tools while considering their investment plans.

The chart in this section is an expanded version of the Intrinsic Value Wealth Creation Pyramid Chart referenced in the Forbes.com article entitled, Nine Of The Best Ways To Build Wealth.

RESOURCES

See our Resources section for links to economic and other resources used in the preparation of this Commentary.
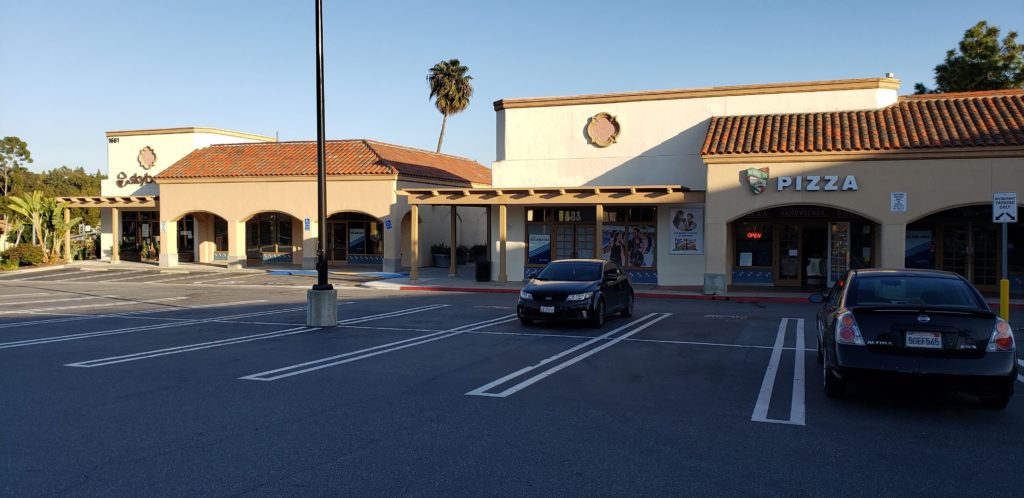
Posted in Economic & Business Chart Room, Economic Outlook, Entrepreneurship, Focus List, Investment Recommendations, Investments, Notes From The Field, Special Situations, Uncategorized, VDI/REEP, Visionary Ideas | Tagged , , , , , , , , , , , , , , , , , , , , , , , , | Comments Off on WEEKLY COMMENTARY July 29, 2019