WEEKLY COMMENTARY May 13, 2019

No Surprise That Berkshire Underperformed the S&P 500 Over The Past Decade

It came as no surprise to me to learn this past week that Warren Buffett’s Berkshire Hathaway had underperformed the S&P 500 in the last decade. Berkshire Hathaway stock was up 259% in the past decade versus the S&P 500’s return of 314% in the same period. The overall return comparison since 1965 looks much better. Berkshire Hathaway has produced a 21% annual compounded return from 1965 to the end of 2018 versus 9.7% for the S&P 500 including dividends. It is this latter return comparison that has made Warren Buffett revered as a stock investing legend. And to be clear, I am an ardent follower of Warren Buffett and his stock picking prowess as well.

Warren Buffett uses a value stock picking strategy whereby he tries to find stocks that are undervalued relative to their “intrinsic value” (for more on intrinsic value, see my Book #2 – Think Strategically, Think Value). Many analysts contend that Berkshire has become too large, and is holding too much cash, to be able to find truly undervalued deals; and that this has hampered its ability to find the very undervalued opportunities that have helped Berkshire’s performance in the past.

In fact, much of Berkshire’s stellar early performance came from buying entire companies and growing them; and from buying stocks in the stock market that were very undervalued. This is more difficult to do as the large conglomerate that Berkshire has become. Berkshire currently has a stock market value of around $537 billion. Furthermore, because of the difficulty of finding investments that suit its value orientation, Berkshire is sitting on well over $100 billion in cash.

I would also contend that with a portfolio of around 60 stocks, Berkshire has become somewhat of a closet indexer. Good diversification can often be achieved with around 25 to 30 stocks. At 60 holdings, Berkshire’s returns over time are likely to approximate the returns of the overall market. That is the penalty for becoming too big! Although, it could be argued that becoming too big is a nice problem to have.

Economic and Investment Highlights

Last Week

Uber’s stock price slid 7.6% below its IPO price of $45, which was already a conservative pricing of the stock for its stock’s public debut. Uber’s IPO was conducted on Friday. The stock price decline still left Uber with an approximately $76 billion market valuation, making it one of the most valuable U.S. startups.

The U.S. imposed tariffs of 25% on $200 billion of Chinese goods and U.S. China trade talks ended with no agreement. This raises the fear of diminishing economic activity if the U.S. and China remain at odds. However, both the U.S. and China gave strong indications that the trade negotiations are not yet over and expressed some optimism for future talks.

The Fed said that the increase in risky corporate debt is a major vulnerability of the U.S. financial system. We have been citing this concern for quite some time (see for example our Economic and Investment Review in the Winter edition of this newsletter).

The stock market declined last week posting its largest weekly drop for 2019. Please see the S&P 500 chart below.

Occidental Petroleum agreed to a $38 billion purchase of Anadarko Petroleum.

In a Wall Street Journal poll of economists, the majority of the economists polled expect strong wage growth in the coming year due to a continuing tight labor market.

The Week Ahead

This link takes you to Econoday’s Economic Calendar and Economic Events and Analysis which shows the upcoming economic reporting events scheduled in the week and months ahead.

Summary

Note: The comments that follow are derived from the economic indicators referenced in the Resources section and other sources at the end of this report.

The Aruoba-Diebold-Scotti Business Conditions Index (ALS) has been trending up the last several weeks and is now very close to the zero line. The ALS Index advanced slightly again this past week. This is a very positive indicator for the economy on a short-term basis.

The GDPNow model estimate for real GDP growth (seasonally adjusted annual rate) in the second quarter of 2019 is 1.6 percent on May 9, down from 1.7 percent on May 3. This slight adjustment continues to support the ALS model assessment of an improving short-term economic environment.

The New York Fed Staff Nowcast stands at 2.2% for 2019:Q2.

The Chicago Fed National Activity Index (CFNAI) showed a slight pickup in economic activity in March. The index was –0.15 in March, up from –0.31 in February.

All told, these short-term economic indicators are a positive analysis for the economy, at least on a short-term basis.

Expectations that stock prices will rise over the next six months increased another 4.1 percentage points to 43.1% in the latest AAII Sentiment Survey. The rise puts optimism a little over the historical average of 38.5% for the survey. Please see the AAII Sentiment Survey for the complete results.

The latest Gross output (GO) reading suggests slow economic growth as we enter 2019.

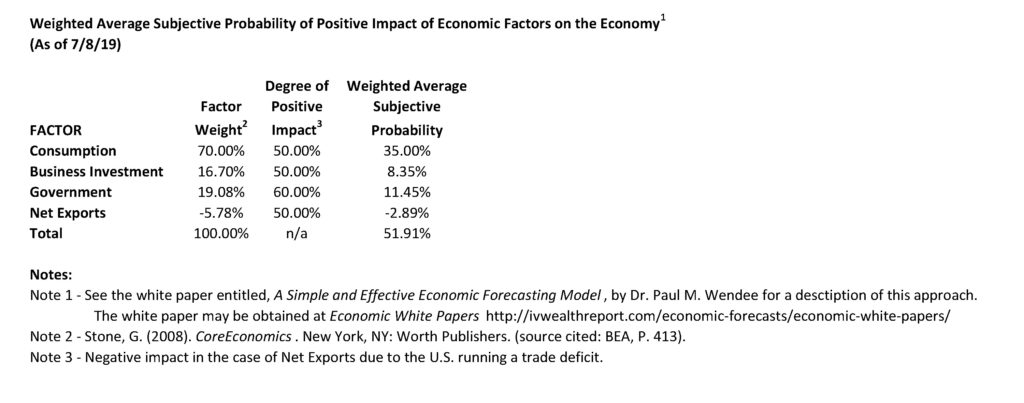
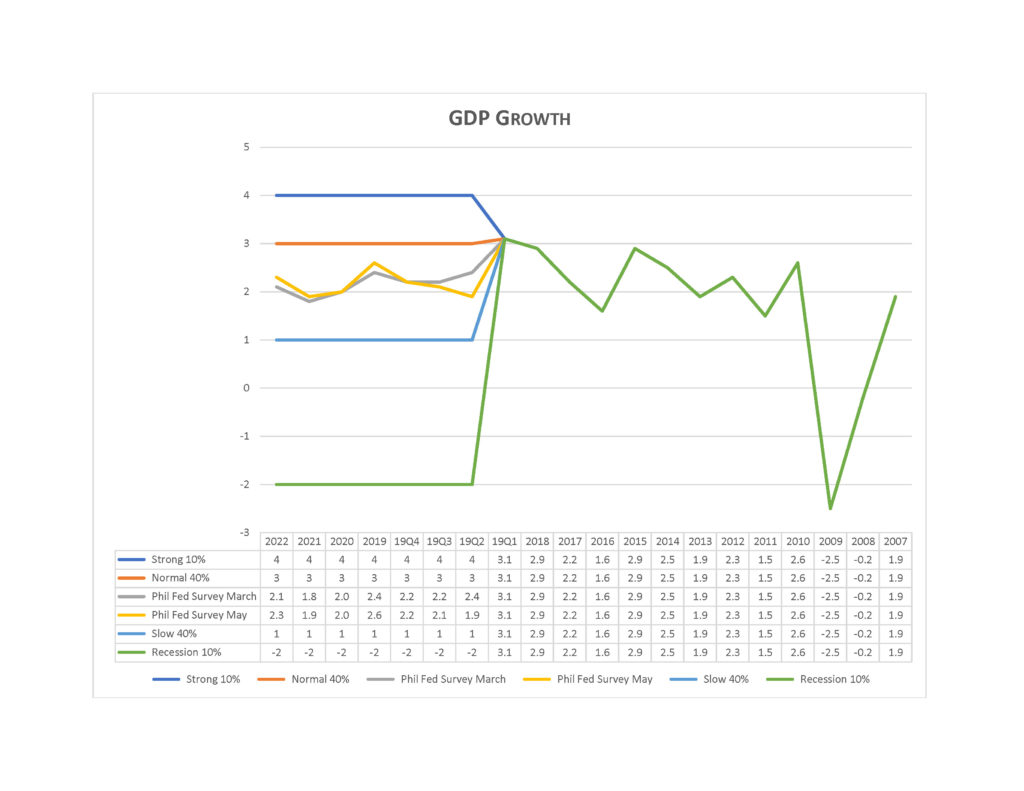
On a longer-term basis, the forecasters in the Philadelphia Fed’s Survey of Professional Forecasters (as of March 22, 2019) predict real GDP will grow at an annual rate of 1.5 percent this quarter and 2.4 percent next quarter. On an annual-average over annual-average basis, the forecasters predict real GDP to grow 2.4 percent in 2019, 2.0 percent in 2020, and 1.8 percent in 2021. The forecasters predict the unemployment rate will average 3.7 percent in 2019 and 2020, 4.0 percent in 2021, and 4.2 percent in 2022.

For a more in-depth review and analysis of the economy, please see our mini-book on economic analysis and forecasting entitled: Simple and Effective Economic Forecasting.

Stock Market Valuations

Our estimates of the market valuations for two stock market indices, the Dow Jones Industrial Average (DJIA) and the Standard & Poor’s 500 (S&P 500), can be found in the file below:

Conclusion

We continue believe the economy is in a stable but somewhat vulnerable state. Nonetheless, it has remained fairly strong. In fact, the extremely strong first quarter GDP showing and the strong labor market conditions give us more confidence that the economy, now in its tenth year of expansion, can continue to grow. Please see our complete Economic and Investment Review in the Winter 2019 quarterly issue of the Intrinsic Value Wealth Report Newsletter.

Even with the pullback in the market this past week, it remains overvalued. But that does not mean that a market correction is imminent. Markets can and do stay overvalued for long periods of time. As discussed above in the Economic and Investment Highlights section of this Commentary, we believe the economy is in a stable but vulnerable state. If the economy remains strong, the markets will likely remain strong. If the economy deteriorates, the markets may well correct. There are other events that could trigger a market correction, of course, but economic conditions are the most likely and foreseeable events that could make that happen.

We believe it is important to maintain a long-term view toward investing. This means that you should continue building your investment portfolio using the Cassandra Stock Selection Model to select individual securities that offer growth and value opportunities.

Chart for Review and Thought
S & P 500 – The S & P 500 posted its largest weekly drop for 2019 last week.

Announcements

We have been researching the use of crowdsourcing for investment ideas. We will be sending a survey out in the next few weeks to get your input on the economy and the markets; and to get any investment ideas that you would like to share. We will compile this input and distribute the results to you and our other subscribers.

Dr. Wendee will be speaking at the Las Vegas Investment Club on June 24th.  He will be speaking on the topic of his popular Forbes article, Nine of the Best Ways to Build Wealth. Please contact Mike Lathigee at mike@mikelathigee.com if you would like to attend.

Dr. Wendee will be speaking at FreedomFest during its annual conference in Las Vegas, July 17 – 20, 2019.

Dr. Wendee will be a judge at the FundingPost June PitchFest Event on June 11, 2019 in San Diego. Click on this link for details on the event: 
https://www.fundingpost.com/event/reg1.asp?event=433

Dr. Wendee attended and did coursework at the International Business Brokers Association (IBBA) meeting in Orlando this past weekend. He will be attending the Money show in Las Vegas this coming week.

Rosen Shingle Creek Resort, Orlando, Florida
IBBA Conference
May 10 – 12, 2019

Intrinsic Value Wealth Creation pyramid

We always conclude our commentary with a discussion of the Intrinsic Value Wealth Creation Pyramid. The Intrinsic Value Wealth Creation Pyramid is designed to show some of the major categories for building wealth. It is the result of many years of study of the wealth building process; experience working with clients who have built considerable wealth; and my own personal experience building wealth. Newsletter subscribers should consult the Intrinsic Value Wealth Creation Pyramid as one of many useful investment tools while considering their investment plans.

The chart in this section is an expanded version of the Intrinsic Value Wealth Creation Pyramid Chart referenced in the Forbes.com article entitled, Nine Of The Best Ways To Build Wealth.Intrinsic Value Wealth Creation PyramidDownload

RESOURCES

Economic Indicators

Below are links to a few of the many resources that we follow on a continuous basis to track the economy and financial markets on a short-term and long-term basis.

Real-Time and Current Economic Conditions

The Federal Reserve Bank of Philadelphia’s Aruoba-Diebold-Scotti Business Conditions (ADS) Index is designed to track real business conditions at high frequency. Click Aruoba-Diebold-Scotti Business Conditions Index to access this model.

Click GDPNow to access The Federal Reserve Bank of Atlanta’s GDPNow Forecasting Model.

The Federal Reserve Bank of New York’s Nowcast report tracks the evolution of the FRBNY Staff Nowcast of GDP growth and the impact of new data releases on the forecast. Click Nowcast to access the report and background information on the report.

The Chicago Fed National Activity Index (CFNAI) is a monthly index designed to gauge overall economic activity and related inflationary pressure. Click CFNAI to access this index.

Economy At A Glance

The National Economic Trends charts provided by the Federal Reserve Bank of St. Louis (FRED) can be accessed by clicking the Economy At A Glance link below:

Economy At A Glance

Gross Output

Gross Output is a measure that may be more useful than the Gross Domestic Product (GDP) measure, as it looks at the top line of national income accounting. It is also a good measure to use in conjunction with GDP to get a better overall picture of the economy. This measure can be accessed by clicking the links below:

Gross Output By Industry

MSkousen.com

Gross Output (GO)

Surveys of Professional Forecasters

The Survey of Professional Forecasters’ web page offers the actual releases, documentation, mean and median forecasts of all the respondents in the Fed’s Survey of Professional Forecasters.  Click the following link to be taken to the Federal Reserve Bank of Philadelphia’s website to access the current survey: Survey of Professional Forecasters.

The Livingston Survey of Professional Forecasters’ web page offers the actual releases, documentation, mean and median forecasts of all the respondents in the Fed’s Livingston Survey. Click the following link to be taken to the Federal Reserve Bank of Philadelphia’s website to access the current survey: Livingston Survey.

Econoday

Econoday offers some excellent resources for understanding and forecasting the economy. The link below takes you to Econoday’s Economic Calendar and Economic Events and Analysis sections. Please see Econoday’s Economic Calendar for upcoming economic reporting events in the week and months ahead.

AAII Investor Sentiment Survey

The AAII Investor Sentiment Survey measures the percentage of individual investors who are bullish, bearish, and neutral on the stock market for the next six months: AAII Investor Sentiment Survey.

Posted in Economic & Business Chart Room, Economic Outlook, Entrepreneurship, Focus List, Investment Recommendations, Investments, Notes From The Field, Special Situations, Uncategorized, VDI/REEP, Visionary Ideas | Tagged , , , , , , , , , , , , , , , , , , , , , , , , , | Comments Off on WEEKLY COMMENTARY May 13, 2019

WEEKLY COMMENTARY May 6, 2019

Why We Are NOT All That Excited By The Strong Jobs Report!

The jobless rate hit a 50-year low in April, a good sign for the economy. The unemployment rate fell to 3.6% and was accompanied by solid wage growth. Wage growth outpaced inflation which was 1.9% as measured in March by the consumer price index. That’s the good news. The bad news is that the labor force participation rate declined slightly. A low labor force participation rate holds the economy back from achieving its full potential. While the immediate effect of a low labor participation rate may not be apparent, and the historically low jobless rate may be something to cheer, the long-term drag on the economy in reaching its full potential due to a low labor participation rate is something that is of concern.

We have been warning for quite some time of the potential problems that a low labor force participation rate can cause (see for example our Economic and Investment Review in the Winter edition of this newsletter). The economy’s potential growth is determined by the size of its labor force and how much that labor force can produce. Worker productivity in the U.S. has been sluggish for more than a decade but did show some slight improvement in the first quarter. Currently, the labor force participation rate is just below 63% (please see the chart below in Charts for Review and Thought). It has declined from above 67% in early 2000. While the decline in these numbers may not seem large, they are actually quite significant when you apply them to actual numbers of people and consider that roughly 63% of the people that could be part of the labor force are supporting the other 37% that could be, but are not, part of the labor force; plus this 63% are supporting those that can’t work for whatever reason.

It should be noted that the reported decline in the labor force participation rate may be due somewhat to a problem in the reporting. Two different surveys were cited in the labor force participation rate reporting. One survey showed a slight increase while the other survey showed a slight decline. But at best, the labor force participation rate was flat during the period. A flat labor force participation rate at its currently low level is nothing to be happy about. We would hope to see an increasing participation rate in the labor force for us to be able to view the labor picture as a strongly positive economic indicator.

Economic and Investment Highlights

Last Week

U.S. stock markets hit new highs again this week.

The combined GDP of the Eurozone’s 19 members increased at a 1.5% annual rate in the first quarter. This was a significant increase from the 0.9% rate in the fourth quarter of 2018. The Eurozone’s economic growth has been in a slowdown which deepened in the second half of last year.

The U.S. Federal Reserve held rates steady at its policy meeting last week and signaled that they are taking a wait-and-see approach on raising or lowering rates going forward. Inflation has remained well below the Fed’s target range of 2%. Some economists actually worry that the low inflation number could be a sign of impending economic weakness.

The Week Ahead

This link takes you to Econoday’s Economic Calendar and Economic Events and Analysis which shows the upcoming economic reporting events scheduled in the week and months ahead.

Summary

Note: The comments that follow are derived from the economic indicators referenced in the Resources section and other sources at the end of this report.

The Aruoba-Diebold-Scotti Business Conditions Index (ALS) has been trending up the last several weeks and is now very close to the zero line. This is a very positive indicator for the economy on a short-term basis.

The GDPNow model estimate for real GDP growth (seasonally adjusted annual rate) in the second quarter of 2019 is 1.7 percent on May 3, up from 1.2 percent on May 1. This supports the ALS model assessment of an improving short-term economic environment.

The New York Fed Staff Nowcast for GDP stands at 2.1% for 2019:Q2.

The Chicago Fed National Activity Index (CFNAI) showed a slight pickup in economic activity in March.

All told, these short-term economic indicators are a positive analysis for the economy, at least on a short-term basis.

Expectations that stock prices will rise over the next six months increased 5.5 percentage points to 39.0% in the latest AAII Sentiment Survey. The rise puts optimism a little over the historical average of 38.5% for the survey. Please see the AAII Sentiment Survey for the complete results.

The latest Gross output (GO) reading suggests slow economic growth as we enter 2019.

On a longer-term basis, the forecasters in the Philadelphia Fed’s Survey of Professional Forecasters (as of March 22, 2019) predict real GDP will grow at an annual rate of 1.5 percent this quarter and 2.4 percent next quarter. On an annual-average over annual-average basis, the forecasters predict real GDP to grow 2.4 percent in 2019, 2.0 percent in 2020, and 1.8 percent in 2021. The forecasters predict the unemployment rate will average 3.7 percent in 2019 and 2020, 4.0 percent in 2021, and 4.2 percent in 2022.

For a more in-depth review and analysis of the economy, please see our mini-book on economic analysis and forecasting entitled: Simple and Effective Economic Forecasting.

Stock Market Valuations

Our estimates of the market valuations for two stock market indices, the Dow Jones Industrial Average (DJIA) and the Standard & Poor’s 500 (S&P 500), can be found in the file below:

Conclusion

We continue believe the economy is in a stable but somewhat vulnerable state. Nonetheless, it has remained fairly strong. In fact, the extremely strong first quarter GDP showing and the strong labor market conditions give us more confidence that the economy, now in its tenth year of expansion, can continue to grow. Please see our complete Economic and Investment Review in the Winter 2019 quarterly issue of the Intrinsic Value Wealth Report Newsletter.

With additional record setting highs set in the market last week, the market is becoming more overvalued. But that does not mean that a market correction is imminent. Markets can and do stay overvalued for long periods of time. As discussed above in the Economic and Investment Highlights section of this Commentary, we believe the economy is in a stable but vulnerable state. If the economy remains strong, the markets will likely remain strong. If the economy deteriorates, the markets may well correct. There are other events that could trigger a market correction, of course, but economic conditions are the most likely and foreseeable events that could make that happen.

We believe it is important to maintain a long-term view toward investing. This means that you should continue building your investment portfolio using the Cassandra Stock Selection Model to select individual securities that offer growth and value opportunities.

Chart for Review and Thought

Labor Force Participation Rate – The Labor Force Participation Rate stands at just below 63%, down from 67% in early 2000.

Announcements

We have been researching the use of crowdsourcing for investment ideas. We will be sending a survey out in the next few weeks to get your input on the economy and the markets; and to get any investment ideas that you would like to share. We will compile this input and distribute the results to you and our other subscribers.

Dr. Wendee will be speaking at the Las Vegas Investment Club on June 24th.  He will be speaking on the topic of his popular Forbes article, Nine of the Best Ways to Build Wealth. Please contact Mike Lathigee at mike@mikelathigee.com if you would like to attend.

Dr. Wendee will be speaking at FreedomFest during its annual conference in Las Vegas, July 17 – 20, 2019.

Dr. Wendee will be a judge at the FundingPost June PitchFest Event on June 11, 2019 in San Diego. Click on this link for details on the event:
https://www.fundingpost.com/event/reg1.asp?event=433

Intrinsic Value Wealth Creation pyramid

We always conclude our commentary with a discussion of the Intrinsic Value Wealth Creation Pyramid. The Intrinsic Value Wealth Creation Pyramid is designed to show some of the major categories for building wealth. It is the result of many years of study of the wealth building process; experience working with clients who have built considerable wealth; and my own personal experience building wealth. Newsletter subscribers should consult the Intrinsic Value Wealth Creation Pyramid as one of many useful investment tools while considering their investment plans.

The chart in this section is an expanded version of the Intrinsic Value Wealth Creation Pyramid Chart referenced in the Forbes.com article entitled, Nine Of The Best Ways To Build Wealth.

RESOURCES

Economic Indicators

Below are links to a few of the many resources that we follow on a continuous basis to track the economy and financial markets on a short-term and long-term basis.

Real-Time and Current Economic Conditions

The Federal Reserve Bank of Philadelphia’s Aruoba-Diebold-Scotti Business Conditions (ADS) Index is designed to track real business conditions at high frequency. Click Aruoba-Diebold-Scotti Business Conditions Index to access this model.

Click GDPNow to access The Federal Reserve Bank of Atlanta’s GDPNow Forecasting Model.

The Federal Reserve Bank of New York’s Nowcast report tracks the evolution of the FRBNY Staff Nowcast of GDP growth and the impact of new data releases on the forecast. Click Nowcast to access the report and background information on the report.

The Chicago Fed National Activity Index (CFNAI) is a monthly index designed to gauge overall economic activity and related inflationary pressure. Click CFNAI to access this index.

Economy At A Glance

The National Economic Trends charts provided by the Federal Reserve Bank of St. Louis (FRED) can be accessed by clicking the Economy At A Glance link below:

Economy At A Glance

Gross Output

Gross Output is a measure that may be more useful than the Gross Domestic Product (GDP) measure, as it looks at the top line of national income accounting. It is also a good measure to use in conjunction with GDP to get a better overall picture of the economy. This measure can be accessed by clicking the links below:

Gross Output By Industry

MSkousen.com

Gross Output (GO)

Surveys of Professional Forecasters

The Survey of Professional Forecasters’ web page offers the actual releases, documentation, mean and median forecasts of all the respondents in the Fed’s Survey of Professional Forecasters.  Click the following link to be taken to the Federal Reserve Bank of Philadelphia’s website to access the current survey: Survey of Professional Forecasters.

The Livingston Survey of Professional Forecasters’ web page offers the actual releases, documentation, mean and median forecasts of all the respondents in the Fed’s Livingston Survey. Click the following link to be taken to the Federal Reserve Bank of Philadelphia’s website to access the current survey: Livingston Survey.

Econoday

Econoday offers some excellent resources for understanding and forecasting the economy. The link below takes you to Econoday’s Economic Calendar and Economic Events and Analysis sections. Please see Econoday’s Economic Calendar for upcoming economic reporting events in the week and months ahead.

AAII Investor Sentiment Survey

The AAII Investor Sentiment Survey measures the percentage of individual investors who are bullish, bearish, and neutral on the stock market for the next six months: AAII Investor Sentiment Survey.

Posted in Economic & Business Chart Room, Economic Outlook, Entrepreneurship, Focus List, Investment Recommendations, Investments, Notes From The Field, Special Situations, Uncategorized, VDI/REEP, Visionary Ideas | Tagged , , , , , , , , , , , , , , , , , , , , , , , , , | Comments Off on WEEKLY COMMENTARY May 6, 2019

WEEKLY COMMENTARY April 29, 2019

U.S. Economy Posts Strong First Quarter

The U.S. economy posted a very strong 3.2% annualized gross domestic product (GDP) gain in the first quarter. The U.S. economy is now in its tenth year of expansion. At the same time, inflation slowed in the first quarter and remains below the Federal Reserve’s 2% target.

Much of the increase in GDP was driven by rising net exports (exports minus imports) and higher business inventory investment. These offset weaker consumer spending and business investment. Housing was also a drag on the economy during the period.

Other positive factors for the economy include low unemployment levels; incomes and wages that are rising; and consumer confidence that is strong.

Economic and Investment Highlights

Last Week

Oil prices rose to $65.70, nearly reaching a six-month high; but ended the week at $63.30.

Sales of existing homes in the U.S. fell in March. At the same time, sales of new homes rose. The home ownership rate fell to 64.2% in the first quarter from 64.8% in the fourth quarter of 2018, the first drop in more two years. The mixed housing report and negative report on home ownership are potential drags on the economy.

Projections are that the costs of Social Security will exceed its revenue in 2020.

The S&P500 and the Nasdaq both closed at record highs on Tuesday and again on Friday.

The Week Ahead

This link takes you to Econoday’s Economic Calendar and Economic Events and Analysis which shows the upcoming economic reporting events scheduled in the week and months ahead.

Summary

Note: The comments that follow are derived from the economic indicators referenced in the Resources section and other sources at the end of this report.

The Philadelphia Fed’s ADS index has been below the zero line but has been trending up. This is a slightly positive sign for the economy.

The Atlanta Fed’s most recent estimate (based on its GDPNow model) of first quarter 2019 GDP growth is 2.7%. This is also a positive sign for the economy.

The New York Fed Staff Nowcast stands at 1.3% for 2019:Q1 and 2.08% for 2019:Q2. Again, this is a positive trend.

The Chicago Fed’s CFNAI index also points to a pickup in economic growth.

All told, these short-term economic indicators are a positive analysis for the economy, at least on a short-term basis.

The AAII Investor Sentiment Index is signaling that investors are becoming more cautious about the markets. The percentage of investors saying that their short-term outlook for stocks is neutral is at a three-year high. Other parts of the index also signaled increasing caution.

The latest Gross output (GO) reading suggests slow economic growth as we enter 2019.

On a longer-term basis, the forecasters in the Philadelphia Fed’s Survey of Professional Forecasters (as of March 22, 2019) predict real GDP will grow at an annual rate of 1.5 percent this quarter and 2.4 percent next quarter. On an annual-average over annual-average basis, the forecasters predict real GDP to grow 2.4 percent in 2019, 2.0 percent in 2020, and 1.8 percent in 2021. The forecasters predict the unemployment rate will average 3.7 percent in 2019 and 2020, 4.0 percent in 2021, and 4.2 percent in 2022.

For a more in-depth review and analysis of the economy, please see our mini-book on economic analysis and forecasting entitled: Simple and Effective Economic Forecasting.

Stock Market Valuations

Our estimates of the market valuations for two stock market indices, the Dow Jones Industrial Average (DJIA) and the Standard & Poor’s 500 (S&P 500), can be found in the file below:

Conclusion

We believe the economy is in a stable but somewhat vulnerable state. Nonetheless, it has remained fairly strong. In fact, the extremely strong first quarter showing gives us more confidence that the economy, now in its tenth year of expansion, can continue to grow. Please see our complete Economic and Investment Review in the Winter 2019 quarterly issue of the Intrinsic Value Wealth Report Newsletter.

With the two record setting highs set in the market this week, the market is somewhat overvalued at this time. But that does not mean that a market correction is imminent. Markets can and do stay overvalued for long periods of time. As discussed above in the Economic and Investment Highlights section of this Commentary, we believe the economy is in a stable but vulnerable state. If the economy remains strong, the markets will likely remain strong. If the economy deteriorates, the markets may well correct. There are other events that could trigger a market correction, of course, but economic conditions are the most likely and foreseeable events that could make that happen.

We believe it is important to maintain a long-term view toward investing. This means that you should continue building your investment portfolio using the Cassandra Stock Selection Model to select individual securities that offer growth and value opportunities.

Chart for Review and Thought

S & P 500 – The S & P 500 has risen 23.56% since its low on December 24, 2018 (through April 19, 2019).

Announcements

We have been researching the use of crowdsourcing for investment ideas. We will be sending a survey out in the next few weeks to get your input on the economy and the markets; and to get any investment ideas that you would like to share. We will compile this input and distribute the results to you and our other subscribers.

Dr. Wendee will be speaking at the Las Vegas Investment Club on June 24th.  He will be speaking on the topic of his popular Forbes article, Nine of the Best Ways to Build Wealth. Please contact Mike Lathigee at mike@mikelathigee.com if you would like to attend.

Dr. Wendee will be speaking at FreedomFest during its annual conference in Las Vegas, July 17 – 20, 2019.

Paul attended the Landmark Angels event at the Pelican Hill Resort (picture below) in Newport Beach, California this past week. Events sponsored by angel investing groups like Landmark Angels explore investment opportunities in startup and early stage companies.

Intrinsic Value Wealth Creation pyramid

We always conclude our commentary with a discussion of the Intrinsic Value Wealth Creation Pyramid. The Intrinsic Value Wealth Creation Pyramid is designed to show some of the major categories for building wealth. It is the result of many years of study of the wealth building process; experience working with clients who have built considerable wealth; and my own personal experience building wealth. Newsletter subscribers should consult the Intrinsic Value Wealth Creation Pyramid as one of many useful investment tools while considering their investment plans.

The chart in this section is an expanded version of the Intrinsic Value Wealth Creation Pyramid Chart referenced in the Forbes.com article entitled, Nine Of The Best Ways To Build Wealth.

RESOURCES

Economic Indicators

Below are links to a few of the many resources that we follow on a continuous basis to track the economy and financial markets on a short-term and long-term basis.

Real-Time and Current Economic Conditions

The Federal Reserve Bank of Philadelphia’s Aruoba-Diebold-Scotti Business Conditions (ADS) Index is designed to track real business conditions at high frequency. Click Aruoba-Diebold-Scotti Business Conditions Index to access this model.

Click GDPNow to access The Federal Reserve Bank of Atlanta’s GDPNow Forecasting Model.

The Federal Reserve Bank of New York’s Nowcast report tracks the evolution of the FRBNY Staff Nowcast of GDP growth and the impact of new data releases on the forecast. Click Nowcast to access the report and background information on the report.

The Chicago Fed National Activity Index (CFNAI) is a monthly index designed to gauge overall economic activity and related inflationary pressure. Click CFNAI to access this index.

Economy At A Glance

The National Economic Trends charts provided by the Federal Reserve Bank of St. Louis (FRED) can be accessed by clicking the Economy At A Glance link below:

Economy At A Glance

Gross Output

Gross Output is a measure that may be more useful than the Gross Domestic Product (GDP) measure, as it looks at the top line of national income accounting. It is also a good measure to use in conjunction with GDP to get a better overall picture of the economy. This measure can be accessed by clicking the links below:

Gross Output By Industry

MSkousen.com

Gross Output (GO)

Surveys of Professional Forecasters

The Survey of Professional Forecasters’ web page offers the actual releases, documentation, mean and median forecasts of all the respondents in the Fed’s Survey of Professional Forecasters.  Click the following link to be taken to the Federal Reserve Bank of Philadelphia’s website to access the current survey: Survey of Professional Forecasters.

The Livingston Survey of Professional Forecasters’ web page offers the actual releases, documentation, mean and median forecasts of all the respondents in the Fed’s Livingston Survey. Click the following link to be taken to the Federal Reserve Bank of Philadelphia’s website to access the current survey: Livingston Survey.

Econoday

Econoday offers some excellent resources for understanding and forecasting the economy. The link below takes you to Econoday’s Economic Calendar and Economic Events and Analysis sections. Please see Econoday’s Economic Calendar for upcoming economic reporting events in the week and months ahead.

AAII Investor Sentiment Survey

The AAII Investor Sentiment Survey measures the percentage of individual investors who are bullish, bearish, and neutral on the stock market for the next six months: AAII Investor Sentiment Survey.

Posted in Economic & Business Chart Room, Economic Outlook, Entrepreneurship, Focus List, Investment Recommendations, Investments, Notes From The Field, Special Situations, Uncategorized, VDI/REEP, Visionary Ideas | Tagged , , , , , , , , , , , , , , , , , , , , , , , , | Comments Off on WEEKLY COMMENTARY April 29, 2019

WEEKLY COMMENTARY April 22, 2019

Investors Wary of Market Peak

Many investors are wary that the market may again be nearing a peak. The market has risen 23.56% since its low on December 24, 2018; but trades at a price-to-earnings multiple of only 21.94. This is only a little above the price-to-earnings ratio of 19.91 reached on January 11th of this year, which was a low for the year. A year ago, the price-to-earnings ratio was 24.30. At that time, S&P 500 corporate earnings were $109.88 versus $132.39 today. According to Factset, corporate earnings are expected to fall 3.9% in the first quarter of this year from a year earlier.

We agree that the market is somewhat overvalued at this time. But that does not mean that a market correction is imminent. Markets can and do stay overvalued for long periods of time. As discussed below in the Economic and Investment Highlights section of this Commentary, we believe the economy is in a stable but vulnerable state. If the economy remains strong, the markets will likely remain strong. If the economy deteriorates, the markets may well correct. There are other events that could trigger a market correction, of course, but economic conditions are the most likely and foreseeable events that could make that happen.

Economic and Investment Highlights

Last Week

Lyft’s stock was reported at the beginning of the week to be trading at $56.11, 22% below its IPO price of $72. The reasons given for the drop were a 12% fall in the price on its second trading day; less than favorable analyst reports; and the possibility of high short interest in the stock.

Manufacturing output was flat in March. Manufacturing output had fallen in the first two months of the year, posting an overall decline of 1.1% (on an annual basis) for the first quarter of the year.

With a recent pickup in exports, the U.S. trade deficit narrowed 3.4% in February from January.

Retail sales in the U.S. were stronger in March. The strong retail showing, along with export data that was stronger than expected, has caused many economists to increase their estimates of first quarter and second quarter economic growth.

A measure of U.S. home building declined in March, continuing a recent trend of weakness.

The shares of both Pinterest and Zoom soared after their IPOs on Thursday. Pinterest was up 28% from its IPO price and Zoom was up 72% at the market close on Thursday.

The Week Ahead

This link takes you to Econoday’s Economic Calendar and Economic Events and Analysis which shows the upcoming economic reporting events scheduled in the week and months ahead.

Summary

Note: The comments that follow are derived from the economic indicators referenced in the Resources section and other sources at the end of this report.

The Philadelphia Fed’s ADS index has been below the zero line but has been trending up. This is a slightly positive sign for the economy.

The Atlanta Fed’s most recent estimate (based on its GDPNow model) of first quarter 2019 GDP growth is 2.8%. This is also a positive sign for the economy.

The New York Fed Staff Nowcast stands at 1.4% for 2019:Q1 and 1.9% for 2019:Q2. Again, this is a positive trend.

The Chicago Fed’s CFNAI index also points to a pickup in economic growth.

All told, these short-term economic indicators are a positive analysis for the economy, at least on a short-term basis.

The AAII Investor Sentiment Index is signaling that investors are becoming more cautious about the markets. The percentage of investors saying that their short-term outlook for stocks is neutral is at a nine-month high. Other parts of the index also signaled increasing caution.

The latest Gross output (GO) reading suggests slow economic growth as we enter 2019.

On a longer-term basis, the forecasters in the Philadelphia Fed’s Survey of Professional Forecasters (as of March 22, 2019) predict real GDP will grow at an annual rate of 1.5 percent this quarter and 2.4 percent next quarter. On an annual-average over annual-average basis, the forecasters predict real GDP to grow 2.4 percent in 2019, 2.0 percent in 2020, and 1.8 percent in 2021. The forecasters predict the unemployment rate will average 3.7 percent in 2019 and 2020, 4.0 percent in 2021, and 4.2 percent in 2022.

For a more in-depth review and analysis of the economy, please see our mini-book on economic analysis and forecasting entitled: Simple and Effective Economic Forecasting.

Stock Market Valuations

Our estimates of the market valuations for two stock market indices, the Dow Jones Industrial Average (DJIA) and the Standard & Poor’s 500 (S&P 500), can be found in the file below:

Conclusion

Overall, as the discussion above suggests, we believe the economy is in a stable but vulnerable state; but has nonetheless remained fairly strong. Please see our complete Economic and Investment Review in the Winter 2019 quarterly issue of the Intrinsic Value Wealth Report Newsletter.

We believe it is important to maintain a long-term view toward investing. This means that you should continue building your investment portfolio using the Cassandra Stock Selection Model to select individual securities that offer growth and value opportunities.

Chart for Review and Thought

S & P 500 – The S & P 500 has risen 23.56% since its low on December 24, 2018 (through April 19, 2019).

Announcements

We have been researching the use of crowdsourcing for investment ideas. We will be sending a survey out in the next few weeks to get your input on the economy and the markets; and to get any investment ideas that you would like to share. We will compile this input and distribute the results to you and our other subscribers.

Dr. Wendee will be speaking at the Las Vegas Investment Club on June 24th.  He will be speaking on the topic of his popular Forbes article, Nine of the Best Ways to Build Wealth. Please contact Mike Lathigee at mike@mikelathigee.com if you would like to attend.

Dr. Wendee will be speaking at FreedomFest during its annual conference in Las Vegas, July 17 – 20, 2019.

Intrinsic Value Wealth Creation pyramid

We always conclude our commentary with a discussion of the Intrinsic Value Wealth Creation Pyramid. The Intrinsic Value Wealth Creation Pyramid is designed to show some of the major categories for building wealth. It is the result of many years of study of the wealth building process; experience working with clients who have built considerable wealth; and my own personal experience building wealth. Newsletter subscribers should consult the Intrinsic Value Wealth Creation Pyramid as one of many useful investment tools while considering their investment plans.

The chart in this section is an expanded version of the Intrinsic Value Wealth Creation Pyramid Chart referenced in the Forbes.com article entitled, Nine Of The Best Ways To Build Wealth.

RESOURCES

Economic Indicators

Below are links to a few of the many resources that we follow on a continuous basis to track the economy and financial markets on a short-term and long-term basis.

Real-Time and Current Economic Conditions

The Federal Reserve Bank of Philadelphia’s Aruoba-Diebold-Scotti Business Conditions (ADS) Index is designed to track real business conditions at high frequency. Click Aruoba-Diebold-Scotti Business Conditions Index to access this model.

Click GDPNow to access The Federal Reserve Bank of Atlanta’s GDPNow Forecasting Model.

The Federal Reserve Bank of New York’s Nowcast report tracks the evolution of the FRBNY Staff Nowcast of GDP growth and the impact of new data releases on the forecast. Click Nowcast to access the report and background information on the report.

The Chicago Fed National Activity Index (CFNAI) is a monthly index designed to gauge overall economic activity and related inflationary pressure. Click CFNAI to access this index.

Economy At A Glance

The National Economic Trends charts provided by the Federal Reserve Bank of St. Louis (FRED) can be accessed by clicking the Economy At A Glance link below:

Economy At A Glance

Gross Output

Gross Output is a measure that may be more useful than the Gross Domestic Product (GDP) measure, as it looks at the top line of national income accounting. It is also a good measure to use in conjunction with GDP to get a better overall picture of the economy. This measure can be accessed by clicking the links below:

Gross Output By Industry

MSkousen.com

Gross Output (GO)

Surveys of Professional Forecasters

The Survey of Professional Forecasters’ web page offers the actual releases, documentation, mean and median forecasts of all the respondents in the Fed’s Survey of Professional Forecasters.  Click the following link to be taken to the Federal Reserve Bank of Philadelphia’s website to access the current survey: Survey of Professional Forecasters.

The Livingston Survey of Professional Forecasters’ web page offers the actual releases, documentation, mean and median forecasts of all the respondents in the Fed’s Livingston Survey. Click the following link to be taken to the Federal Reserve Bank of Philadelphia’s website to access the current survey: Livingston Survey.

Econoday

Econoday offers some excellent resources for understanding and forecasting the economy. The link below takes you to Econoday’s Economic Calendar and Economic Events and Analysis sections. Please see Econoday’s Economic Calendar for upcoming economic reporting events in the week and months ahead.

AAII Investor Sentiment Survey

The AAII Investor Sentiment Survey measures the percentage of individual investors who are bullish, bearish, and neutral on the stock market for the next six months: AAII Investor Sentiment Survey.

Posted in Economic & Business Chart Room, Economic Outlook, Entrepreneurship, Focus List, Investment Recommendations, Investments, Notes From The Field, Special Situations, Uncategorized, VDI/REEP, Visionary Ideas | Tagged , , , , , , , , , , , , , , , , , , , , , , , , | Comments Off on WEEKLY COMMENTARY April 22, 2019

Welcome to the New Intrinsic Value Wealth Report Newsletter

We are pleased to provide you with the first print edition of the new Intrinsic Value Wealth Report Newsletter.

The Intrinsic Value Wealth Report Newsletter was established in 2012 but has its roots in an investment newsletter I wrote for an investment banking firm in the early 1990s. That newsletter was called, Review & Outlook. When in 2012 I started the Intrinsic Value Wealth Report, as it was called then (note: it did not include the word “Newsletter”), it was intended to be a general resource for my university students and to offer supplemental materials to the regular course materials.

Since its founding in 2012, the Intrinsic Value Wealth Report has evolved to now include a printed newsletter, the Intrinsic Value Wealth Report Newsletter. So, there are now two publications: (1) the Intrinsic Value Wealth Report, which is a free publication; and (2) the Intrinsic Value Wealth Report Newsletter, which is a “Pay What You Want” subscription.

The Intrinsic Value Wealth Report Newsletter covers a variety of investment related topics, including various feature articles on investments; a review of the economy and the investment climate; convertible security analysis; recommended stock picks from our award-winning, proprietary stock picking model, the Cassandra Stock Picking Model; model portfolios; alternative investment classes; market valuations; technical analysis (point & figure analysis) of the stock market; stock focus lists; special situation focus lists; financial planning tips and discussions; stock highlights; and the Intrinsic Value Wealth Creation Pyramid.

We are offering the Intrinsic Value Wealth Report Newsletter as a “Pay What You Want” subscription. Newsletters have different values to different subscribers. So, you pay what the newsletter is worth to you. It could be anywhere from $1.00 to $99.00 – it’s your choice. This is a “value for value” model – pay only for the value that YOU get out of the newsletter. It’s that simple!

The original Intrinsic Value Wealth Report, which has been a free membership site since its founding in 2012, will remain free. It is my belief that educational material should be free and easily accessible to everyone. That will always be the mission of the Intrinsic Value Wealth Report.

I hope that you enjoy both reports, the Intrinsic Value Wealth Report and the Intrinsic Value Wealth Report Newsletter; and all of the publications that are associated with them.

All the best,

Dr. Paul M. Wendee

Editor and Publisher

Posted in Economic & Business Chart Room, Economic Outlook, Entrepreneurship, Focus List, Investment Recommendations, Investments, Notes From The Field, Special Situations, Uncategorized, VDI/REEP, Visionary Ideas | Tagged , , , , , , , , , , , , , , , , , , , , , , , , | Comments Off on Welcome to the New Intrinsic Value Wealth Report Newsletter