WEEKLY COMMENTARY February 23, 2021

Is Listening To Your Gut A Good Idea?

What does your gut feeling tell you about today’s stock market? Is it overvalued, as many value investors believe? Is it going to the moon, as growth investors (and many millennials!) believe? How much should you rely on your gut?

An interesting article in the Wall Street Journal (Zweig, 2021) suggests that your gut feelings can be a powerful, if not correct, influencer on your investing behavior.

As an example, Zweig points out two conflicting narratives about today’s markets. From the value investor’s perspective, the stock market has risen well into speculative bubble territory; but growth investors expect that the markets will continue and that there is actually an economic recovery taking place. Some economists point to the long-term damage done to the economy as a result of the pandemic, the huge amount of debt, and the possible resurgence of the coronavirus, among other things, that could lead to a very slow recovery. Other economists see signs of stronger economic recovery. Who’s right? It’s difficult to tell. But many people rely upon gut feeling and intuition to guide their investment behavior. In general, that is not the best approach when used alone.

According to Zweig, “Evolution finely tuned our bodies to potential changes in risk and reward, preparing our ancestors for fight or flight in the presence of prey or predators.” Sahib Khalsa, a neuroscientist at the Laureate Institute for Brain Research in Tulsa, Oklahoma, says: “What we’re really talking about [with] gut feelings is how people sense their internal milieu, which encompasses a multitude of different signals, coming from all over the place within the body. The brain is constantly sampling and receiving all these signals, even if you’re not consciously aware of that.”

So, how can you use gut feelings more effectively to make decisions? Zweig suggests that you write down your hunches, attach reasons why you believe they might be true, and assign probabilities to them. In other words, write down as much factual detail as possible. And then use that analysis, along with the gut feeling, to make your investment decision. “The solution is to adopt rules and procedures that enable you to listen to your gut without being ruled by it,” notes Zweig.

One very good analytical model to use in understanding the world and its events is reversion toward the mean. I have been researching this powerful concept and will be writing an article on it in an upcoming Commentary.

References

Zweig, J. (2021). Why your wild trading ideas feel so right. The Wall Street Journal. New York, Dow Jones: B1.

Economic and Investment Highlights

Last Week

Struggling companies are getting funding at low rates from Wall Street amid a Wall Street lending boom.

Bitcoin rose above $50,000 for the first time.

The U.S. economy picked up steam in January with retail sales increasing at the highest rate in seven months; manufacturers continued to increase output; and employers continued to hire. Much of this increase was due to stimulus checks. Nonetheless, the pandemic continues to weigh on the economy and the recent winter weather has caused disruptions. Initial jobless claims rose during the first half of February.

U.S. life expectancy declined by a year in 2020 due mainly to Covid-19.

The Dow rose for the week while the S&P 500 and the Nasdaq fell for the week. The Dow was up 0.1%; the S&P 500 was down 0.71%; and the Nasdaq was down 1.6%. The 10-year treasury yield ended the week at 1.344%. Gold closed at $1,775.80 for the week. Oil closed at $59.24 for the week.

The Week Ahead

This link takes you to Econoday’s Economic Calendar and Economic Events and Analysis which shows the upcoming economic reporting events scheduled in the week and months ahead.

Summary

Note: The models below may not capture the impact of COVID-19 beyond their impact on GDP source data and relevant economic reports that have already been released. They may not anticipate the impact of COVID-19 on forthcoming economic reports beyond the standard internal dynamics of the models.

Note: The comments that follow are derived from the economic indicators referenced in the Resources section of this newsletter and other sources in this report.

The Aruoba-Diebold-Scotti Business Conditions Index (ALS) had been trending up for several weeks from having dipped in 2019. Recently with the advent of the economic collapse, the index crashed. It has now been generally trending down again, but fluctuating within a narrow band. This is a slightly positive indicator for the economy on a short-term basis.

The GDPNow model estimate for real GDP growth (seasonally adjusted annual rate) in the fourth quarter of 2020 is 7.4 percent. This reading agrees with the ALS model assessment of an improving short-term economic environment.

The New York Fed Staff Nowcast stands at 8.3 percent for 2021:Q1.

The Chicago Fed National Activity Index (CFNAI) showed an increase in economic activity in October. The Chicago Fed National Activity Index (CFNAI) was +0.52 in December, up from +0.31 in November.

All told, these short-term economic indicators are a mixed analysis for the economy, at least on a short-term basis.

Expectations that stock prices will rise over the next six months is now at 37.7% in a recent AAII Sentiment Survey. The historical average is 38.0% for the survey. 24.0% of the investors in the survey described their short-term outlook as neutral and 38.3% were bearish. Please see the AAII Sentiment Survey for the complete results.

The latest Gross Output (GO) reading (December 22, 2020) showed that Gross Output rose significantly in the 3rd quarter 2020.

Advisor Perspectives publishes a monthly market valuation update.

Advisor Perspectives has market valuation and other useful and interesting investment information at this website.

First Quarter 2021 Survey of Professional Forecasters

Stronger Economic Rebound with Lower Unemployment

[Release Date: February 12, 2021] The outlook for the U.S. economy over the next three years looks stronger now than it did three months ago, according to 39 forecasters surveyed by the Federal Reserve Bank of Philadelphia. The panel predicts real GDP will grow at an annual rate of 3.2 percent this quarter, unchanged from the prediction in the last survey. However, over the remaining quarters in 2021 and the following two years, the panelists see a stronger rebound in output growth than they predicted previously. On an annual-average over annual-average basis, the forecasters expect real GDP to grow at an annual rate of 4.5 percent in 2021 and 3.7 percent in 2022. The projections for 2021 and 2022 are up from 4.0 percent and 3.0 percent, respectively, in the last survey.

A brighter outlook for the unemployment rate accompanies the outlook for growth. The forecasters predict unemployment will decrease from a projected 6.3 percent this quarter to 5.1 percent in the first quarter of 2022. On an annual-average basis, the panelists predict the unemployment rate will decline from a projected 5.9 percent in 2021 to 4.0 percent in 2024. The annual-average projections for 2021, 2022, and 2023 are 0.4 percentage point below those of the last survey.

On the employment front, the forecasters have revised downward their estimates for job gains in 2021. The projections for the annual-average level of nonfarm payroll employment suggest job gains at a monthly rate of 223,400 in 2021, down from 321,600 projected three months ago. (These annual-average estimates are computed as the year-to-year change in the annual-average level of nonfarm payroll employment, converted to a monthly rate.) 

The next survey will be released on May 14, 2021

NABE Surveys

NABE Business Conditions Survey – January 2021

COMMENTS: “Results of the January NABE Business Conditions Survey show that conditions continued to improve during the last quarter of 2020 after the collapse experienced during the first half of last year,” said NABE President Manuel Balmaseda, CBE, chief economist, CEMEX. “Momentum has continued to build, and survey respondents seem much more positive about the future today than in October. Furthermore, expectations regarding GDP growth continue to improve, with 69% of respondents expecting growth in inflation-adjusted gross domestic product over the next year of 3.0% or higher, compared to just 59% in the October survey.” 

HIGHLIGHTS

• Respondents’ views continue to coalesce around an expansionary outlook for growth in inflation-adjusted gross domestic product (real GDP), with 69% of panelists expecting GDP to expand by 3.0% or more. Just 2% of respondents anticipate negative growth over the year ahead (ending in Q4 2021). This compares favorably with results of the July 2020 survey in which nearly 40% of respondents anticipated shrinking output growth over the four quarters ending in Q2 2021, as well as with results in the October 2020 survey in which roughly 10% viewed negative growth as most likely.

• Just over half (51%) of respondents report that sales at their firms increased in Q4 2020, nearly matching the 52% in the October survey who reported an increase in Q3. The share that reports a decrease in sales declined from 20% in October to 13% in the January survey. As a result, the Net Rising Index (NRI) for sales—the percentage of panelists reporting rising sales minus the percentage reporting falling sales—climbed to a two-year high of 38, up from 33 in October and -14 in July. The forward-looking NRI for anticipated sales over the next three months continues to rise, from 31 in October to 38—the highest reading since the April 2019 survey.

• Profit margins reversed course in Q4, with more respondents reporting profits rising than falling. The NRI for profit margins increased 18 points to 14 from -4 in October. The share of respondents reporting rising profit margins increased from 21% in October to 30% in January, while the percentage reporting falling margins declined 9 percentage points— from 25% in October to 16% in January. Of the survey’s four sectors, the goods-producing sector experienced the largest jump in the NRI for profit margins, a 56-point swing from -18 in October to 38 in January.

• The NRI for prices charged is 15, having surged 14 points from October. NRIs by sector, however, vary significantly. The January NRI for goods-producing firms is 71, after registering 21 in October. The index for finance, insurance, and real estate (FIRE) sector firms remains negative at -12, up from -19 in October. Between these extremes are the NRI for service sector firms, with a reading of 8, up from 3 in October, and the NRI of 25 for the transportation, utilities, information, communications (TUIC) sector. The share of respondents expecting price increases in the next three months continues to rise—35% in January compared to 26% in October—resulting in an NRI of 30. Five percent of panelists anticipate falling prices in the next three months.

• The NRI for materials costs accelerated to an NRI of 28, the highest reading since April 2019. All sectors registered positive NRIs, led by goods-producers at 62. The NRI for expected costs rose significantly, from 8 to 34, after having been as low as -21 in April 2020.

• The NRI for wages and salaries rebounded to 19 in the January survey, a clear continuation in the recovery from the depths of the COVID-19 slump during 2020. The upward movement in the index resulted from an increase in the share of respondents citing rising wages—to 28% from 17% in October—and a decrease to 9% from 13% in the share reporting falling wages.

• The NRI for employment rose to 7—the highest reading since October 2019, and the first positive value since April 2020. The share of respondents citing decreased hiring activity fell from 27% to 13%, while 19% report employment increased at their firms compared to 9% in the October survey. All sectors have positive NRIs. The NRI for the services sector rose from -5 in October to 6. The largest increase is in the goods-producing sector, up 54 points to 8 in January. Respondents remain optimistic regarding the near-term outlook for employment, as the forward-looking NRI rose to 21 from 1 in the October survey. Respondents from all sectors expect their firms will add jobs rather than reduce headcount in the near term.

• Fifty-six percent of respondents report there were no shortages of inputs in Q4 2020—slightly smaller than the percentage in the October survey. The largest increase is in the share of respondents reporting shortages in skilled labor—up from 16% in October to 24%. The share reporting shortages of unskilled labor increased from 2% to 7%.

• After negative readings for three straight quarters, the NRI for capital spending bounced back strongly in the fourth quarter, rising from -8 to 15—the highest reading in one year. Twenty-eight percent of respondents report that capital spending at their firms rose during Q4, up from 19% in Q3, with the percentage citing declining investments shrinking from 27% to 13%. Six-in-ten note no change in capital expenditures over the past three months. The forwardlooking NRI for capital spending is strongly positive, rising from 6 in October to 22 in January. The percentage of respondents expecting increased activity jumped from 19% to 34%.

• Businesses continue to make changes to employment and wages in response to COVID-19, albeit less so than in the October survey. Reducing employee headcount was the most common response, cited by 34% of respondents. But this is down from 54% in October and 68% in July.

• Respondents’ near-term outlook is little changed compared to that in the October survey. Thirty-four percent of respondents report a “Better” outlook compared to a month ago, down slightly from 36% in October. Only 6% cite a “Worse” near-term outlook, compared to 8% in the previous survey.

• Sales volumes improved in the fourth quarter of 2020. Fifty-two percent of respondents report sales volumes at “76-100% of pre-crisis level,” up from 46% in the previous survey. Furthermore, 23% indicate that sales at their companies are already above pre-crisis levels, matching the October reading, and led by the TUIC and goods-producing sectors.

• Nearly one-third (32%) of respondents reports that sales volumes have already returned to their normal level of operations, while 36% expect that to happen sometime in 2021.

• Only 5% of respondents report that their firms have either applied or are planning to apply for Main Street Lending programs, up slightly from 3% in the October survey.

• Roughly half (51%) of respondents anticipates that their firms will suspend their stay-at-home policies in the second half of 2021, up from 22% in the October survey.

• Eleven percent of panelists expect that all of the staff at their firms will eventually return to pre-pandemic working arrangements. Those from the services sector account for the largest share holding this view.

• Nearly half of respondents (46%) indicates that the vaccine rollout or new administration will have “No” impact on their firm’s outlook for sales, hiring, capex, etc. Conversely, 37% of respondents indicate “Yes, positive,” while 5% cite “Yes, negative.”

NABE Outlook Survey – December 2020

SUMMARY: “The NABE [National Association for Business Economics] Outlook panel anticipates more moderate growth in economic activity going forward after the sharp rebound during the third quarter,” said NABE President Manuel Balmaseda, CBE, chief economist, CEMEX. “The median forecast calls for a 4.1% annualized growth rate in the fourth quarter of 2020 for inflation-adjusted gross domestic product, or real GDP. In addition to the 33.1% GDP growth in the third quarter of the year, this would reverse much of the 32% annualized decline from the second quarter. However, the panel has become slightly less bullish about 2021. The median real GDP growth estimate for 2021 is 3.4%, slightly less than the 3.6% forecasted in the October survey.” “NABE panelists have become more optimistic, on balance, with nearly one-third revising their outlook higher based on recent news of effective vaccines,” added Survey Chair Holly Wade, executive director, NFIB Research Center. “Seventy-three percent of panelists believe that the economy will have returned to pre-pandemic GDP levels by the second half of 2021, 18% expect it to reach that level in the first half of 2022, and 10% believe it will occur in the second half of 2022 or later. The 73% is a dramatic improvement from the October survey in which 38% of panelists believed that a full recovery would occur before 2022. “Just over one-third of respondents anticipate more downside risk to economic growth in 2021,” continued Wade. “Panelists point to a second wave of COVID-19 cases as their main concern.”

The National Association for Business Economics (NABE) released its October Outlook Survey which is summarized as follows: “The NABE Outlook panel sees a strong rebound in economic activity after the collapse experienced during the second quarter,” said NABE Vice President Manuel Balmaseda, CBE, chief economist, CEMEX. “The median forecast calls for a 25% annualized growth rate in the third quarter of 2020 for inflation-adjusted gross domestic product, or real GDP. That would reverse much of the 31% annualized decline from the second quarter. However, the panel has become less bullish about the fourth quarter of 2020, as well as 2021. The median real GDP growth estimate for 2021 is 3.6%, compared to a 4.8% forecast in the June survey.”

“NABE panelists have become more optimistic, on balance, but remain concerned about a potential second wave of COVID-19,” added Outlook Survey Chair Eugenio Aleman, economist, Wells Fargo Bank. “Thirty-eight percent of panelists believe that the economy will have returned to pre-pandemic GDP levels by the second half of 2021, 32% expect it to reach that level in the first half of 2022, and 30% believe it will occur in the second half of 2022 or later.

“About half of the panelists put the odds of a double-dip recession at 20% or less,” continued Aleman. “In contrast, one out of eight panelists places those odds at 50% or higher.”

Other highlights from the survey:

The median forecast calls for the unemployment rate to average 8.4% in 2020, 2.5 percentage points lower than the median forecast in the previous survey. Panelists expect the unemployment rate to decline each quarter, averaging 6.8% in 2021, compared with the 8% previously forecasted. The unemployment rate averaged 3.7% in 2019.

Panelists look for business investment to drop sharply this year. Real nonresidential fixed investment is forecasted to decline 6%. Panelists anticipate real nonresidential fixed investment to rise only gradually in 2021, increasing 2.4%.

Survey respondents expect inflation—as measured by the GDP price index—to be significantly lower in 2020 and 2021 relative to 2019. Inflation is forecasted to be 1.0% in 2020 and 1.5% in 2021. The index increased 1.8% in 2019.

Panelists expect the consumer price index (CPI) to rise 1.2% in 2020, significantly lower than the actual 1.8% growth in consumer prices in 2019. The 2020 forecast median has increased since the June survey, when panelists saw CPI rising by 0.7%. The panel anticipates consumer price growth will pick up moving forward, with a 1.9% annual average gain in 2021.

Panelists expect corporate profits to contract by 11% in 2020. The median forecast calls for profits to increase by 8.5% in 2021.

Four out of ten panelists indicate that 5% of jobs will be permanently lost due to firms closing. More than half of the panel suggest between 10% and 20% of job losses will be permanent.

Thirty-eight percent of panelists believe that the economy will have returned to pre-pandemic GDP levels by the second half of 2021; only 2% suggest this will occur before the end of 2020, 12% believe GDP will recover in the first half of 2021, and 24% anticipate such a return in the second half of 2021. Thirty-two percent of respondents expect GDP to reach pre-pandemic levels in the first half of 2022, and 22% believe it will occur in the second half of 2022.

For a more in-depth review and analysis of the economy, please see our mini-book on economic analysis and forecasting entitled: Simple and Effective Economic Forecasting.

NABE October Business Conditions Survey

“The October NABE Business Conditions Survey shows that firms are continuing to gain ground since the sharp economic downturn experienced in the first half of the year,” said NABE President Manuel Balmaseda, CBE, chief economist, CEMEX. “This momentum is expected to continue through the rest of 2020. In addition, more respondents than in the July survey anticipate stronger growth in inflation-adjusted gross domestic product over the next year.”  “More respondents in this survey report continued improvements, especially in sales and profit margins, at their firms during the past three months than in the July survey,” added NABE Business Conditions Survey Chair Holly Wade, executive director, NFIB Research Center. “Capital spending is also picking up steam, with more firms investing in their businesses over the past three months, and more planning to do the same in the next three months. “The employment picture is less rosy, with many firms still holding back on wage and staff increases,” continued Wade. “While slightly more respondents report an increase in employment at their firms over the last three months than in the previous survey, more also report a decrease in employment. Most firms are also forgoing raises to control costs with 70% of respondents’ firms reporting unchanged wages and salaries over the last two quarters, the highest reading since January 2014.”

Higlights

• The panel’s consensus outlook for the U.S. economy, measured by year-over-year growth in inflation-adjusted gross domestic product (real GDP), continued to improve in October compared to that in the two previous surveys. Eighty-nine percent of panelists expect real GDP to increase from the third quarter (Q3) of 2020 to Q3 2021. Only 9% of respondents expect the real GDP change to be zero or negative, compared to 31% of respondents who held this view in the July survey when asked about the outlook for the 12 months ending Q2 2021.

• For the first time since April 2019, a majority of respondents’ firms reports increased sales at their firms, with 52% indicating rising sales during Q3. The Net Rising Index (NRI) for sales—the percentage of panelists reporting rising sales minus the percentage reporting falling sales—surged upward, increasing 47 points to 33, up from -14 in July. The forward-looking NRI for anticipated sales over the next three months also rose, adding to the sharp increase reported in the July survey. The NRI for anticipated sales increased 13 points, from 18 in July to 31, with positive readings in three of the four industry sectors.

• Profit-margin increases were more widespread in Q3 2020, but remained less prevalent than decreases among respondents’ firms, with the NRI for profit margins increasing 21 points to -4. The share of respondents reporting rising profit margins increased from 15% in July to 21% in October, while the percentage reporting falling margins declined 15 percentage points—from 40% in July to 25% in October.

• The NRI for prices charged returned to neutral in October—registering +1—following the sharp decline during the first half of 2020, that brought the NRI in July to its lowest level since 1987. NRIs by sector, however, vary significantly. The NRI for goods-producing firms is 21, after registering -40 in July. But the index for finance, insurance, real estate (FIRE) sector firms remains negative with an NRI of -19. Between these extremes are the NRI for services, with a reading of 3, and the NRI of 8 for the transportation, utilities, information, communications (TUIC) sector. The share of respondents expecting price increases in the next three months rebounded from levels in the previous two surveys to 26% in October, resulting in an NRI of 20. Six percent anticipate falling prices in the next three months.

• The NRI for materials costs also rebounded from two quarters of negative readings to a reading of 10. All sectors registered positive NRIs, led by goods-producers at 15, bouncing back from -56 in July. The NRI for expected costs rose modestly, from 1 to 8, having been as low as -21 in April.

• Hiring at respondents’ firms remains depressed. The third-quarter NRI for employment levels over the last three months is -17, compared to -19 in the July survey. Even as the NRI improved, the share of respondents indicating there was decline in employment at their firms rose to 27% from 24% in the July survey. At the same time, 9% report employment increases at their firms, compared to 5% in July. The outlook for employment deteriorated in Q3, as the NRI for hiring expectations declined to just 1, down from 6 in the July survey. Respondents from the goods-producing and TUIC sectors expect their firms will add jobs in the next three months. In the July survey, three of the four sectors had positive NRIs for expected employment change in Q3 2020.

• The NRI for wages and salaries rebounded 13 points to 4 in the October survey. The upward movement in the index reflects an increase to 17% from 11% in July in the share of respondents citing rising wages, and a decrease to 13% from 19% in the share reporting falling wages. The forward-looking NRI for wages and salaries moved from 0 in July to 15 in October.

• Almost two-thirds of respondents report no shortages of inputs in Q3 2020, similar to results from the July survey. The share of respondents reporting shortages is virtually unchanged in the current survey across all inputs, except for a decline in the percentage indicating intermediate input shortages.

• The NRI for capital spending improved, from -19 in July to -8 in October. Fewer respondents report continuing declines in spending, while more indicate their firms’ capital spending increased during Q3 2020. However, service-sector panelists report not much improvement from the prior two readings. The forward-looking NRI for capital spending rose considerably, from -40 in April to 6 in October, as fewer respondents expect declines in spending over the next 3 months.

• In response to COVID-19, businesses continue to adjust employee headcount and wages. Imposing a hiring freeze is the most common response, cited by 69% of respondents.

• Respondents’ near-term outlook improved slightly in October compared to that in the July survey. Thirty-six percent of respondents report a “Better” near-term in October, compared to 34% in July. Only 8% indicate their near-term outlook is “Worse” in October, compared to 12% in July.

• Twenty-three percent of respondents report that sales at their companies are at “more than 100% of pre-crisis level,” an increase from the 15% in the July survey.

• Thirty-one percent of respondents expect sales to return to normal “sometime in 2021,” while 24% do not expect sales to return to normal until sometime in 2022. Only 10% expect sales to return to normal by the end of 2020.

• Only 3% of respondents report that their firms applied, or are planning to apply, for Main Street Lending programs.

• Thirty-five percent of respondents indicate their firms have implemented new work-at-home policies, allowing “all employees” to work from home during the pandemic. Another 33% allow “most employees” to work from home, while 16% only allow “some employees” to work from home.

• Thirty-one percent of respondents report that their firms will wait for “progress regarding COVID-19” before changing their work-from-home policies. Twenty-two percent indicate their companies will wait until the second half of 2021, while 16% of firms plan to suspend work-from-home policies in the first half of 2021.

Stock Market Valuations

Our estimates of the market valuations for two stock market indices, the Dow Jones Industrial Average (DJIA) and the Standard & Poor’s 500 (S&P 500), can be found in the file below:

Conclusion

During this time of global flux due to the coronavirus, I am leaving the Conclusion discussion below the same as was posted on March 23, 2020. The March 23, 2020 discussion still adequately reflects my thinking on the current state of affairs.

Important Note: While I don’t believe it is time to jump back into the stock market in a big way because of the market’s overvaluation, I have been advising the last few of weeks in this Commentary and in my weekly podcast, Intrinsic Value Wealth Report Radio, that investors can continue building their investment portfolios by selecting individual securities that offer growth and value opportunities.

Reprinted from March 23, 2020

Up until the past week, the economy had been in a stable but somewhat vulnerable state. Nonetheless, it had remained fairly strong. In fact, robust consumer spending and strong labor market conditions had given us confidence that the economy, which had been in its tenth year of expansion, could continue to grow. But we were cautious on this outlook. There were several reasons for our caution. U.S. business growth had been mixed. And global economic growth had been mixed as well. The new coronavirus was becoming a global economic threat, although it was still too early to tell how much of an effect it would ultimately have. Debt is at high levels for consumers, businesses, and government (at all levels of government). Finally, this is an election year that will likely have significant consequences either positively or negatively depending on the outcome of the elections. And of course, it is still too early to tell what the outcome of the elections will be.

In just a few days, the coronavirus’s effect on the economy and the markets went from a ripple to a tsunami. Businesses are shuttering, events are being cancelled or postponed, grocery store shelves are empty, and people are being asked or ordered to stay home. The markets are now deep in bear market territory. The effects on the economy, even given the short time that the economy has been retreating, may be with us for a long time. There is now a much greater risk of a recession, and there has even been some talk of a depression. The government, the Fed, Republicans, and Democrats, and pretty much the entire country, is trying to get the virus under control and is coming up with plans to mitigate the long-term economic effects caused by the virus. But the virus has impacted the economy – in a significant way – in just a short time. How long lasting the effects will be no one can tell right now. The economy has been largely shut down and remains so today. It takes time to restart the economy after a situation such as what is occurring at the present time.

Given these events and the rapidly deteriorating situation, as I said last week, I would caution not to panic. The economy and the markets will get better. The situation is bad – there is no doubt about that – but it will turn around. The real question is when will it turn around? No one knows that at the present time. But it will turn around.

For now, review your investment portfolios. It is highly likely that all or most of your stocks are down. You should not consider selling the bulk of your stocks – only consider selling companies that are not sound companies. But do recognize that as the economy deteriorates, even good companies will be affected.

For stock market value hunters, we believe it is still too early to jump back in. We will be closely monitoring the markets using the many tools and models that we have developed over the years to assess the economy and the markets. We will use our best judgement and thoughts to let you know when we believe things are turning around. The turnaround hasn’t happened yet.

We believe it is important to maintain a long-term view toward investing. But for now, just sit tight. Eventually, this means that you should continue building your investment portfolio using the Cassandra Stock Selection Model to select individual securities that offer growth and value opportunities.

Chart for Review and Thought

Unemployment Rate

Simple and Effective Economic Forecasting Model

Note: The table and chart below have not been updated. However, we believe that a recession is quite likely. In the chart below, the bottom green line shows what a recession could look like.

Notes (GDP Growth Chart):

  1. See the July 8, 2019 Commentary for an introduction to this model.
  2. Actual numbers 2007 through 2019; forecasted numbers thereafter.
  3. Normal GDP growth is typically in the 2% to 3% range.
  4. A recession is generally defined as two consecutive quarters of negative economic growth as measured by a country’s gross domestic product (GDP).

Thought for the Week

“Functionality is the inverse of style” ~ Joseph Giarratano

Announcements

The Intrinsic Value Wealth Report has started a new YouTube channel called Intrinsic Value Wealth Report TV. You can view the YouTube channel at Intrinsic Value Wealth Report TV.

The Intrinsic Value Wealth Report has started a new podcast called Intrinsic Value Wealth Report Radio. You can listen to the podcast at Intrinsic Value Wealth Report Radio.

Dr. Wendee spoke at the Investment Club of America’s annual economic summit, called Econosummit, on Sunday March 1, 2020 in Las Vegas.

Dr. Wendee attended the The National Due Diligence Alliance (TNDDA) investment banking conference, which was held March 6-8, 2020 at the Four Seasons Resort in Dallas, Texas. This is a conference held several times throughout the year for investment bankers and registered investment advisers to learn about new opportunities in the Alternative Investment asset classes.

TNDDA Meeting in Dallas, Texas

We have been researching the use of crowdsourcing for investment ideas. We will be sending a survey out in the next few weeks to get your input on the economy and the markets; and to get any investment ideas that you would like to share. We will compile this input and distribute the results to you and our other subscribers. We have been testing our crowdsourcing models with students and have been having good success and results.

Dr. Wendee has been researching and writing a new theory of economics known as, The Value Creation Theory of the Economy (also known as, Intrinsinomics). The full paper on Intrinsinomics will be published in the near future.

Finance 3350: Personal Finance-Portfolio & Risk Management– Dr. Wendee taught teaching Finance 3350 – Portfolio & Risk Management at California State University, Los Angeles (CSULA) for the Summer term starting May 2020. Dr. Wendee teaches courses in Management and Finance at CSULA.

Business 548: Strategy and Decision Making – Dr. Wendee taught Business 548 – Strategy and Decision Making at California Baptist University (CBU) starting at the end of June 2020. Dr. Wendee teaches courses in Finance, Business, Strategy & Decision Making, and Economics at CBU.

Business 303: Business Finance – Dr. Wendee taught Business 303 – Business Finance at California Baptist University (CBU) starting at the end of August 2020. Dr. Wendee teaches courses in Finance, Business, Strategy & Decision Making, and Economics at CBU.

Business 539: Financial Management – Dr. Wendee is teaching Business 539 – Financial Management at California Baptist University (CBU) which started at the end of October. Dr. Wendee teaches courses in Finance, Business, Strategy & Decision Making, and Economics at CBU.

Business 217: Microeconomics – Dr. Wendee is teaching Business 217 – Microeconomics at California Baptist University (CBU) which started in January 2021. Dr. Wendee teaches courses in Finance, Business, Strategy & Decision Making, and Economics at CBU.

Business 218: Macroeconomics – Dr. Wendee is teaching Business 218 – Macroeconomics at California Baptist University (CBU) which started in January 2021. Dr. Wendee teaches courses in Finance, Business, Strategy & Decision Making, and Economics at CBU.

Finance 430: Risk Management – Dr. Wendee is teaching Finance 430 – Risk Management at California Baptist University (CBU) which started in January 2021. Dr. Wendee teaches courses in Finance, Business, Strategy & Decision Making, and Economics at CBU.

Dr. Wendee presented a paper on his new theory of economics known as, The Value Creation Theory of the Economy (also known as, Intrinsinomics), at the International Leadership Association’s annual global conference which was held in Ottawa, Canada last Fall.

Dr. Wendee presented an updated paper on his new theory of economics known as, The Value Creation Theory of the Economy (also known as, Intrinsinomics), at the International Leadership Association’s annual global conference which was to have been held in San Francisco, California in November, but which was held virtually instead due to the Coronavirus.

Dr. Wendee delivered a talk entitled: Using Alternative Assets to Increase Portfolio Returns and Decrease Risk at the BrightTalk Q4 2020 Outlook Summit on October 28, 2020. You can access additional information on the summit and Dr. Wendee’s presentation here.

Dr. Wendee delivered a talk  at the BrightTalk conference on December 9, 2020 entitled: Emerging Themes and Great Places to Invest for 2021. You can access additional information on the summit and Dr. Wendee’s presentation here.

Dr. Wendee delivered a talk  at the BrightTalk conference on January 20, 2021 entitled: Developing an Income-Producing Strategy for 2021 and Beyond. You can access additional information on the summit and Dr. Wendee’s presentation here.

Dr. Wendee is working on a financial planning modeling program which will be available in the near future. The modeling program is designed to assist anyone in creating a financial plan and is customizable for each person’s unique financial planning goals. A working draft of the model is currently in beta test with students. Click this link, schematic, to go to the clickable document under the subheading Financial Planning Process (Draft) in the Intrinsic Value Wealth Report to see a draft of the schematic for the new financial planning process.

Dr. Wendee has been developing an econometric model specifically designed to monitor and forecast the global economy as this current economic crisis unfolds. This new econometric model is based on other econometric models that he has designed and have used for many years. You can find some of these earlier models in Book # 6 – Simple and Effective Economic Forecasting in the sister website to this website which is called the Intrinsic Value Wealth Report. The new econometric model has been constructed with some additional tools and methods that he has learned and some that he has developed over the last several years. He will be talking more about this new econometric model in this Commentary over the next few months. His comments and forecasts on the economy and the markets going forward will be based to a significant extent on this new model.

We have begun raising capital for our fund-of-funds investment, Northwest Quadrant Opportunity Fund, LLC. The fund engineers and constructs an investment vehicle consisting of Alternative Asset investments. The fund’s objective is to build a diversified portfolio of strong, solid, steady- performing assets, with highly qualified asset managers who have proven track records that meet our underwriting requirements. To learn more about the Northwest Quadrant Opportunity Fund, LLC and to obtain an offering memorandum, please click Northwest Quadrant Opportunity Fund, LLC.

Intrinsic Value Wealth Creation pyramid

We always conclude our commentary with a discussion of the Intrinsic Value Wealth Creation Pyramid. The Intrinsic Value Wealth Creation Pyramid is designed to show some of the major categories for building wealth. It is the result of many years of study of the wealth building process; experience working with clients who have built considerable wealth; and my own personal experience building wealth. Newsletter subscribers should consult the Intrinsic Value Wealth Creation Pyramid as one of many useful investment tools while considering their investment plans.

The chart in this section is an expanded version of the Intrinsic Value Wealth Creation Pyramid Chart referenced in the Forbes.com article entitled, Nine of the Best Ways to Build Wealth.

RESOURCES

See our Resources section for links to economic and other resources used in the preparation of this Commentary.

Posted in Economic & Business Chart Room, Economic Outlook, Entrepreneurship, Focus List, Investment Recommendations, Investments, Notes From The Field, Special Situations, Uncategorized, VDI/REEP, Visionary Ideas | Tagged , , , , , , , , , , , , , , , , , , , , , , , , , , , , , , , , , | Comments Off on WEEKLY COMMENTARY February 23, 2021

WEEKLY COMMENTARY February 16, 2021

Exponentially Speaking

If you take a penny and double it every day for 30 days, how much will you have at the end of the 30 days? (Answer: $10,737,418.24).

If you start with one drop of water, how long does it take to fill an average size stadium with water if you double the amount of water every minute? (Answer: less than one hour. One of my students calculated it as 46 minutes).

If one person gives the coronavirus to two people; and those two people give the virus to two other people; and so on; how many instances of that doubling have to occur before over 100 million people are infected? (Answer: 27 instances – which results in 134,217,728 cases of infection).

These three examples are all instances of exponential growth. Exponential growth is one of the most powerful forces in nature and one of the most powerful influences in the world. Reflecting on the subject of compound interest (which is exponential growth), Albert Einstein is reported to have said, “Compound interest is the eighth wonder of the world. He who understands it, earns it; he who doesn’t, pays it.” But as the examples above show, exponential growth can be both a good and a bad thing. In the case of doubling a penny for 30 days, that is a good thing. In the case of the coronavirus, that has been and continues to be a bad thing.

Here is the formula for compounding:

FV = PV (1 + i) n

Where:

FV = Future Value

PV = Present Value

i = compounding rate

n = number of periods

Try putting these numbers in the formula for doubling the penny. The compound rate (i) is 1, (or 100% in the formula). The number of periods, n, is 30. The present value (starting value) is one penny (.01). The answer: $10,737,418.24.

I have my business, economics, and finance students also learn the discounting formula, or Intrinsic Value, as it is sometimes known, which is:

PV = FV/ (1 + i) n

Where:

FV = Future Value

PV = Present Value

i = compounding rate

n = number of periods

These two powerful formulas are the most important formulas in finance and business, I believe. Understanding these two formulas and their vast implications is the key to understanding finance and business. We will explore the second formula, the discounting formula, which is also known as Intrinsic Value, in a later Commentary in this newsletter.

The coronavirus has become a pandemic because of its exponential nature. It will take social distancing, masking, handwashing, and other common-sense health and hygiene measures to halt or slow its exponential growth

Economic and Investment Highlights

Last Week

Oil prices have rallied to pre-pandemic levels.

Tampa Bay Buccaneers won the Super Bowl against the Kansas City Chiefs.

Tesla said it bought $1.5 billion in bitcoin. CEO Musk has also been promoting another digital currency, dogecoin, in Tweets.

The CBO said raising the minimum wage to $15 an hour by 2025 would lift 900,000 people out of poverty but would cost 1.4 million jobs.

Loan growth shrank in 2020 for the first time in a decade.

The CBO said U.S. deficits are projected to rise over the next decade.

Bank of New York Mellon said it would hold, transfer, and issue bitcoin and other crypto currencies on behalf of asset management clients.

The DOJ has launched a market manipulation criminal probe into the trading frenzy surrounding GameStop, AMC and other stocks.

Britain’s economy recorded its biggest contraction in over three centuries in 2020.

The Dow, the S&P 500, and the Nasdaq all rose for the week. The Dow was up 1%; the S&P 500 was up 1.2%; and the Nasdaq was up 1.7%. The 10-year treasury yield ended the week at 1.199%. Gold closed at $1,821.60 for the week. Oil closed at $59.47 for the week.

The Week Ahead

This link takes you to Econoday’s Economic Calendar and Economic Events and Analysis which shows the upcoming economic reporting events scheduled in the week and months ahead.

Summary

Note: The models below may not capture the impact of COVID-19 beyond their impact on GDP source data and relevant economic reports that have already been released. They may not anticipate the impact of COVID-19 on forthcoming economic reports beyond the standard internal dynamics of the models.

Note: The comments that follow are derived from the economic indicators referenced in the Resources section of this newsletter and other sources in this report.

The Aruoba-Diebold-Scotti Business Conditions Index (ALS) had been trending up for several weeks from having dipped in 2019. Recently with the advent of the economic collapse, the index crashed. It has now been generally trending down again, but fluctuating within a narrow band. This is a slightly positive indicator for the economy on a short-term basis.

The GDPNow model estimate for real GDP growth (seasonally adjusted annual rate) in the fourth quarter of 2020 is 7.4 percent. This reading agrees with the ALS model assessment of an improving short-term economic environment.

The New York Fed Staff Nowcast stands at 6.71 percent for 2021:Q1.

The Chicago Fed National Activity Index (CFNAI) showed an increase in economic activity in October. The Chicago Fed National Activity Index (CFNAI) was +0.52 in December, up from +0.31 in November.

All told, these short-term economic indicators are a mixed analysis for the economy, at least on a short-term basis.

Expectations that stock prices will rise over the next six months is now at 37.7% in a recent AAII Sentiment Survey. The historical average is 38.0% for the survey. 24.0% of the investors in the survey described their short-term outlook as neutral and 38.3% were bearish. Please see the AAII Sentiment Survey for the complete results.

The latest Gross Output (GO) reading (December 22, 2020) showed that Gross Output rose significantly in the 3rd quarter 2020.

Advisor Perspectives publishes a monthly market valuation update.

Advisor Perspectives has market valuation and other useful and interesting investment information at this website.

First Quarter 2021 Survey of Professional Forecasters

Stronger Economic Rebound with Lower Unemployment

[Release Date: February 12, 2021] The outlook for the U.S. economy over the next three years looks stronger now than it did three months ago, according to 39 forecasters surveyed by the Federal Reserve Bank of Philadelphia. The panel predicts real GDP will grow at an annual rate of 3.2 percent this quarter, unchanged from the prediction in the last survey. However, over the remaining quarters in 2021 and the following two years, the panelists see a stronger rebound in output growth than they predicted previously. On an annual-average over annual-average basis, the forecasters expect real GDP to grow at an annual rate of 4.5 percent in 2021 and 3.7 percent in 2022. The projections for 2021 and 2022 are up from 4.0 percent and 3.0 percent, respectively, in the last survey.

A brighter outlook for the unemployment rate accompanies the outlook for growth. The forecasters predict unemployment will decrease from a projected 6.3 percent this quarter to 5.1 percent in the first quarter of 2022. On an annual-average basis, the panelists predict the unemployment rate will decline from a projected 5.9 percent in 2021 to 4.0 percent in 2024. The annual-average projections for 2021, 2022, and 2023 are 0.4 percentage point below those of the last survey.

On the employment front, the forecasters have revised downward their estimates for job gains in 2021. The projections for the annual-average level of nonfarm payroll employment suggest job gains at a monthly rate of 223,400 in 2021, down from 321,600 projected three months ago. (These annual-average estimates are computed as the year-to-year change in the annual-average level of nonfarm payroll employment, converted to a monthly rate.) 

The next survey will be released on May 14, 2021

NABE Surveys

NABE Business Conditions Survey – January 2021

COMMENTS: “Results of the January NABE Business Conditions Survey show that conditions continued to improve during the last quarter of 2020 after the collapse experienced during the first half of last year,” said NABE President Manuel Balmaseda, CBE, chief economist, CEMEX. “Momentum has continued to build, and survey respondents seem much more positive about the future today than in October. Furthermore, expectations regarding GDP growth continue to improve, with 69% of respondents expecting growth in inflation-adjusted gross domestic product over the next year of 3.0% or higher, compared to just 59% in the October survey.” 

HIGHLIGHTS

• Respondents’ views continue to coalesce around an expansionary outlook for growth in inflation-adjusted gross domestic product (real GDP), with 69% of panelists expecting GDP to expand by 3.0% or more. Just 2% of respondents anticipate negative growth over the year ahead (ending in Q4 2021). This compares favorably with results of the July 2020 survey in which nearly 40% of respondents anticipated shrinking output growth over the four quarters ending in Q2 2021, as well as with results in the October 2020 survey in which roughly 10% viewed negative growth as most likely.

• Just over half (51%) of respondents report that sales at their firms increased in Q4 2020, nearly matching the 52% in the October survey who reported an increase in Q3. The share that reports a decrease in sales declined from 20% in October to 13% in the January survey. As a result, the Net Rising Index (NRI) for sales—the percentage of panelists reporting rising sales minus the percentage reporting falling sales—climbed to a two-year high of 38, up from 33 in October and -14 in July. The forward-looking NRI for anticipated sales over the next three months continues to rise, from 31 in October to 38—the highest reading since the April 2019 survey.

• Profit margins reversed course in Q4, with more respondents reporting profits rising than falling. The NRI for profit margins increased 18 points to 14 from -4 in October. The share of respondents reporting rising profit margins increased from 21% in October to 30% in January, while the percentage reporting falling margins declined 9 percentage points— from 25% in October to 16% in January. Of the survey’s four sectors, the goods-producing sector experienced the largest jump in the NRI for profit margins, a 56-point swing from -18 in October to 38 in January.

• The NRI for prices charged is 15, having surged 14 points from October. NRIs by sector, however, vary significantly. The January NRI for goods-producing firms is 71, after registering 21 in October. The index for finance, insurance, and real estate (FIRE) sector firms remains negative at -12, up from -19 in October. Between these extremes are the NRI for service sector firms, with a reading of 8, up from 3 in October, and the NRI of 25 for the transportation, utilities, information, communications (TUIC) sector. The share of respondents expecting price increases in the next three months continues to rise—35% in January compared to 26% in October—resulting in an NRI of 30. Five percent of panelists anticipate falling prices in the next three months.

• The NRI for materials costs accelerated to an NRI of 28, the highest reading since April 2019. All sectors registered positive NRIs, led by goods-producers at 62. The NRI for expected costs rose significantly, from 8 to 34, after having been as low as -21 in April 2020.

• The NRI for wages and salaries rebounded to 19 in the January survey, a clear continuation in the recovery from the depths of the COVID-19 slump during 2020. The upward movement in the index resulted from an increase in the share of respondents citing rising wages—to 28% from 17% in October—and a decrease to 9% from 13% in the share reporting falling wages.

• The NRI for employment rose to 7—the highest reading since October 2019, and the first positive value since April 2020. The share of respondents citing decreased hiring activity fell from 27% to 13%, while 19% report employment increased at their firms compared to 9% in the October survey. All sectors have positive NRIs. The NRI for the services sector rose from -5 in October to 6. The largest increase is in the goods-producing sector, up 54 points to 8 in January. Respondents remain optimistic regarding the near-term outlook for employment, as the forward-looking NRI rose to 21 from 1 in the October survey. Respondents from all sectors expect their firms will add jobs rather than reduce headcount in the near term.

• Fifty-six percent of respondents report there were no shortages of inputs in Q4 2020—slightly smaller than the percentage in the October survey. The largest increase is in the share of respondents reporting shortages in skilled labor—up from 16% in October to 24%. The share reporting shortages of unskilled labor increased from 2% to 7%.

• After negative readings for three straight quarters, the NRI for capital spending bounced back strongly in the fourth quarter, rising from -8 to 15—the highest reading in one year. Twenty-eight percent of respondents report that capital spending at their firms rose during Q4, up from 19% in Q3, with the percentage citing declining investments shrinking from 27% to 13%. Six-in-ten note no change in capital expenditures over the past three months. The forwardlooking NRI for capital spending is strongly positive, rising from 6 in October to 22 in January. The percentage of respondents expecting increased activity jumped from 19% to 34%.

• Businesses continue to make changes to employment and wages in response to COVID-19, albeit less so than in the October survey. Reducing employee headcount was the most common response, cited by 34% of respondents. But this is down from 54% in October and 68% in July.

• Respondents’ near-term outlook is little changed compared to that in the October survey. Thirty-four percent of respondents report a “Better” outlook compared to a month ago, down slightly from 36% in October. Only 6% cite a “Worse” near-term outlook, compared to 8% in the previous survey.

• Sales volumes improved in the fourth quarter of 2020. Fifty-two percent of respondents report sales volumes at “76-100% of pre-crisis level,” up from 46% in the previous survey. Furthermore, 23% indicate that sales at their companies are already above pre-crisis levels, matching the October reading, and led by the TUIC and goods-producing sectors.

• Nearly one-third (32%) of respondents reports that sales volumes have already returned to their normal level of operations, while 36% expect that to happen sometime in 2021.

• Only 5% of respondents report that their firms have either applied or are planning to apply for Main Street Lending programs, up slightly from 3% in the October survey.

• Roughly half (51%) of respondents anticipates that their firms will suspend their stay-at-home policies in the second half of 2021, up from 22% in the October survey.

• Eleven percent of panelists expect that all of the staff at their firms will eventually return to pre-pandemic working arrangements. Those from the services sector account for the largest share holding this view.

• Nearly half of respondents (46%) indicates that the vaccine rollout or new administration will have “No” impact on their firm’s outlook for sales, hiring, capex, etc. Conversely, 37% of respondents indicate “Yes, positive,” while 5% cite “Yes, negative.”

NABE Outlook Survey – December 2020

SUMMARY: “The NABE [National Association for Business Economics] Outlook panel anticipates more moderate growth in economic activity going forward after the sharp rebound during the third quarter,” said NABE President Manuel Balmaseda, CBE, chief economist, CEMEX. “The median forecast calls for a 4.1% annualized growth rate in the fourth quarter of 2020 for inflation-adjusted gross domestic product, or real GDP. In addition to the 33.1% GDP growth in the third quarter of the year, this would reverse much of the 32% annualized decline from the second quarter. However, the panel has become slightly less bullish about 2021. The median real GDP growth estimate for 2021 is 3.4%, slightly less than the 3.6% forecasted in the October survey.” “NABE panelists have become more optimistic, on balance, with nearly one-third revising their outlook higher based on recent news of effective vaccines,” added Survey Chair Holly Wade, executive director, NFIB Research Center. “Seventy-three percent of panelists believe that the economy will have returned to pre-pandemic GDP levels by the second half of 2021, 18% expect it to reach that level in the first half of 2022, and 10% believe it will occur in the second half of 2022 or later. The 73% is a dramatic improvement from the October survey in which 38% of panelists believed that a full recovery would occur before 2022. “Just over one-third of respondents anticipate more downside risk to economic growth in 2021,” continued Wade. “Panelists point to a second wave of COVID-19 cases as their main concern.”

The National Association for Business Economics (NABE) released its October Outlook Survey which is summarized as follows: “The NABE Outlook panel sees a strong rebound in economic activity after the collapse experienced during the second quarter,” said NABE Vice President Manuel Balmaseda, CBE, chief economist, CEMEX. “The median forecast calls for a 25% annualized growth rate in the third quarter of 2020 for inflation-adjusted gross domestic product, or real GDP. That would reverse much of the 31% annualized decline from the second quarter. However, the panel has become less bullish about the fourth quarter of 2020, as well as 2021. The median real GDP growth estimate for 2021 is 3.6%, compared to a 4.8% forecast in the June survey.”

“NABE panelists have become more optimistic, on balance, but remain concerned about a potential second wave of COVID-19,” added Outlook Survey Chair Eugenio Aleman, economist, Wells Fargo Bank. “Thirty-eight percent of panelists believe that the economy will have returned to pre-pandemic GDP levels by the second half of 2021, 32% expect it to reach that level in the first half of 2022, and 30% believe it will occur in the second half of 2022 or later.

“About half of the panelists put the odds of a double-dip recession at 20% or less,” continued Aleman. “In contrast, one out of eight panelists places those odds at 50% or higher.”

Other highlights from the survey:

The median forecast calls for the unemployment rate to average 8.4% in 2020, 2.5 percentage points lower than the median forecast in the previous survey. Panelists expect the unemployment rate to decline each quarter, averaging 6.8% in 2021, compared with the 8% previously forecasted. The unemployment rate averaged 3.7% in 2019.

Panelists look for business investment to drop sharply this year. Real nonresidential fixed investment is forecasted to decline 6%. Panelists anticipate real nonresidential fixed investment to rise only gradually in 2021, increasing 2.4%.

Survey respondents expect inflation—as measured by the GDP price index—to be significantly lower in 2020 and 2021 relative to 2019. Inflation is forecasted to be 1.0% in 2020 and 1.5% in 2021. The index increased 1.8% in 2019.

Panelists expect the consumer price index (CPI) to rise 1.2% in 2020, significantly lower than the actual 1.8% growth in consumer prices in 2019. The 2020 forecast median has increased since the June survey, when panelists saw CPI rising by 0.7%. The panel anticipates consumer price growth will pick up moving forward, with a 1.9% annual average gain in 2021.

Panelists expect corporate profits to contract by 11% in 2020. The median forecast calls for profits to increase by 8.5% in 2021.

Four out of ten panelists indicate that 5% of jobs will be permanently lost due to firms closing. More than half of the panel suggest between 10% and 20% of job losses will be permanent.

Thirty-eight percent of panelists believe that the economy will have returned to pre-pandemic GDP levels by the second half of 2021; only 2% suggest this will occur before the end of 2020, 12% believe GDP will recover in the first half of 2021, and 24% anticipate such a return in the second half of 2021. Thirty-two percent of respondents expect GDP to reach pre-pandemic levels in the first half of 2022, and 22% believe it will occur in the second half of 2022.

For a more in-depth review and analysis of the economy, please see our mini-book on economic analysis and forecasting entitled: Simple and Effective Economic Forecasting.

NABE October Business Conditions Survey

“The October NABE Business Conditions Survey shows that firms are continuing to gain ground since the sharp economic downturn experienced in the first half of the year,” said NABE President Manuel Balmaseda, CBE, chief economist, CEMEX. “This momentum is expected to continue through the rest of 2020. In addition, more respondents than in the July survey anticipate stronger growth in inflation-adjusted gross domestic product over the next year.”  “More respondents in this survey report continued improvements, especially in sales and profit margins, at their firms during the past three months than in the July survey,” added NABE Business Conditions Survey Chair Holly Wade, executive director, NFIB Research Center. “Capital spending is also picking up steam, with more firms investing in their businesses over the past three months, and more planning to do the same in the next three months. “The employment picture is less rosy, with many firms still holding back on wage and staff increases,” continued Wade. “While slightly more respondents report an increase in employment at their firms over the last three months than in the previous survey, more also report a decrease in employment. Most firms are also forgoing raises to control costs with 70% of respondents’ firms reporting unchanged wages and salaries over the last two quarters, the highest reading since January 2014.”

Higlights

• The panel’s consensus outlook for the U.S. economy, measured by year-over-year growth in inflation-adjusted gross domestic product (real GDP), continued to improve in October compared to that in the two previous surveys. Eighty-nine percent of panelists expect real GDP to increase from the third quarter (Q3) of 2020 to Q3 2021. Only 9% of respondents expect the real GDP change to be zero or negative, compared to 31% of respondents who held this view in the July survey when asked about the outlook for the 12 months ending Q2 2021.

• For the first time since April 2019, a majority of respondents’ firms reports increased sales at their firms, with 52% indicating rising sales during Q3. The Net Rising Index (NRI) for sales—the percentage of panelists reporting rising sales minus the percentage reporting falling sales—surged upward, increasing 47 points to 33, up from -14 in July. The forward-looking NRI for anticipated sales over the next three months also rose, adding to the sharp increase reported in the July survey. The NRI for anticipated sales increased 13 points, from 18 in July to 31, with positive readings in three of the four industry sectors.

• Profit-margin increases were more widespread in Q3 2020, but remained less prevalent than decreases among respondents’ firms, with the NRI for profit margins increasing 21 points to -4. The share of respondents reporting rising profit margins increased from 15% in July to 21% in October, while the percentage reporting falling margins declined 15 percentage points—from 40% in July to 25% in October.

• The NRI for prices charged returned to neutral in October—registering +1—following the sharp decline during the first half of 2020, that brought the NRI in July to its lowest level since 1987. NRIs by sector, however, vary significantly. The NRI for goods-producing firms is 21, after registering -40 in July. But the index for finance, insurance, real estate (FIRE) sector firms remains negative with an NRI of -19. Between these extremes are the NRI for services, with a reading of 3, and the NRI of 8 for the transportation, utilities, information, communications (TUIC) sector. The share of respondents expecting price increases in the next three months rebounded from levels in the previous two surveys to 26% in October, resulting in an NRI of 20. Six percent anticipate falling prices in the next three months.

• The NRI for materials costs also rebounded from two quarters of negative readings to a reading of 10. All sectors registered positive NRIs, led by goods-producers at 15, bouncing back from -56 in July. The NRI for expected costs rose modestly, from 1 to 8, having been as low as -21 in April.

• Hiring at respondents’ firms remains depressed. The third-quarter NRI for employment levels over the last three months is -17, compared to -19 in the July survey. Even as the NRI improved, the share of respondents indicating there was decline in employment at their firms rose to 27% from 24% in the July survey. At the same time, 9% report employment increases at their firms, compared to 5% in July. The outlook for employment deteriorated in Q3, as the NRI for hiring expectations declined to just 1, down from 6 in the July survey. Respondents from the goods-producing and TUIC sectors expect their firms will add jobs in the next three months. In the July survey, three of the four sectors had positive NRIs for expected employment change in Q3 2020.

• The NRI for wages and salaries rebounded 13 points to 4 in the October survey. The upward movement in the index reflects an increase to 17% from 11% in July in the share of respondents citing rising wages, and a decrease to 13% from 19% in the share reporting falling wages. The forward-looking NRI for wages and salaries moved from 0 in July to 15 in October.

• Almost two-thirds of respondents report no shortages of inputs in Q3 2020, similar to results from the July survey. The share of respondents reporting shortages is virtually unchanged in the current survey across all inputs, except for a decline in the percentage indicating intermediate input shortages.

• The NRI for capital spending improved, from -19 in July to -8 in October. Fewer respondents report continuing declines in spending, while more indicate their firms’ capital spending increased during Q3 2020. However, service-sector panelists report not much improvement from the prior two readings. The forward-looking NRI for capital spending rose considerably, from -40 in April to 6 in October, as fewer respondents expect declines in spending over the next 3 months.

• In response to COVID-19, businesses continue to adjust employee headcount and wages. Imposing a hiring freeze is the most common response, cited by 69% of respondents.

• Respondents’ near-term outlook improved slightly in October compared to that in the July survey. Thirty-six percent of respondents report a “Better” near-term in October, compared to 34% in July. Only 8% indicate their near-term outlook is “Worse” in October, compared to 12% in July.

• Twenty-three percent of respondents report that sales at their companies are at “more than 100% of pre-crisis level,” an increase from the 15% in the July survey.

• Thirty-one percent of respondents expect sales to return to normal “sometime in 2021,” while 24% do not expect sales to return to normal until sometime in 2022. Only 10% expect sales to return to normal by the end of 2020.

• Only 3% of respondents report that their firms applied, or are planning to apply, for Main Street Lending programs.

• Thirty-five percent of respondents indicate their firms have implemented new work-at-home policies, allowing “all employees” to work from home during the pandemic. Another 33% allow “most employees” to work from home, while 16% only allow “some employees” to work from home.

• Thirty-one percent of respondents report that their firms will wait for “progress regarding COVID-19” before changing their work-from-home policies. Twenty-two percent indicate their companies will wait until the second half of 2021, while 16% of firms plan to suspend work-from-home policies in the first half of 2021.

Stock Market Valuations

Our estimates of the market valuations for two stock market indices, the Dow Jones Industrial Average (DJIA) and the Standard & Poor’s 500 (S&P 500), can be found in the file below:

Conclusion

During this time of global flux due to the coronavirus, I am leaving the Conclusion discussion below the same as was posted on March 23, 2020. The March 23, 2020 discussion still adequately reflects my thinking on the current state of affairs.

Important Note: While I don’t believe it is time to jump back into the stock market in a big way because of the market’s overvaluation, I have been advising the last few of weeks in this Commentary and in my weekly podcast, Intrinsic Value Wealth Report Radio, that investors can continue building their investment portfolios by selecting individual securities that offer growth and value opportunities.

Reprinted from March 23, 2020

Up until the past week, the economy had been in a stable but somewhat vulnerable state. Nonetheless, it had remained fairly strong. In fact, robust consumer spending and strong labor market conditions had given us confidence that the economy, which had been in its tenth year of expansion, could continue to grow. But we were cautious on this outlook. There were several reasons for our caution. U.S. business growth had been mixed. And global economic growth had been mixed as well. The new coronavirus was becoming a global economic threat, although it was still too early to tell how much of an effect it would ultimately have. Debt is at high levels for consumers, businesses, and government (at all levels of government). Finally, this is an election year that will likely have significant consequences either positively or negatively depending on the outcome of the elections. And of course, it is still too early to tell what the outcome of the elections will be.

In just a few days, the coronavirus’s effect on the economy and the markets went from a ripple to a tsunami. Businesses are shuttering, events are being cancelled or postponed, grocery store shelves are empty, and people are being asked or ordered to stay home. The markets are now deep in bear market territory. The effects on the economy, even given the short time that the economy has been retreating, may be with us for a long time. There is now a much greater risk of a recession, and there has even been some talk of a depression. The government, the Fed, Republicans, and Democrats, and pretty much the entire country, is trying to get the virus under control and is coming up with plans to mitigate the long-term economic effects caused by the virus. But the virus has impacted the economy – in a significant way – in just a short time. How long lasting the effects will be no one can tell right now. The economy has been largely shut down and remains so today. It takes time to restart the economy after a situation such as what is occurring at the present time.

Given these events and the rapidly deteriorating situation, as I said last week, I would caution not to panic. The economy and the markets will get better. The situation is bad – there is no doubt about that – but it will turn around. The real question is when will it turn around? No one knows that at the present time. But it will turn around.

For now, review your investment portfolios. It is highly likely that all or most of your stocks are down. You should not consider selling the bulk of your stocks – only consider selling companies that are not sound companies. But do recognize that as the economy deteriorates, even good companies will be affected.

For stock market value hunters, we believe it is still too early to jump back in. We will be closely monitoring the markets using the many tools and models that we have developed over the years to assess the economy and the markets. We will use our best judgement and thoughts to let you know when we believe things are turning around. The turnaround hasn’t happened yet.

We believe it is important to maintain a long-term view toward investing. But for now, just sit tight. Eventually, this means that you should continue building your investment portfolio using the Cassandra Stock Selection Model to select individual securities that offer growth and value opportunities.

Chart for Review and Thought

The Classrooms Are Still Empty – But Not For Long!

Simple and Effective Economic Forecasting Model

Note: The table and chart below have not been updated. However, we believe that a recession is quite likely. In the chart below, the bottom green line shows what a recession could look like.

Notes (GDP Growth Chart):

  1. See the July 8, 2019 Commentary for an introduction to this model.
  2. Actual numbers 2007 through 2019; forecasted numbers thereafter.
  3. Normal GDP growth is typically in the 2% to 3% range.
  4. A recession is generally defined as two consecutive quarters of negative economic growth as measured by a country’s gross domestic product (GDP).

Thought for the Week

“You have to be odd to be number one!” ~ Anonymous

Announcements

The Intrinsic Value Wealth Report has started a new YouTube channel called Intrinsic Value Wealth Report TV. You can view the YouTube channel at Intrinsic Value Wealth Report TV.

The Intrinsic Value Wealth Report has started a new podcast called Intrinsic Value Wealth Report Radio. You can listen to the podcast at Intrinsic Value Wealth Report Radio.

Dr. Wendee spoke at the Investment Club of America’s annual economic summit, called Econosummit, on Sunday March 1, 2020 in Las Vegas.

Dr. Wendee attended the The National Due Diligence Alliance (TNDDA) investment banking conference, which was held March 6-8, 2020 at the Four Seasons Resort in Dallas, Texas. This is a conference held several times throughout the year for investment bankers and registered investment advisers to learn about new opportunities in the Alternative Investment asset classes.

TNDDA Meeting in Dallas, Texas

We have been researching the use of crowdsourcing for investment ideas. We will be sending a survey out in the next few weeks to get your input on the economy and the markets; and to get any investment ideas that you would like to share. We will compile this input and distribute the results to you and our other subscribers. We have been testing our crowdsourcing models with students and have been having good success and results.

Dr. Wendee has been researching and writing a new theory of economics known as, The Value Creation Theory of the Economy (also known as, Intrinsinomics). The full paper on Intrinsinomics will be published in the near future.

Finance 3350: Personal Finance-Portfolio & Risk Management– Dr. Wendee taught teaching Finance 3350 – Portfolio & Risk Management at California State University, Los Angeles (CSULA) for the Summer term starting May 2020. Dr. Wendee teaches courses in Management and Finance at CSULA.

Business 548: Strategy and Decision Making – Dr. Wendee taught Business 548 – Strategy and Decision Making at California Baptist University (CBU) starting at the end of June 2020. Dr. Wendee teaches courses in Finance, Business, Strategy & Decision Making, and Economics at CBU.

Business 303: Business Finance – Dr. Wendee taught Business 303 – Business Finance at California Baptist University (CBU) starting at the end of August 2020. Dr. Wendee teaches courses in Finance, Business, Strategy & Decision Making, and Economics at CBU.

Business 539: Financial Management – Dr. Wendee is teaching Business 539 – Financial Management at California Baptist University (CBU) which started at the end of October. Dr. Wendee teaches courses in Finance, Business, Strategy & Decision Making, and Economics at CBU.

Business 217: Microeconomics – Dr. Wendee is teaching Business 217 – Microeconomics at California Baptist University (CBU) which started in January 2021. Dr. Wendee teaches courses in Finance, Business, Strategy & Decision Making, and Economics at CBU.

Business 218: Macroeconomics – Dr. Wendee is teaching Business 218 – Macroeconomics at California Baptist University (CBU) which started in January 2021. Dr. Wendee teaches courses in Finance, Business, Strategy & Decision Making, and Economics at CBU.

Finance 430: Risk Management – Dr. Wendee is teaching Finance 430 – Risk Management at California Baptist University (CBU) which started in January 2021. Dr. Wendee teaches courses in Finance, Business, Strategy & Decision Making, and Economics at CBU.

Dr. Wendee presented a paper on his new theory of economics known as, The Value Creation Theory of the Economy (also known as, Intrinsinomics), at the International Leadership Association’s annual global conference which was held in Ottawa, Canada last Fall.

Dr. Wendee presented an updated paper on his new theory of economics known as, The Value Creation Theory of the Economy (also known as, Intrinsinomics), at the International Leadership Association’s annual global conference which was to have been held in San Francisco, California in November, but which was held virtually instead due to the Coronavirus.

Dr. Wendee delivered a talk entitled: Using Alternative Assets to Increase Portfolio Returns and Decrease Risk at the BrightTalk Q4 2020 Outlook Summit on October 28, 2020. You can access additional information on the summit and Dr. Wendee’s presentation here.

Dr. Wendee delivered a talk  at the BrightTalk conference on December 9, 2020 entitled: Emerging Themes and Great Places to Invest for 2021. You can access additional information on the summit and Dr. Wendee’s presentation here.

Dr. Wendee delivered a talk  at the BrightTalk conference on January 20, 2021 entitled: Developing an Income-Producing Strategy for 2021 and Beyond. You can access additional information on the summit and Dr. Wendee’s presentation here.

Dr. Wendee is working on a financial planning modeling program which will be available in the near future. The modeling program is designed to assist anyone in creating a financial plan and is customizable for each person’s unique financial planning goals. A working draft of the model is currently in beta test with students. Click this link, schematic, to go to the clickable document under the subheading Financial Planning Process (Draft) in the Intrinsic Value Wealth Report to see a draft of the schematic for the new financial planning process.

Dr. Wendee has been developing an econometric model specifically designed to monitor and forecast the global economy as this current economic crisis unfolds. This new econometric model is based on other econometric models that he has designed and have used for many years. You can find some of these earlier models in Book # 6 – Simple and Effective Economic Forecasting in the sister website to this website which is called the Intrinsic Value Wealth Report. The new econometric model has been constructed with some additional tools and methods that he has learned and some that he has developed over the last several years. He will be talking more about this new econometric model in this Commentary over the next few months. His comments and forecasts on the economy and the markets going forward will be based to a significant extent on this new model.

We have begun raising capital for our fund-of-funds investment, Northwest Quadrant Opportunity Fund, LLC. The fund engineers and constructs an investment vehicle consisting of Alternative Asset investments. The fund’s objective is to build a diversified portfolio of strong, solid, steady- performing assets, with highly qualified asset managers who have proven track records that meet our underwriting requirements. To learn more about the Northwest Quadrant Opportunity Fund, LLC and to obtain an offering memorandum, please click Northwest Quadrant Opportunity Fund, LLC.

Intrinsic Value Wealth Creation pyramid

We always conclude our commentary with a discussion of the Intrinsic Value Wealth Creation Pyramid. The Intrinsic Value Wealth Creation Pyramid is designed to show some of the major categories for building wealth. It is the result of many years of study of the wealth building process; experience working with clients who have built considerable wealth; and my own personal experience building wealth. Newsletter subscribers should consult the Intrinsic Value Wealth Creation Pyramid as one of many useful investment tools while considering their investment plans.

The chart in this section is an expanded version of the Intrinsic Value Wealth Creation Pyramid Chart referenced in the Forbes.com article entitled, Nine of the Best Ways to Build Wealth.
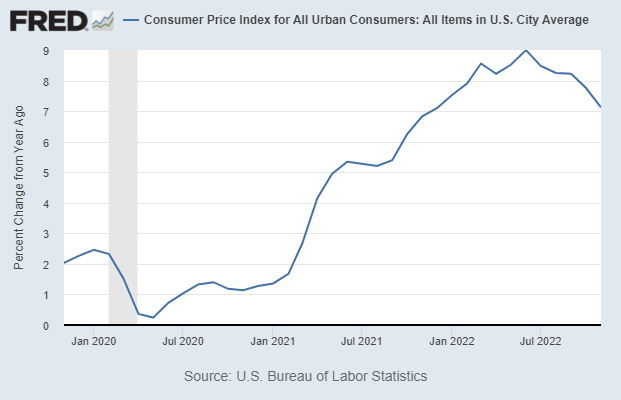
RESOURCES

See our Resources section for links to economic and other resources used in the preparation of this Commentary.

Posted in Economic & Business Chart Room, Economic Outlook, Entrepreneurship, Focus List, Investment Recommendations, Investments, Notes From The Field, Special Situations, Uncategorized, VDI/REEP, Visionary Ideas | Tagged , , , , , , , , , , , , , , , , , , , , , , , , , , , , , , , , , | Comments Off on WEEKLY COMMENTARY February 16, 2021

WEEKLY COMMENTARY February 9, 2021

Funds Debunked!

Yesterday, I had the great pleasure to be a guest on the podcast show, the Opportunity Zone Show, co-hosted by Dan Summers and Chris Magda. Dan and Chris interviewed me about fund offerings in general, and funds-of-funds in particular. You can listen to this show at Funds Debunked. Here are a few of the highlights we talked about in the podcast.

• There are two basic kinds of funds – (1) funds of assets; and (2) funds of managers (funds-of-funds).

• Investors invest in funds-of-funds for some of the following benefits

  • Diversification
  • Low correlation
  • Expertise of the fund-of-fund manager in selecting the target fund asset managers

• A person considering becoming a fund manager should consider progressing toward a fund-of-funds approach in this order:

  • Become an expert in an asset class
  • Start a fund in the asset class in which one has become an expert
  • Start a fund-of-funds after acquiring an expertise, track record, and investor following

• New fund/asset managers should start with specified properties, instead of a blind pool, to establish a track record and gain expertise

• Due diligence is critically important for any investment in a single or multiple asset(s), funds, or funds-of-funds

• Alternative assets have become increasingly important over the past few years as investment targets, but require a great deal of expertise and experience in order to effectively invest in this general asset class

• It was discussed where to find asset managers, funds, and fund-of-funds

• It important to have a good investment platform such as the eVest platform. Northwest Quadrant Opportunity Fund, LLC, our alternative asset investment fund, uses the eVest platform.

• Northwest Quadrant Opportunity Fund, LLC’s Double Alpha Strategy for increasing returns while reducing portfolio risk was discussed

Please listen to the podcast for more details on these highlights. Please also see the Northwest Quadrant Opportunity Fund, LLC alternative asset fund that our firm advises.

Economic and Investment Highlights

Last Week

Online trading pushed silver prices to new highs, settling at $28.77. Online trading is also powering the swings in SPACS.

Timetables to vaccinate everyone are slipping in many countries, sparking fears that the economic effects of the pandemic will continue into 2022 or beyond.

Robinhood raised a total of $3.4 billion in just a few days.

Jeff Bezos is stepping down as Amazon’s CEO to become its executive chairman. Amazon ended 2020 with record quarterly sales.

GameStop and AMC suffered sharp reversals as exchange operator CME Group Inc. raised margin requirements on silver futures.

Giant oil companies warned of a slow recovery in their industry.

U.S. unemployment fell to 6.3% from 6.7% in December, in part due to fewer people looking for work. Much of the recent employment reports suggest a long road to recovery.

The Dow, the S&P 500, and the Nasdaq all rose for the week. The Dow was up 3.9%; the S&P 500 was up 4.65%; and the Nasdaq was up 6.0%. The 10-year treasury yield ended the week at 1.168%. Gold closed at $1,810.90 for the week. Oil closed at $56.85 for the week.

The Week Ahead

This link takes you to Econoday’s Economic Calendar and Economic Events and Analysis which shows the upcoming economic reporting events scheduled in the week and months ahead.

Summary

Note: The models below may not capture the impact of COVID-19 beyond their impact on GDP source data and relevant economic reports that have already been released. They may not anticipate the impact of COVID-19 on forthcoming economic reports beyond the standard internal dynamics of the models.

Note: The comments that follow are derived from the economic indicators referenced in the Resources section of this newsletter and other sources in this report.

The Aruoba-Diebold-Scotti Business Conditions Index (ALS) had been trending up for several weeks from having dipped in 2019. Recently with the advent of the economic collapse, the index crashed. It has now been generally trending down again, but fluctuating within a narrow band. This is a slightly positive indicator for the economy on a short-term basis.

The GDPNow model estimate for real GDP growth (seasonally adjusted annual rate) in the fourth quarter of 2020 is 7.4 percent. This reading agrees with the ALS model assessment of an improving short-term economic environment.

The New York Fed Staff Nowcast stands at 6.48 percent for 2021:Q1.

The Chicago Fed National Activity Index (CFNAI) showed an increase in economic activity in October. The Chicago Fed National Activity Index (CFNAI) was +0.52 in December, up from +0.31 in November.

All told, these short-term economic indicators are a mixed analysis for the economy, at least on a short-term basis.

Expectations that stock prices will rise over the next six months is now at 37.7% in a recent AAII Sentiment Survey. The historical average is 38.0% for the survey. 24.0% of the investors in the survey described their short-term outlook as neutral and 38.3% were bearish. Please see the AAII Sentiment Survey for the complete results.

The latest Gross Output (GO) reading (December 22, 2020) showed that Gross Output rose significantly in the 3rd quarter 2020.

Advisor Perspectives publishes a monthly market valuation update.

Advisor Perspectives has market valuation and other useful and interesting investment information at this website.

Fourth Quarter 2020 Survey of Professional Forecasters

[Release Date: November 16, 2020] The outlook for real GDP growth in the next few quarters looks weaker now than it did three months ago, according to 37 forecasters surveyed by the Federal Reserve Bank of Philadelphia. The forecasters predict the economy will expand at an annual rate of 4.0 percent this quarter, lower than the prediction of 5.8 percent from the previous survey. On an annual-average over annual-average basis, the forecasters expect real GDP to decrease 3.5 percent this year but to recover and grow at an annual rate of between 2.1 percent to 4.0 percent over each of the following three years.

A downward revision to the projection for the unemployment rate accompanies the outlook for growth. The forecasters predict unemployment will decrease from a projected 7.0 percent this quarter to 5.8 percent in the fourth quarter of 2021. The prediction for the current-quarter unemployment rate is 2.5 percentage points lower than that of the last survey. On an annual-average basis, the panelists predict the unemployment rate will decline from a projected 8.2 percent in 2020 to 4.6 percent in 2023.

On the employment front, the forecasters expect job gains in the current quarter at a rate of 689,800 per month. The employment projections for the current and the following three quarters show upward revisions from those of the previous survey. The projections for the annual-average level of nonfarm payroll employment suggest job losses at a monthly rate of 718,000 in 2020 and job gains at a monthly rate of 321,600 in 2021. (These annual-average estimates are computed as the year-to-year change in the annual-average level of nonfarm payroll employment, converted to a monthly rate.) 

The next survey will be released on February 12, 2021

NABE Surveys

NABE Business Conditions Survey – January 2021

COMMENTS: “Results of the January NABE Business Conditions Survey show that conditions continued to improve during the last quarter of 2020 after the collapse experienced during the first half of last year,” said NABE President Manuel Balmaseda, CBE, chief economist, CEMEX. “Momentum has continued to build, and survey respondents seem much more positive about the future today than in October. Furthermore, expectations regarding GDP growth continue to improve, with 69% of respondents expecting growth in inflation-adjusted gross domestic product over the next year of 3.0% or higher, compared to just 59% in the October survey.” 

HIGHLIGHTS

• Respondents’ views continue to coalesce around an expansionary outlook for growth in inflation-adjusted gross domestic product (real GDP), with 69% of panelists expecting GDP to expand by 3.0% or more. Just 2% of respondents anticipate negative growth over the year ahead (ending in Q4 2021). This compares favorably with results of the July 2020 survey in which nearly 40% of respondents anticipated shrinking output growth over the four quarters ending in Q2 2021, as well as with results in the October 2020 survey in which roughly 10% viewed negative growth as most likely.

• Just over half (51%) of respondents report that sales at their firms increased in Q4 2020, nearly matching the 52% in the October survey who reported an increase in Q3. The share that reports a decrease in sales declined from 20% in October to 13% in the January survey. As a result, the Net Rising Index (NRI) for sales—the percentage of panelists reporting rising sales minus the percentage reporting falling sales—climbed to a two-year high of 38, up from 33 in October and -14 in July. The forward-looking NRI for anticipated sales over the next three months continues to rise, from 31 in October to 38—the highest reading since the April 2019 survey.

• Profit margins reversed course in Q4, with more respondents reporting profits rising than falling. The NRI for profit margins increased 18 points to 14 from -4 in October. The share of respondents reporting rising profit margins increased from 21% in October to 30% in January, while the percentage reporting falling margins declined 9 percentage points— from 25% in October to 16% in January. Of the survey’s four sectors, the goods-producing sector experienced the largest jump in the NRI for profit margins, a 56-point swing from -18 in October to 38 in January.

• The NRI for prices charged is 15, having surged 14 points from October. NRIs by sector, however, vary significantly. The January NRI for goods-producing firms is 71, after registering 21 in October. The index for finance, insurance, and real estate (FIRE) sector firms remains negative at -12, up from -19 in October. Between these extremes are the NRI for service sector firms, with a reading of 8, up from 3 in October, and the NRI of 25 for the transportation, utilities, information, communications (TUIC) sector. The share of respondents expecting price increases in the next three months continues to rise—35% in January compared to 26% in October—resulting in an NRI of 30. Five percent of panelists anticipate falling prices in the next three months.

• The NRI for materials costs accelerated to an NRI of 28, the highest reading since April 2019. All sectors registered positive NRIs, led by goods-producers at 62. The NRI for expected costs rose significantly, from 8 to 34, after having been as low as -21 in April 2020.

• The NRI for wages and salaries rebounded to 19 in the January survey, a clear continuation in the recovery from the depths of the COVID-19 slump during 2020. The upward movement in the index resulted from an increase in the share of respondents citing rising wages—to 28% from 17% in October—and a decrease to 9% from 13% in the share reporting falling wages.

• The NRI for employment rose to 7—the highest reading since October 2019, and the first positive value since April 2020. The share of respondents citing decreased hiring activity fell from 27% to 13%, while 19% report employment increased at their firms compared to 9% in the October survey. All sectors have positive NRIs. The NRI for the services sector rose from -5 in October to 6. The largest increase is in the goods-producing sector, up 54 points to 8 in January. Respondents remain optimistic regarding the near-term outlook for employment, as the forward-looking NRI rose to 21 from 1 in the October survey. Respondents from all sectors expect their firms will add jobs rather than reduce headcount in the near term.

• Fifty-six percent of respondents report there were no shortages of inputs in Q4 2020—slightly smaller than the percentage in the October survey. The largest increase is in the share of respondents reporting shortages in skilled labor—up from 16% in October to 24%. The share reporting shortages of unskilled labor increased from 2% to 7%.

• After negative readings for three straight quarters, the NRI for capital spending bounced back strongly in the fourth quarter, rising from -8 to 15—the highest reading in one year. Twenty-eight percent of respondents report that capital spending at their firms rose during Q4, up from 19% in Q3, with the percentage citing declining investments shrinking from 27% to 13%. Six-in-ten note no change in capital expenditures over the past three months. The forwardlooking NRI for capital spending is strongly positive, rising from 6 in October to 22 in January. The percentage of respondents expecting increased activity jumped from 19% to 34%.

• Businesses continue to make changes to employment and wages in response to COVID-19, albeit less so than in the October survey. Reducing employee headcount was the most common response, cited by 34% of respondents. But this is down from 54% in October and 68% in July.

• Respondents’ near-term outlook is little changed compared to that in the October survey. Thirty-four percent of respondents report a “Better” outlook compared to a month ago, down slightly from 36% in October. Only 6% cite a “Worse” near-term outlook, compared to 8% in the previous survey.

• Sales volumes improved in the fourth quarter of 2020. Fifty-two percent of respondents report sales volumes at “76-100% of pre-crisis level,” up from 46% in the previous survey. Furthermore, 23% indicate that sales at their companies are already above pre-crisis levels, matching the October reading, and led by the TUIC and goods-producing sectors.

• Nearly one-third (32%) of respondents reports that sales volumes have already returned to their normal level of operations, while 36% expect that to happen sometime in 2021.

• Only 5% of respondents report that their firms have either applied or are planning to apply for Main Street Lending programs, up slightly from 3% in the October survey.

• Roughly half (51%) of respondents anticipates that their firms will suspend their stay-at-home policies in the second half of 2021, up from 22% in the October survey.

• Eleven percent of panelists expect that all of the staff at their firms will eventually return to pre-pandemic working arrangements. Those from the services sector account for the largest share holding this view.

• Nearly half of respondents (46%) indicates that the vaccine rollout or new administration will have “No” impact on their firm’s outlook for sales, hiring, capex, etc. Conversely, 37% of respondents indicate “Yes, positive,” while 5% cite “Yes, negative.”

NABE Outlook Survey – December 2020

SUMMARY: “The NABE [National Association for Business Economics] Outlook panel anticipates more moderate growth in economic activity going forward after the sharp rebound during the third quarter,” said NABE President Manuel Balmaseda, CBE, chief economist, CEMEX. “The median forecast calls for a 4.1% annualized growth rate in the fourth quarter of 2020 for inflation-adjusted gross domestic product, or real GDP. In addition to the 33.1% GDP growth in the third quarter of the year, this would reverse much of the 32% annualized decline from the second quarter. However, the panel has become slightly less bullish about 2021. The median real GDP growth estimate for 2021 is 3.4%, slightly less than the 3.6% forecasted in the October survey.” “NABE panelists have become more optimistic, on balance, with nearly one-third revising their outlook higher based on recent news of effective vaccines,” added Survey Chair Holly Wade, executive director, NFIB Research Center. “Seventy-three percent of panelists believe that the economy will have returned to pre-pandemic GDP levels by the second half of 2021, 18% expect it to reach that level in the first half of 2022, and 10% believe it will occur in the second half of 2022 or later. The 73% is a dramatic improvement from the October survey in which 38% of panelists believed that a full recovery would occur before 2022. “Just over one-third of respondents anticipate more downside risk to economic growth in 2021,” continued Wade. “Panelists point to a second wave of COVID-19 cases as their main concern.”

The National Association for Business Economics (NABE) released its October Outlook Survey which is summarized as follows: “The NABE Outlook panel sees a strong rebound in economic activity after the collapse experienced during the second quarter,” said NABE Vice President Manuel Balmaseda, CBE, chief economist, CEMEX. “The median forecast calls for a 25% annualized growth rate in the third quarter of 2020 for inflation-adjusted gross domestic product, or real GDP. That would reverse much of the 31% annualized decline from the second quarter. However, the panel has become less bullish about the fourth quarter of 2020, as well as 2021. The median real GDP growth estimate for 2021 is 3.6%, compared to a 4.8% forecast in the June survey.”

“NABE panelists have become more optimistic, on balance, but remain concerned about a potential second wave of COVID-19,” added Outlook Survey Chair Eugenio Aleman, economist, Wells Fargo Bank. “Thirty-eight percent of panelists believe that the economy will have returned to pre-pandemic GDP levels by the second half of 2021, 32% expect it to reach that level in the first half of 2022, and 30% believe it will occur in the second half of 2022 or later.

“About half of the panelists put the odds of a double-dip recession at 20% or less,” continued Aleman. “In contrast, one out of eight panelists places those odds at 50% or higher.”

Other highlights from the survey:

The median forecast calls for the unemployment rate to average 8.4% in 2020, 2.5 percentage points lower than the median forecast in the previous survey. Panelists expect the unemployment rate to decline each quarter, averaging 6.8% in 2021, compared with the 8% previously forecasted. The unemployment rate averaged 3.7% in 2019.

Panelists look for business investment to drop sharply this year. Real nonresidential fixed investment is forecasted to decline 6%. Panelists anticipate real nonresidential fixed investment to rise only gradually in 2021, increasing 2.4%.

Survey respondents expect inflation—as measured by the GDP price index—to be significantly lower in 2020 and 2021 relative to 2019. Inflation is forecasted to be 1.0% in 2020 and 1.5% in 2021. The index increased 1.8% in 2019.

Panelists expect the consumer price index (CPI) to rise 1.2% in 2020, significantly lower than the actual 1.8% growth in consumer prices in 2019. The 2020 forecast median has increased since the June survey, when panelists saw CPI rising by 0.7%. The panel anticipates consumer price growth will pick up moving forward, with a 1.9% annual average gain in 2021.

Panelists expect corporate profits to contract by 11% in 2020. The median forecast calls for profits to increase by 8.5% in 2021.

Four out of ten panelists indicate that 5% of jobs will be permanently lost due to firms closing. More than half of the panel suggest between 10% and 20% of job losses will be permanent.

Thirty-eight percent of panelists believe that the economy will have returned to pre-pandemic GDP levels by the second half of 2021; only 2% suggest this will occur before the end of 2020, 12% believe GDP will recover in the first half of 2021, and 24% anticipate such a return in the second half of 2021. Thirty-two percent of respondents expect GDP to reach pre-pandemic levels in the first half of 2022, and 22% believe it will occur in the second half of 2022.

For a more in-depth review and analysis of the economy, please see our mini-book on economic analysis and forecasting entitled: Simple and Effective Economic Forecasting.

NABE October Business Conditions Survey

“The October NABE Business Conditions Survey shows that firms are continuing to gain ground since the sharp economic downturn experienced in the first half of the year,” said NABE President Manuel Balmaseda, CBE, chief economist, CEMEX. “This momentum is expected to continue through the rest of 2020. In addition, more respondents than in the July survey anticipate stronger growth in inflation-adjusted gross domestic product over the next year.”  “More respondents in this survey report continued improvements, especially in sales and profit margins, at their firms during the past three months than in the July survey,” added NABE Business Conditions Survey Chair Holly Wade, executive director, NFIB Research Center. “Capital spending is also picking up steam, with more firms investing in their businesses over the past three months, and more planning to do the same in the next three months. “The employment picture is less rosy, with many firms still holding back on wage and staff increases,” continued Wade. “While slightly more respondents report an increase in employment at their firms over the last three months than in the previous survey, more also report a decrease in employment. Most firms are also forgoing raises to control costs with 70% of respondents’ firms reporting unchanged wages and salaries over the last two quarters, the highest reading since January 2014.”

Higlights

• The panel’s consensus outlook for the U.S. economy, measured by year-over-year growth in inflation-adjusted gross domestic product (real GDP), continued to improve in October compared to that in the two previous surveys. Eighty-nine percent of panelists expect real GDP to increase from the third quarter (Q3) of 2020 to Q3 2021. Only 9% of respondents expect the real GDP change to be zero or negative, compared to 31% of respondents who held this view in the July survey when asked about the outlook for the 12 months ending Q2 2021.

• For the first time since April 2019, a majority of respondents’ firms reports increased sales at their firms, with 52% indicating rising sales during Q3. The Net Rising Index (NRI) for sales—the percentage of panelists reporting rising sales minus the percentage reporting falling sales—surged upward, increasing 47 points to 33, up from -14 in July. The forward-looking NRI for anticipated sales over the next three months also rose, adding to the sharp increase reported in the July survey. The NRI for anticipated sales increased 13 points, from 18 in July to 31, with positive readings in three of the four industry sectors.

• Profit-margin increases were more widespread in Q3 2020, but remained less prevalent than decreases among respondents’ firms, with the NRI for profit margins increasing 21 points to -4. The share of respondents reporting rising profit margins increased from 15% in July to 21% in October, while the percentage reporting falling margins declined 15 percentage points—from 40% in July to 25% in October.

• The NRI for prices charged returned to neutral in October—registering +1—following the sharp decline during the first half of 2020, that brought the NRI in July to its lowest level since 1987. NRIs by sector, however, vary significantly. The NRI for goods-producing firms is 21, after registering -40 in July. But the index for finance, insurance, real estate (FIRE) sector firms remains negative with an NRI of -19. Between these extremes are the NRI for services, with a reading of 3, and the NRI of 8 for the transportation, utilities, information, communications (TUIC) sector. The share of respondents expecting price increases in the next three months rebounded from levels in the previous two surveys to 26% in October, resulting in an NRI of 20. Six percent anticipate falling prices in the next three months.

• The NRI for materials costs also rebounded from two quarters of negative readings to a reading of 10. All sectors registered positive NRIs, led by goods-producers at 15, bouncing back from -56 in July. The NRI for expected costs rose modestly, from 1 to 8, having been as low as -21 in April.

• Hiring at respondents’ firms remains depressed. The third-quarter NRI for employment levels over the last three months is -17, compared to -19 in the July survey. Even as the NRI improved, the share of respondents indicating there was decline in employment at their firms rose to 27% from 24% in the July survey. At the same time, 9% report employment increases at their firms, compared to 5% in July. The outlook for employment deteriorated in Q3, as the NRI for hiring expectations declined to just 1, down from 6 in the July survey. Respondents from the goods-producing and TUIC sectors expect their firms will add jobs in the next three months. In the July survey, three of the four sectors had positive NRIs for expected employment change in Q3 2020.

• The NRI for wages and salaries rebounded 13 points to 4 in the October survey. The upward movement in the index reflects an increase to 17% from 11% in July in the share of respondents citing rising wages, and a decrease to 13% from 19% in the share reporting falling wages. The forward-looking NRI for wages and salaries moved from 0 in July to 15 in October.

• Almost two-thirds of respondents report no shortages of inputs in Q3 2020, similar to results from the July survey. The share of respondents reporting shortages is virtually unchanged in the current survey across all inputs, except for a decline in the percentage indicating intermediate input shortages.

• The NRI for capital spending improved, from -19 in July to -8 in October. Fewer respondents report continuing declines in spending, while more indicate their firms’ capital spending increased during Q3 2020. However, service-sector panelists report not much improvement from the prior two readings. The forward-looking NRI for capital spending rose considerably, from -40 in April to 6 in October, as fewer respondents expect declines in spending over the next 3 months.

• In response to COVID-19, businesses continue to adjust employee headcount and wages. Imposing a hiring freeze is the most common response, cited by 69% of respondents.

• Respondents’ near-term outlook improved slightly in October compared to that in the July survey. Thirty-six percent of respondents report a “Better” near-term in October, compared to 34% in July. Only 8% indicate their near-term outlook is “Worse” in October, compared to 12% in July.

• Twenty-three percent of respondents report that sales at their companies are at “more than 100% of pre-crisis level,” an increase from the 15% in the July survey.

• Thirty-one percent of respondents expect sales to return to normal “sometime in 2021,” while 24% do not expect sales to return to normal until sometime in 2022. Only 10% expect sales to return to normal by the end of 2020.

• Only 3% of respondents report that their firms applied, or are planning to apply, for Main Street Lending programs.

• Thirty-five percent of respondents indicate their firms have implemented new work-at-home policies, allowing “all employees” to work from home during the pandemic. Another 33% allow “most employees” to work from home, while 16% only allow “some employees” to work from home.

• Thirty-one percent of respondents report that their firms will wait for “progress regarding COVID-19” before changing their work-from-home policies. Twenty-two percent indicate their companies will wait until the second half of 2021, while 16% of firms plan to suspend work-from-home policies in the first half of 2021.

Stock Market Valuations

Our estimates of the market valuations for two stock market indices, the Dow Jones Industrial Average (DJIA) and the Standard & Poor’s 500 (S&P 500), can be found in the file below:

Conclusion

During this time of global flux due to the coronavirus, I am leaving the Conclusion discussion below the same as was posted on March 23, 2020. The March 23, 2020 discussion still adequately reflects my thinking on the current state of affairs.

Important Note: While I don’t believe it is time to jump back into the stock market in a big way because of the market’s overvaluation, I have been advising the last few of weeks in this Commentary and in my weekly podcast, Intrinsic Value Wealth Report Radio, that investors can continue building their investment portfolios by selecting individual securities that offer growth and value opportunities.

Reprinted from March 23, 2020

Up until the past week, the economy had been in a stable but somewhat vulnerable state. Nonetheless, it had remained fairly strong. In fact, robust consumer spending and strong labor market conditions had given us confidence that the economy, which had been in its tenth year of expansion, could continue to grow. But we were cautious on this outlook. There were several reasons for our caution. U.S. business growth had been mixed. And global economic growth had been mixed as well. The new coronavirus was becoming a global economic threat, although it was still too early to tell how much of an effect it would ultimately have. Debt is at high levels for consumers, businesses, and government (at all levels of government). Finally, this is an election year that will likely have significant consequences either positively or negatively depending on the outcome of the elections. And of course, it is still too early to tell what the outcome of the elections will be.

In just a few days, the coronavirus’s effect on the economy and the markets went from a ripple to a tsunami. Businesses are shuttering, events are being cancelled or postponed, grocery store shelves are empty, and people are being asked or ordered to stay home. The markets are now deep in bear market territory. The effects on the economy, even given the short time that the economy has been retreating, may be with us for a long time. There is now a much greater risk of a recession, and there has even been some talk of a depression. The government, the Fed, Republicans, and Democrats, and pretty much the entire country, is trying to get the virus under control and is coming up with plans to mitigate the long-term economic effects caused by the virus. But the virus has impacted the economy – in a significant way – in just a short time. How long lasting the effects will be no one can tell right now. The economy has been largely shut down and remains so today. It takes time to restart the economy after a situation such as what is occurring at the present time.

Given these events and the rapidly deteriorating situation, as I said last week, I would caution not to panic. The economy and the markets will get better. The situation is bad – there is no doubt about that – but it will turn around. The real question is when will it turn around? No one knows that at the present time. But it will turn around.

For now, review your investment portfolios. It is highly likely that all or most of your stocks are down. You should not consider selling the bulk of your stocks – only consider selling companies that are not sound companies. But do recognize that as the economy deteriorates, even good companies will be affected.

For stock market value hunters, we believe it is still too early to jump back in. We will be closely monitoring the markets using the many tools and models that we have developed over the years to assess the economy and the markets. We will use our best judgement and thoughts to let you know when we believe things are turning around. The turnaround hasn’t happened yet.

We believe it is important to maintain a long-term view toward investing. But for now, just sit tight. Eventually, this means that you should continue building your investment portfolio using the Cassandra Stock Selection Model to select individual securities that offer growth and value opportunities.

Chart for Review and Thought

Crude Oil Prices (WTI)

Simple and Effective Economic Forecasting Model

Note: The table and chart below have not been updated. However, we believe that a recession is quite likely. In the chart below, the bottom green line shows what a recession could look like.

Notes (GDP Growth Chart):

  1. See the July 8, 2019 Commentary for an introduction to this model.
  2. Actual numbers 2007 through 2019; forecasted numbers thereafter.
  3. Normal GDP growth is typically in the 2% to 3% range.
  4. A recession is generally defined as two consecutive quarters of negative economic growth as measured by a country’s gross domestic product (GDP).

Thought for the Week

“If you want to get anywhere in life, don’t break the rules – make the rules!” ~ Joseph C. Giarratano, Ph.D.

Announcements

The Intrinsic Value Wealth Report has started a new YouTube channel called Intrinsic Value Wealth Report TV. You can view the YouTube channel at Intrinsic Value Wealth Report TV.

The Intrinsic Value Wealth Report has started a new podcast called Intrinsic Value Wealth Report Radio. You can listen to the podcast at Intrinsic Value Wealth Report Radio.

Dr. Wendee spoke at the Investment Club of America’s annual economic summit, called Econosummit, on Sunday March 1, 2020 in Las Vegas.

Dr. Wendee attended the The National Due Diligence Alliance (TNDDA) investment banking conference, which was held March 6-8, 2020 at the Four Seasons Resort in Dallas, Texas. This is a conference held several times throughout the year for investment bankers and registered investment advisers to learn about new opportunities in the Alternative Investment asset classes.

TNDDA Meeting in Dallas, Texas

We have been researching the use of crowdsourcing for investment ideas. We will be sending a survey out in the next few weeks to get your input on the economy and the markets; and to get any investment ideas that you would like to share. We will compile this input and distribute the results to you and our other subscribers. We have been testing our crowdsourcing models with students and have been having good success and results.

Dr. Wendee has been researching and writing a new theory of economics known as, The Value Creation Theory of the Economy (also known as, Intrinsinomics). The full paper on Intrinsinomics will be published in the near future.

Finance 3350: Personal Finance-Portfolio & Risk Management– Dr. Wendee taught teaching Finance 3350 – Portfolio & Risk Management at California State University, Los Angeles (CSULA) for the Summer term starting May 2020. Dr. Wendee teaches courses in Management and Finance at CSULA.

Business 548: Strategy and Decision Making – Dr. Wendee taught Business 548 – Strategy and Decision Making at California Baptist University (CBU) starting at the end of June 2020. Dr. Wendee teaches courses in Finance, Business, Strategy & Decision Making, and Economics at CBU.

Business 303: Business Finance – Dr. Wendee taught Business 303 – Business Finance at California Baptist University (CBU) starting at the end of August 2020. Dr. Wendee teaches courses in Finance, Business, Strategy & Decision Making, and Economics at CBU.

Business 539: Financial Management – Dr. Wendee is teaching Business 539 – Financial Management at California Baptist University (CBU) which started at the end of October. Dr. Wendee teaches courses in Finance, Business, Strategy & Decision Making, and Economics at CBU.

Business 217: Microeconomics – Dr. Wendee is teaching Business 217 – Microeconomics at California Baptist University (CBU) which started in January 2021. Dr. Wendee teaches courses in Finance, Business, Strategy & Decision Making, and Economics at CBU.

Business 218: Macroeconomics – Dr. Wendee is teaching Business 218 – Macroeconomics at California Baptist University (CBU) which started in January 2021. Dr. Wendee teaches courses in Finance, Business, Strategy & Decision Making, and Economics at CBU.

Finance 430: Risk Management – Dr. Wendee is teaching Finance 430 – Risk Management at California Baptist University (CBU) which started in January 2021. Dr. Wendee teaches courses in Finance, Business, Strategy & Decision Making, and Economics at CBU.

Dr. Wendee presented a paper on his new theory of economics known as, The Value Creation Theory of the Economy (also known as, Intrinsinomics), at the International Leadership Association’s annual global conference which was held in Ottawa, Canada last Fall.

Dr. Wendee presented an updated paper on his new theory of economics known as, The Value Creation Theory of the Economy (also known as, Intrinsinomics), at the International Leadership Association’s annual global conference which was to have been held in San Francisco, California in November, but which was held virtually instead due to the Coronavirus.

Dr. Wendee delivered a talk entitled: Using Alternative Assets to Increase Portfolio Returns and Decrease Risk at the BrightTalk Q4 2020 Outlook Summit on October 28, 2020. You can access additional information on the summit and Dr. Wendee’s presentation here.

Dr. Wendee delivered a talk  at the BrightTalk conference on December 9, 2020 entitled: Emerging Themes and Great Places to Invest for 2021. You can access additional information on the summit and Dr. Wendee’s presentation here.

Dr. Wendee delivered a talk  at the BrightTalk conference on January 20, 2021 entitled: Developing an Income-Producing Strategy for 2021 and Beyond. You can access additional information on the summit and Dr. Wendee’s presentation here.

Dr. Wendee is working on a financial planning modeling program which will be available in the near future. The modeling program is designed to assist anyone in creating a financial plan and is customizable for each person’s unique financial planning goals. A working draft of the model is currently in beta test with students. Click this link, schematic, to go to the clickable document under the subheading Financial Planning Process (Draft) in the Intrinsic Value Wealth Report to see a draft of the schematic for the new financial planning process.

Dr. Wendee has been developing an econometric model specifically designed to monitor and forecast the global economy as this current economic crisis unfolds. This new econometric model is based on other econometric models that he has designed and have used for many years. You can find some of these earlier models in Book # 6 – Simple and Effective Economic Forecasting in the sister website to this website which is called the Intrinsic Value Wealth Report. The new econometric model has been constructed with some additional tools and methods that he has learned and some that he has developed over the last several years. He will be talking more about this new econometric model in this Commentary over the next few months. His comments and forecasts on the economy and the markets going forward will be based to a significant extent on this new model.

We have begun raising capital for our fund-of-funds investment, Northwest Quadrant Opportunity Fund, LLC. The fund engineers and constructs an investment vehicle consisting of Alternative Asset investments. The fund’s objective is to build a diversified portfolio of strong, solid, steady- performing assets, with highly qualified asset managers who have proven track records that meet our underwriting requirements. To learn more about the Northwest Quadrant Opportunity Fund, LLC and to obtain an offering memorandum, please click Northwest Quadrant Opportunity Fund, LLC.

Intrinsic Value Wealth Creation pyramid

We always conclude our commentary with a discussion of the Intrinsic Value Wealth Creation Pyramid. The Intrinsic Value Wealth Creation Pyramid is designed to show some of the major categories for building wealth. It is the result of many years of study of the wealth building process; experience working with clients who have built considerable wealth; and my own personal experience building wealth. Newsletter subscribers should consult the Intrinsic Value Wealth Creation Pyramid as one of many useful investment tools while considering their investment plans.

The chart in this section is an expanded version of the Intrinsic Value Wealth Creation Pyramid Chart referenced in the Forbes.com article entitled, Nine of the Best Ways to Build Wealth.
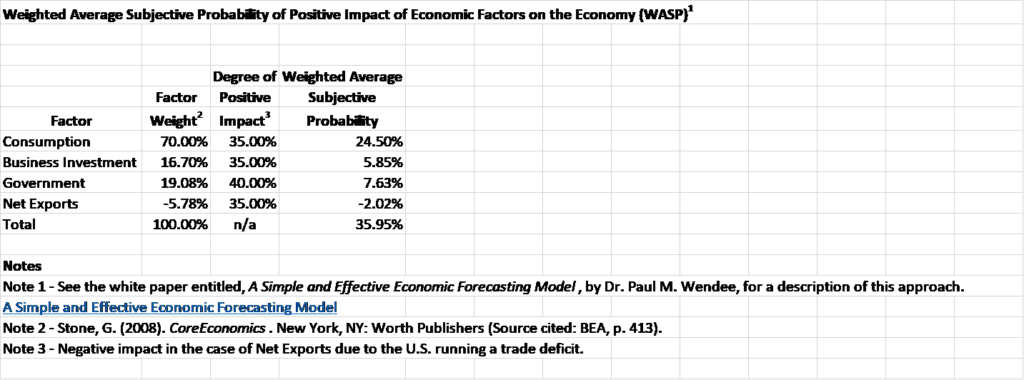
RESOURCES

See our Resources section for links to economic and other resources used in the preparation of this Commentary.

Posted in Economic & Business Chart Room, Economic Outlook, Entrepreneurship, Focus List, Investment Recommendations, Investments, Notes From The Field, Special Situations, Uncategorized, VDI/REEP, Visionary Ideas | Tagged , , , , , , , , , , , , , , , , , , , , , , , , , , , , , , , , , | Comments Off on WEEKLY COMMENTARY February 9, 2021

WEEKLY COMMENTARY February 2, 2021

Out of Thin Air – Where The Stimulus Money Comes From

I was interviewed recently for The Banner, the school newspaper at California Baptist University, in an article entitled, Covid-19 Relief Could Have Long-Term Effects on U.S. Economy. The main question I was asked is: “Where does the stimulus money come from? Good question; one that I don’t think many people really understand – or worry about, as long as they get their stimulus check.

The federal debt has swollen to over $27 trillion. The federal deficit was $3.1 trillion in fiscal 2020. President Biden is asking for a $1.9 trillion dollar relief package. Where indeed does the money for all of this come from?

There are generally only three sources for federal spending: (1) tax revenue; (2) borrowing; and (3) printing money. The first, tax revenue, is fairly obvious. The federal government has the ability to tax – and taxing is something they are fairly good at. We often say that government debt is backed by “the full faith and credit of the Unites States Government.” What gives that backing credibility is the U.S. government’s ability to tax its citizenry. But there is a limit to how much the government can tax, of course. Unfortunately, I don’t believe policy makers have fully realized what that limit is.

The second source of spending is federal debt. As I said earlier, the federal debt is over $27 trillion. I have included a chart in the Charts for Review and Thought below showing the level of debt. As you can see, the debt has increased at an exponential rate since the 1980s, and the rate of that expansion has exploded in the last couple of years due largely to the pandemic.

The third source is the printing of money. When we say the government prints money, we don’t mean the dollar bills and coins that we carry around in our pockets. Yes, the government does print currency and mint coins; but the really big “printing of money” is done electronically and is done by the Federal Reserve (the “Fed”). The Fed has the ability to inject money (print money) into the banking system by buying government bonds with the push of a button. A new phenomenon that has resulted from the pandemic is the Fed lending directly to businesses, a new policy adopted by the Fed in an attempt to help businesses during the pandemic.

So, the question is: “Can this cycle of debt and the printing of money go on forever?” Most economists don’t believe so. Many, but not all, economists believe that the debt eventually has to be paid back. That could be a problem. Federal Reserve Chairman Jerome Powell “told reporters that the U.S. has not been on a ‘sustainable’ fiscal path for some time, noting the nation’s debt is growing faster than the economy” (Sergent et al, 2021).

Furthermore, many economists, though not all, believe that “too much money chasing too few goods”, which is what happens when you print too much money without increasing the production of goods and services, will only cause inflation. As the renowned economist Milton Friedman said: “Inflation is always and everywhere a monetary phenomenon in the sense that it is and can be produced only by a more rapid increase in the quantity of money than in output” (Friedman, 1970). Federal Reserve critic and former Republican presidential candidate Ron Paul told USA TODAY: “What we’re working with now is fake money, a fake measuring rod. It is unbelievable” (Schrotenboer, 2020).

One final note is to consider the effect on future generations if the debt is not paid back in our generation and/or inflation escalates to high levels. As to the debt, if the current generation doesn’t pay the debt, it will become a burden of future generations. As for inflation, it is in essence a tax on future generations. Neither situation is good.

While the pandemic has wrought a heavy toll on the global economy – not just the U.S. economy – the way out of this crisis it to help businesses rebuild so that they can provide the much-needed infrastructure and increase in the production of goods and services that lead to economic growth and productivity. While some government stimulus may be necessary in the short run because of the devastating effects of the pandemic, it is an open question as to how much stimulus is too much. We have probably already reached the level of too much stimulus. Going forward, it will be imperative to help businesses get back on their feet. I will explore this idea further in an upcoming paper I am writing on a new economic concept I call The Value Creation Theory of the Economy, or Intrinsinomics, for short. I have made two presentations on this concept at the International Leadership Association’s (ILA) annual conferences in the past two years. You can access these presentations here.

References

Friedman, M. (1970). Counter-Revolution in Monetary Theory. Wincott Memorial Lecture, Institute of Economic Affairs.

Schrotenboer, B. (2020). US Is Printing Money To Help Save The Economy From Covid-19 Crisis, But Some Wonder How Far It Can go. USA Today.

Sergent, J., et al. (2021). New Covid-19 Stimulus Bill Is Half of March’s. How Else It Differs. El Paso Times. El Paso, Texas.

Economic and Investment Highlights

Last Week

China became the top nation for new foreign direct investment, overtaking the U.S.

Fewer borrowers are resuming making their mortgage payments.

Options trading is continuing this year at an enormous rate, following records set in 2020.

Longtime talk-show host, Larry King, died from complications of Covid-19 at the age of 87.

Yellen was confirmed as Treasury Secretary.

The House sent the article of impeachment against Trump to the Senate.

GE booked $4.4 billion in fourth quarter cash flow, beating its own projection and ending 2020 without burning cash. This was a year ahead of schedule.

GameStop, AMC, and Blackberry, among others, have upended Wall Street in trading.

The Fed kept its easy money policies in place, citing concerns that business activity has softened amid a resurgence in the pandemic.

Apple had its most profitable quarter ever at the end of 2020 with quarterly revenue exceeding $100 billion.

The U.S. economy shrank in 2020 for the first time since the financial crisis, but grew rapidly in the fourth quarter. It was the worst year since the 1940s.

U.S. household income rose in December as new government stimulus aid kicked in.

The Dow, the S&P 500, and the Nasdaq all fell for the week. The Dow was down 3.3%; the S&P 500 was down 3.31%; and the Nasdaq was down 3.5%. The 10-year treasury yield ended the week at 1.090%. Gold closed at $1,847.30 for the week. Oil closed at $52.20 for the week.

The Week Ahead

This link takes you to Econoday’s Economic Calendar and Economic Events and Analysis which shows the upcoming economic reporting events scheduled in the week and months ahead.

Summary

Note: The models below may not capture the impact of COVID-19 beyond their impact on GDP source data and relevant economic reports that have already been released. They may not anticipate the impact of COVID-19 on forthcoming economic reports beyond the standard internal dynamics of the models.

Note: The comments that follow are derived from the economic indicators referenced in the Resources section of this newsletter and other sources in this report.

The Aruoba-Diebold-Scotti Business Conditions Index (ALS) had been trending up for several weeks from having dipped in 2019. Recently with the advent of the economic collapse, the index crashed. It has now been generally trending down again, but fluctuating within a narrow band. This is a slightly positive indicator for the economy on a short-term basis.

The GDPNow model estimate for real GDP growth (seasonally adjusted annual rate) in the fourth quarter of 2020 is 7.4 percent. This reading agrees with the ALS model assessment of an improving short-term economic environment.

The New York Fed Staff Nowcast stands at 6.48 percent for 2021:Q1.

The Chicago Fed National Activity Index (CFNAI) showed an increase in economic activity in October. The Chicago Fed National Activity Index (CFNAI) was +0.52 in December, up from +0.31 in November.

All told, these short-term economic indicators are a mixed analysis for the economy, at least on a short-term basis.

Expectations that stock prices will rise over the next six months is now at 37.7% in a recent AAII Sentiment Survey. The historical average is 38.0% for the survey. 24.0% of the investors in the survey described their short-term outlook as neutral and 38.3% were bearish. Please see the AAII Sentiment Survey for the complete results.

The latest Gross Output (GO) reading (December 22, 2020) showed that Gross Output rose significantly in the 3rd quarter 2020.

Advisor Perspectives publishes a monthly market valuation update.

Advisor Perspectives has market valuation and other useful and interesting investment information at this website.

Fourth Quarter 2020 Survey of Professional Forecasters

[Release Date: November 16, 2020] The outlook for real GDP growth in the next few quarters looks weaker now than it did three months ago, according to 37 forecasters surveyed by the Federal Reserve Bank of Philadelphia. The forecasters predict the economy will expand at an annual rate of 4.0 percent this quarter, lower than the prediction of 5.8 percent from the previous survey. On an annual-average over annual-average basis, the forecasters expect real GDP to decrease 3.5 percent this year but to recover and grow at an annual rate of between 2.1 percent to 4.0 percent over each of the following three years.

A downward revision to the projection for the unemployment rate accompanies the outlook for growth. The forecasters predict unemployment will decrease from a projected 7.0 percent this quarter to 5.8 percent in the fourth quarter of 2021. The prediction for the current-quarter unemployment rate is 2.5 percentage points lower than that of the last survey. On an annual-average basis, the panelists predict the unemployment rate will decline from a projected 8.2 percent in 2020 to 4.6 percent in 2023.

On the employment front, the forecasters expect job gains in the current quarter at a rate of 689,800 per month. The employment projections for the current and the following three quarters show upward revisions from those of the previous survey. The projections for the annual-average level of nonfarm payroll employment suggest job losses at a monthly rate of 718,000 in 2020 and job gains at a monthly rate of 321,600 in 2021. (These annual-average estimates are computed as the year-to-year change in the annual-average level of nonfarm payroll employment, converted to a monthly rate.) 

The next survey will be released on February 12, 2021

NABE Surveys

NABE Business Conditions Survey – January 2021

COMMENTS: “Results of the January NABE Business Conditions Survey show that conditions continued to improve during the last quarter of 2020 after the collapse experienced during the first half of last year,” said NABE President Manuel Balmaseda, CBE, chief economist, CEMEX. “Momentum has continued to build, and survey respondents seem much more positive about the future today than in October. Furthermore, expectations regarding GDP growth continue to improve, with 69% of respondents expecting growth in inflation-adjusted gross domestic product over the next year of 3.0% or higher, compared to just 59% in the October survey.” 

HIGHLIGHTS

• Respondents’ views continue to coalesce around an expansionary outlook for growth in inflation-adjusted gross domestic product (real GDP), with 69% of panelists expecting GDP to expand by 3.0% or more. Just 2% of respondents anticipate negative growth over the year ahead (ending in Q4 2021). This compares favorably with results of the July 2020 survey in which nearly 40% of respondents anticipated shrinking output growth over the four quarters ending in Q2 2021, as well as with results in the October 2020 survey in which roughly 10% viewed negative growth as most likely.

• Just over half (51%) of respondents report that sales at their firms increased in Q4 2020, nearly matching the 52% in the October survey who reported an increase in Q3. The share that reports a decrease in sales declined from 20% in October to 13% in the January survey. As a result, the Net Rising Index (NRI) for sales—the percentage of panelists reporting rising sales minus the percentage reporting falling sales—climbed to a two-year high of 38, up from 33 in October and -14 in July. The forward-looking NRI for anticipated sales over the next three months continues to rise, from 31 in October to 38—the highest reading since the April 2019 survey.

• Profit margins reversed course in Q4, with more respondents reporting profits rising than falling. The NRI for profit margins increased 18 points to 14 from -4 in October. The share of respondents reporting rising profit margins increased from 21% in October to 30% in January, while the percentage reporting falling margins declined 9 percentage points— from 25% in October to 16% in January. Of the survey’s four sectors, the goods-producing sector experienced the largest jump in the NRI for profit margins, a 56-point swing from -18 in October to 38 in January.

• The NRI for prices charged is 15, having surged 14 points from October. NRIs by sector, however, vary significantly. The January NRI for goods-producing firms is 71, after registering 21 in October. The index for finance, insurance, and real estate (FIRE) sector firms remains negative at -12, up from -19 in October. Between these extremes are the NRI for service sector firms, with a reading of 8, up from 3 in October, and the NRI of 25 for the transportation, utilities, information, communications (TUIC) sector. The share of respondents expecting price increases in the next three months continues to rise—35% in January compared to 26% in October—resulting in an NRI of 30. Five percent of panelists anticipate falling prices in the next three months.

• The NRI for materials costs accelerated to an NRI of 28, the highest reading since April 2019. All sectors registered positive NRIs, led by goods-producers at 62. The NRI for expected costs rose significantly, from 8 to 34, after having been as low as -21 in April 2020.

• The NRI for wages and salaries rebounded to 19 in the January survey, a clear continuation in the recovery from the depths of the COVID-19 slump during 2020. The upward movement in the index resulted from an increase in the share of respondents citing rising wages—to 28% from 17% in October—and a decrease to 9% from 13% in the share reporting falling wages.

• The NRI for employment rose to 7—the highest reading since October 2019, and the first positive value since April 2020. The share of respondents citing decreased hiring activity fell from 27% to 13%, while 19% report employment increased at their firms compared to 9% in the October survey. All sectors have positive NRIs. The NRI for the services sector rose from -5 in October to 6. The largest increase is in the goods-producing sector, up 54 points to 8 in January. Respondents remain optimistic regarding the near-term outlook for employment, as the forward-looking NRI rose to 21 from 1 in the October survey. Respondents from all sectors expect their firms will add jobs rather than reduce headcount in the near term.

• Fifty-six percent of respondents report there were no shortages of inputs in Q4 2020—slightly smaller than the percentage in the October survey. The largest increase is in the share of respondents reporting shortages in skilled labor—up from 16% in October to 24%. The share reporting shortages of unskilled labor increased from 2% to 7%.

• After negative readings for three straight quarters, the NRI for capital spending bounced back strongly in the fourth quarter, rising from -8 to 15—the highest reading in one year. Twenty-eight percent of respondents report that capital spending at their firms rose during Q4, up from 19% in Q3, with the percentage citing declining investments shrinking from 27% to 13%. Six-in-ten note no change in capital expenditures over the past three months. The forwardlooking NRI for capital spending is strongly positive, rising from 6 in October to 22 in January. The percentage of respondents expecting increased activity jumped from 19% to 34%.

• Businesses continue to make changes to employment and wages in response to COVID-19, albeit less so than in the October survey. Reducing employee headcount was the most common response, cited by 34% of respondents. But this is down from 54% in October and 68% in July.

• Respondents’ near-term outlook is little changed compared to that in the October survey. Thirty-four percent of respondents report a “Better” outlook compared to a month ago, down slightly from 36% in October. Only 6% cite a “Worse” near-term outlook, compared to 8% in the previous survey.

• Sales volumes improved in the fourth quarter of 2020. Fifty-two percent of respondents report sales volumes at “76-100% of pre-crisis level,” up from 46% in the previous survey. Furthermore, 23% indicate that sales at their companies are already above pre-crisis levels, matching the October reading, and led by the TUIC and goods-producing sectors.

• Nearly one-third (32%) of respondents reports that sales volumes have already returned to their normal level of operations, while 36% expect that to happen sometime in 2021.

• Only 5% of respondents report that their firms have either applied or are planning to apply for Main Street Lending programs, up slightly from 3% in the October survey.

• Roughly half (51%) of respondents anticipates that their firms will suspend their stay-at-home policies in the second half of 2021, up from 22% in the October survey.

• Eleven percent of panelists expect that all of the staff at their firms will eventually return to pre-pandemic working arrangements. Those from the services sector account for the largest share holding this view.

• Nearly half of respondents (46%) indicates that the vaccine rollout or new administration will have “No” impact on their firm’s outlook for sales, hiring, capex, etc. Conversely, 37% of respondents indicate “Yes, positive,” while 5% cite “Yes, negative.”

NABE Outlook Survey – December 2020

SUMMARY: “The NABE [National Association for Business Economics] Outlook panel anticipates more moderate growth in economic activity going forward after the sharp rebound during the third quarter,” said NABE President Manuel Balmaseda, CBE, chief economist, CEMEX. “The median forecast calls for a 4.1% annualized growth rate in the fourth quarter of 2020 for inflation-adjusted gross domestic product, or real GDP. In addition to the 33.1% GDP growth in the third quarter of the year, this would reverse much of the 32% annualized decline from the second quarter. However, the panel has become slightly less bullish about 2021. The median real GDP growth estimate for 2021 is 3.4%, slightly less than the 3.6% forecasted in the October survey.” “NABE panelists have become more optimistic, on balance, with nearly one-third revising their outlook higher based on recent news of effective vaccines,” added Survey Chair Holly Wade, executive director, NFIB Research Center. “Seventy-three percent of panelists believe that the economy will have returned to pre-pandemic GDP levels by the second half of 2021, 18% expect it to reach that level in the first half of 2022, and 10% believe it will occur in the second half of 2022 or later. The 73% is a dramatic improvement from the October survey in which 38% of panelists believed that a full recovery would occur before 2022. “Just over one-third of respondents anticipate more downside risk to economic growth in 2021,” continued Wade. “Panelists point to a second wave of COVID-19 cases as their main concern.”

The National Association for Business Economics (NABE) released its October Outlook Survey which is summarized as follows: “The NABE Outlook panel sees a strong rebound in economic activity after the collapse experienced during the second quarter,” said NABE Vice President Manuel Balmaseda, CBE, chief economist, CEMEX. “The median forecast calls for a 25% annualized growth rate in the third quarter of 2020 for inflation-adjusted gross domestic product, or real GDP. That would reverse much of the 31% annualized decline from the second quarter. However, the panel has become less bullish about the fourth quarter of 2020, as well as 2021. The median real GDP growth estimate for 2021 is 3.6%, compared to a 4.8% forecast in the June survey.”

“NABE panelists have become more optimistic, on balance, but remain concerned about a potential second wave of COVID-19,” added Outlook Survey Chair Eugenio Aleman, economist, Wells Fargo Bank. “Thirty-eight percent of panelists believe that the economy will have returned to pre-pandemic GDP levels by the second half of 2021, 32% expect it to reach that level in the first half of 2022, and 30% believe it will occur in the second half of 2022 or later.

“About half of the panelists put the odds of a double-dip recession at 20% or less,” continued Aleman. “In contrast, one out of eight panelists places those odds at 50% or higher.”

Other highlights from the survey:

The median forecast calls for the unemployment rate to average 8.4% in 2020, 2.5 percentage points lower than the median forecast in the previous survey. Panelists expect the unemployment rate to decline each quarter, averaging 6.8% in 2021, compared with the 8% previously forecasted. The unemployment rate averaged 3.7% in 2019.

Panelists look for business investment to drop sharply this year. Real nonresidential fixed investment is forecasted to decline 6%. Panelists anticipate real nonresidential fixed investment to rise only gradually in 2021, increasing 2.4%.

Survey respondents expect inflation—as measured by the GDP price index—to be significantly lower in 2020 and 2021 relative to 2019. Inflation is forecasted to be 1.0% in 2020 and 1.5% in 2021. The index increased 1.8% in 2019.

Panelists expect the consumer price index (CPI) to rise 1.2% in 2020, significantly lower than the actual 1.8% growth in consumer prices in 2019. The 2020 forecast median has increased since the June survey, when panelists saw CPI rising by 0.7%. The panel anticipates consumer price growth will pick up moving forward, with a 1.9% annual average gain in 2021.

Panelists expect corporate profits to contract by 11% in 2020. The median forecast calls for profits to increase by 8.5% in 2021.

Four out of ten panelists indicate that 5% of jobs will be permanently lost due to firms closing. More than half of the panel suggest between 10% and 20% of job losses will be permanent.

Thirty-eight percent of panelists believe that the economy will have returned to pre-pandemic GDP levels by the second half of 2021; only 2% suggest this will occur before the end of 2020, 12% believe GDP will recover in the first half of 2021, and 24% anticipate such a return in the second half of 2021. Thirty-two percent of respondents expect GDP to reach pre-pandemic levels in the first half of 2022, and 22% believe it will occur in the second half of 2022.

For a more in-depth review and analysis of the economy, please see our mini-book on economic analysis and forecasting entitled: Simple and Effective Economic Forecasting.

NABE October Business Conditions Survey

“The October NABE Business Conditions Survey shows that firms are continuing to gain ground since the sharp economic downturn experienced in the first half of the year,” said NABE President Manuel Balmaseda, CBE, chief economist, CEMEX. “This momentum is expected to continue through the rest of 2020. In addition, more respondents than in the July survey anticipate stronger growth in inflation-adjusted gross domestic product over the next year.”  “More respondents in this survey report continued improvements, especially in sales and profit margins, at their firms during the past three months than in the July survey,” added NABE Business Conditions Survey Chair Holly Wade, executive director, NFIB Research Center. “Capital spending is also picking up steam, with more firms investing in their businesses over the past three months, and more planning to do the same in the next three months. “The employment picture is less rosy, with many firms still holding back on wage and staff increases,” continued Wade. “While slightly more respondents report an increase in employment at their firms over the last three months than in the previous survey, more also report a decrease in employment. Most firms are also forgoing raises to control costs with 70% of respondents’ firms reporting unchanged wages and salaries over the last two quarters, the highest reading since January 2014.”

Higlights

• The panel’s consensus outlook for the U.S. economy, measured by year-over-year growth in inflation-adjusted gross domestic product (real GDP), continued to improve in October compared to that in the two previous surveys. Eighty-nine percent of panelists expect real GDP to increase from the third quarter (Q3) of 2020 to Q3 2021. Only 9% of respondents expect the real GDP change to be zero or negative, compared to 31% of respondents who held this view in the July survey when asked about the outlook for the 12 months ending Q2 2021.

• For the first time since April 2019, a majority of respondents’ firms reports increased sales at their firms, with 52% indicating rising sales during Q3. The Net Rising Index (NRI) for sales—the percentage of panelists reporting rising sales minus the percentage reporting falling sales—surged upward, increasing 47 points to 33, up from -14 in July. The forward-looking NRI for anticipated sales over the next three months also rose, adding to the sharp increase reported in the July survey. The NRI for anticipated sales increased 13 points, from 18 in July to 31, with positive readings in three of the four industry sectors.

• Profit-margin increases were more widespread in Q3 2020, but remained less prevalent than decreases among respondents’ firms, with the NRI for profit margins increasing 21 points to -4. The share of respondents reporting rising profit margins increased from 15% in July to 21% in October, while the percentage reporting falling margins declined 15 percentage points—from 40% in July to 25% in October.

• The NRI for prices charged returned to neutral in October—registering +1—following the sharp decline during the first half of 2020, that brought the NRI in July to its lowest level since 1987. NRIs by sector, however, vary significantly. The NRI for goods-producing firms is 21, after registering -40 in July. But the index for finance, insurance, real estate (FIRE) sector firms remains negative with an NRI of -19. Between these extremes are the NRI for services, with a reading of 3, and the NRI of 8 for the transportation, utilities, information, communications (TUIC) sector. The share of respondents expecting price increases in the next three months rebounded from levels in the previous two surveys to 26% in October, resulting in an NRI of 20. Six percent anticipate falling prices in the next three months.

• The NRI for materials costs also rebounded from two quarters of negative readings to a reading of 10. All sectors registered positive NRIs, led by goods-producers at 15, bouncing back from -56 in July. The NRI for expected costs rose modestly, from 1 to 8, having been as low as -21 in April.

• Hiring at respondents’ firms remains depressed. The third-quarter NRI for employment levels over the last three months is -17, compared to -19 in the July survey. Even as the NRI improved, the share of respondents indicating there was decline in employment at their firms rose to 27% from 24% in the July survey. At the same time, 9% report employment increases at their firms, compared to 5% in July. The outlook for employment deteriorated in Q3, as the NRI for hiring expectations declined to just 1, down from 6 in the July survey. Respondents from the goods-producing and TUIC sectors expect their firms will add jobs in the next three months. In the July survey, three of the four sectors had positive NRIs for expected employment change in Q3 2020.

• The NRI for wages and salaries rebounded 13 points to 4 in the October survey. The upward movement in the index reflects an increase to 17% from 11% in July in the share of respondents citing rising wages, and a decrease to 13% from 19% in the share reporting falling wages. The forward-looking NRI for wages and salaries moved from 0 in July to 15 in October.

• Almost two-thirds of respondents report no shortages of inputs in Q3 2020, similar to results from the July survey. The share of respondents reporting shortages is virtually unchanged in the current survey across all inputs, except for a decline in the percentage indicating intermediate input shortages.

• The NRI for capital spending improved, from -19 in July to -8 in October. Fewer respondents report continuing declines in spending, while more indicate their firms’ capital spending increased during Q3 2020. However, service-sector panelists report not much improvement from the prior two readings. The forward-looking NRI for capital spending rose considerably, from -40 in April to 6 in October, as fewer respondents expect declines in spending over the next 3 months.

• In response to COVID-19, businesses continue to adjust employee headcount and wages. Imposing a hiring freeze is the most common response, cited by 69% of respondents.

• Respondents’ near-term outlook improved slightly in October compared to that in the July survey. Thirty-six percent of respondents report a “Better” near-term in October, compared to 34% in July. Only 8% indicate their near-term outlook is “Worse” in October, compared to 12% in July.

• Twenty-three percent of respondents report that sales at their companies are at “more than 100% of pre-crisis level,” an increase from the 15% in the July survey.

• Thirty-one percent of respondents expect sales to return to normal “sometime in 2021,” while 24% do not expect sales to return to normal until sometime in 2022. Only 10% expect sales to return to normal by the end of 2020.

• Only 3% of respondents report that their firms applied, or are planning to apply, for Main Street Lending programs.

• Thirty-five percent of respondents indicate their firms have implemented new work-at-home policies, allowing “all employees” to work from home during the pandemic. Another 33% allow “most employees” to work from home, while 16% only allow “some employees” to work from home.

• Thirty-one percent of respondents report that their firms will wait for “progress regarding COVID-19” before changing their work-from-home policies. Twenty-two percent indicate their companies will wait until the second half of 2021, while 16% of firms plan to suspend work-from-home policies in the first half of 2021.

Stock Market Valuations

Our estimates of the market valuations for two stock market indices, the Dow Jones Industrial Average (DJIA) and the Standard & Poor’s 500 (S&P 500), can be found in the file below:

Conclusion

During this time of global flux due to the coronavirus, I am leaving the Conclusion discussion below the same as was posted on March 23, 2020. The March 23, 2020 discussion still adequately reflects my thinking on the current state of affairs.

Important Note: While I don’t believe it is time to jump back into the stock market in a big way because of the market’s overvaluation, I have been advising the last few of weeks in this Commentary and in my weekly podcast, Intrinsic Value Wealth Report Radio, that investors can continue building their investment portfolios by selecting individual securities that offer growth and value opportunities.

Reprinted from March 23, 2020

Up until the past week, the economy had been in a stable but somewhat vulnerable state. Nonetheless, it had remained fairly strong. In fact, robust consumer spending and strong labor market conditions had given us confidence that the economy, which had been in its tenth year of expansion, could continue to grow. But we were cautious on this outlook. There were several reasons for our caution. U.S. business growth had been mixed. And global economic growth had been mixed as well. The new coronavirus was becoming a global economic threat, although it was still too early to tell how much of an effect it would ultimately have. Debt is at high levels for consumers, businesses, and government (at all levels of government). Finally, this is an election year that will likely have significant consequences either positively or negatively depending on the outcome of the elections. And of course, it is still too early to tell what the outcome of the elections will be.

In just a few days, the coronavirus’s effect on the economy and the markets went from a ripple to a tsunami. Businesses are shuttering, events are being cancelled or postponed, grocery store shelves are empty, and people are being asked or ordered to stay home. The markets are now deep in bear market territory. The effects on the economy, even given the short time that the economy has been retreating, may be with us for a long time. There is now a much greater risk of a recession, and there has even been some talk of a depression. The government, the Fed, Republicans, and Democrats, and pretty much the entire country, is trying to get the virus under control and is coming up with plans to mitigate the long-term economic effects caused by the virus. But the virus has impacted the economy – in a significant way – in just a short time. How long lasting the effects will be no one can tell right now. The economy has been largely shut down and remains so today. It takes time to restart the economy after a situation such as what is occurring at the present time.

Given these events and the rapidly deteriorating situation, as I said last week, I would caution not to panic. The economy and the markets will get better. The situation is bad – there is no doubt about that – but it will turn around. The real question is when will it turn around? No one knows that at the present time. But it will turn around.

For now, review your investment portfolios. It is highly likely that all or most of your stocks are down. You should not consider selling the bulk of your stocks – only consider selling companies that are not sound companies. But do recognize that as the economy deteriorates, even good companies will be affected.

For stock market value hunters, we believe it is still too early to jump back in. We will be closely monitoring the markets using the many tools and models that we have developed over the years to assess the economy and the markets. We will use our best judgement and thoughts to let you know when we believe things are turning around. The turnaround hasn’t happened yet.

We believe it is important to maintain a long-term view toward investing. But for now, just sit tight. Eventually, this means that you should continue building your investment portfolio using the Cassandra Stock Selection Model to select individual securities that offer growth and value opportunities.

Chart for Review and Thought

Federal Debt: Total Public Debt
Federal Surplus or Deficit

Simple and Effective Economic Forecasting Model

Note: The table and chart below have not been updated. However, we believe that a recession is quite likely. In the chart below, the bottom green line shows what a recession could look like.

Notes (GDP Growth Chart):

  1. See the July 8, 2019 Commentary for an introduction to this model.
  2. Actual numbers 2007 through 2019; forecasted numbers thereafter.
  3. Normal GDP growth is typically in the 2% to 3% range.
  4. A recession is generally defined as two consecutive quarters of negative economic growth as measured by a country’s gross domestic product (GDP).

Thought for the Week

“Never Let A Good Crisis Go To Waste” ~ Winston Churchill

Announcements

The Intrinsic Value Wealth Report has started a new YouTube channel called Intrinsic Value Wealth Report TV. You can view the YouTube channel at Intrinsic Value Wealth Report TV.

The Intrinsic Value Wealth Report has started a new podcast called Intrinsic Value Wealth Report Radio. You can listen to the podcast at Intrinsic Value Wealth Report Radio.

Dr. Wendee spoke at the Investment Club of America’s annual economic summit, called Econosummit, on Sunday March 1, 2020 in Las Vegas.

Dr. Wendee attended the The National Due Diligence Alliance (TNDDA) investment banking conference, which was held March 6-8, 2020 at the Four Seasons Resort in Dallas, Texas. This is a conference held several times throughout the year for investment bankers and registered investment advisers to learn about new opportunities in the Alternative Investment asset classes.

TNDDA Meeting in Dallas, Texas

We have been researching the use of crowdsourcing for investment ideas. We will be sending a survey out in the next few weeks to get your input on the economy and the markets; and to get any investment ideas that you would like to share. We will compile this input and distribute the results to you and our other subscribers. We have been testing our crowdsourcing models with students and have been having good success and results.

Dr. Wendee has been researching and writing a new theory of economics known as, The Value Creation Theory of the Economy (also known as, Intrinsinomics). The full paper on Intrinsinomics will be published in the near future.

Finance 3350: Personal Finance-Portfolio & Risk Management– Dr. Wendee taught teaching Finance 3350 – Portfolio & Risk Management at California State University, Los Angeles (CSULA) for the Summer term starting May 2020. Dr. Wendee teaches courses in Management and Finance at CSULA.

Business 548: Strategy and Decision Making – Dr. Wendee taught Business 548 – Strategy and Decision Making at California Baptist University (CBU) starting at the end of June 2020. Dr. Wendee teaches courses in Finance, Business, Strategy & Decision Making, and Economics at CBU.

Business 303: Business Finance – Dr. Wendee taught Business 303 – Business Finance at California Baptist University (CBU) starting at the end of August 2020. Dr. Wendee teaches courses in Finance, Business, Strategy & Decision Making, and Economics at CBU.

Business 539: Financial Management – Dr. Wendee is teaching Business 539 – Financial Management at California Baptist University (CBU) which started at the end of October. Dr. Wendee teaches courses in Finance, Business, Strategy & Decision Making, and Economics at CBU.

Business 217: Microeconomics – Dr. Wendee is teaching Business 217 – Microeconomics at California Baptist University (CBU) which started in January 2021. Dr. Wendee teaches courses in Finance, Business, Strategy & Decision Making, and Economics at CBU.

Business 218: Macroeconomics – Dr. Wendee is teaching Business 218 – Macroeconomics at California Baptist University (CBU) which started in January 2021. Dr. Wendee teaches courses in Finance, Business, Strategy & Decision Making, and Economics at CBU.

Finance 430: Risk Management – Dr. Wendee is teaching Finance 430 – Risk Management at California Baptist University (CBU) which started in January 2021. Dr. Wendee teaches courses in Finance, Business, Strategy & Decision Making, and Economics at CBU.

Dr. Wendee presented a paper on his new theory of economics known as, The Value Creation Theory of the Economy (also known as, Intrinsinomics), at the International Leadership Association’s annual global conference which was held in Ottawa, Canada last Fall.

Dr. Wendee presented an updated paper on his new theory of economics known as, The Value Creation Theory of the Economy (also known as, Intrinsinomics), at the International Leadership Association’s annual global conference which was to have been held in San Francisco, California in November, but which was held virtually instead due to the Coronavirus.

Dr. Wendee delivered a talk entitled: Using Alternative Assets to Increase Portfolio Returns and Decrease Risk at the BrightTalk Q4 2020 Outlook Summit on October 28, 2020. You can access additional information on the summit and Dr. Wendee’s presentation here.

Dr. Wendee delivered a talk  at the BrightTalk conference on December 9, 2020 entitled: Emerging Themes and Great Places to Invest for 2021. You can access additional information on the summit and Dr. Wendee’s presentation here.

Dr. Wendee delivered a talk  at the BrightTalk conference on January 20, 2021 entitled: Developing an Income-Producing Strategy for 2021 and Beyond. You can access additional information on the summit and Dr. Wendee’s presentation here.

Dr. Wendee is working on a financial planning modeling program which will be available in the near future. The modeling program is designed to assist anyone in creating a financial plan and is customizable for each person’s unique financial planning goals. A working draft of the model is currently in beta test with students. Click this link, schematic, to go to the clickable document under the subheading Financial Planning Process (Draft) in the Intrinsic Value Wealth Report to see a draft of the schematic for the new financial planning process.

Dr. Wendee has been developing an econometric model specifically designed to monitor and forecast the global economy as this current economic crisis unfolds. This new econometric model is based on other econometric models that he has designed and have used for many years. You can find some of these earlier models in Book # 6 – Simple and Effective Economic Forecasting in the sister website to this website which is called the Intrinsic Value Wealth Report. The new econometric model has been constructed with some additional tools and methods that he has learned and some that he has developed over the last several years. He will be talking more about this new econometric model in this Commentary over the next few months. His comments and forecasts on the economy and the markets going forward will be based to a significant extent on this new model.

We have begun raising capital for our fund-of-funds investment, Northwest Quadrant Opportunity Fund, LLC. The fund engineers and constructs an investment vehicle consisting of Alternative Asset investments. The fund’s objective is to build a diversified portfolio of strong, solid, steady- performing assets, with highly qualified asset managers who have proven track records that meet our underwriting requirements. To learn more about the Northwest Quadrant Opportunity Fund, LLC and to obtain an offering memorandum, please click Northwest Quadrant Opportunity Fund, LLC.

Intrinsic Value Wealth Creation pyramid

We always conclude our commentary with a discussion of the Intrinsic Value Wealth Creation Pyramid. The Intrinsic Value Wealth Creation Pyramid is designed to show some of the major categories for building wealth. It is the result of many years of study of the wealth building process; experience working with clients who have built considerable wealth; and my own personal experience building wealth. Newsletter subscribers should consult the Intrinsic Value Wealth Creation Pyramid as one of many useful investment tools while considering their investment plans.

The chart in this section is an expanded version of the Intrinsic Value Wealth Creation Pyramid Chart referenced in the Forbes.com article entitled, Nine of the Best Ways to Build Wealth.
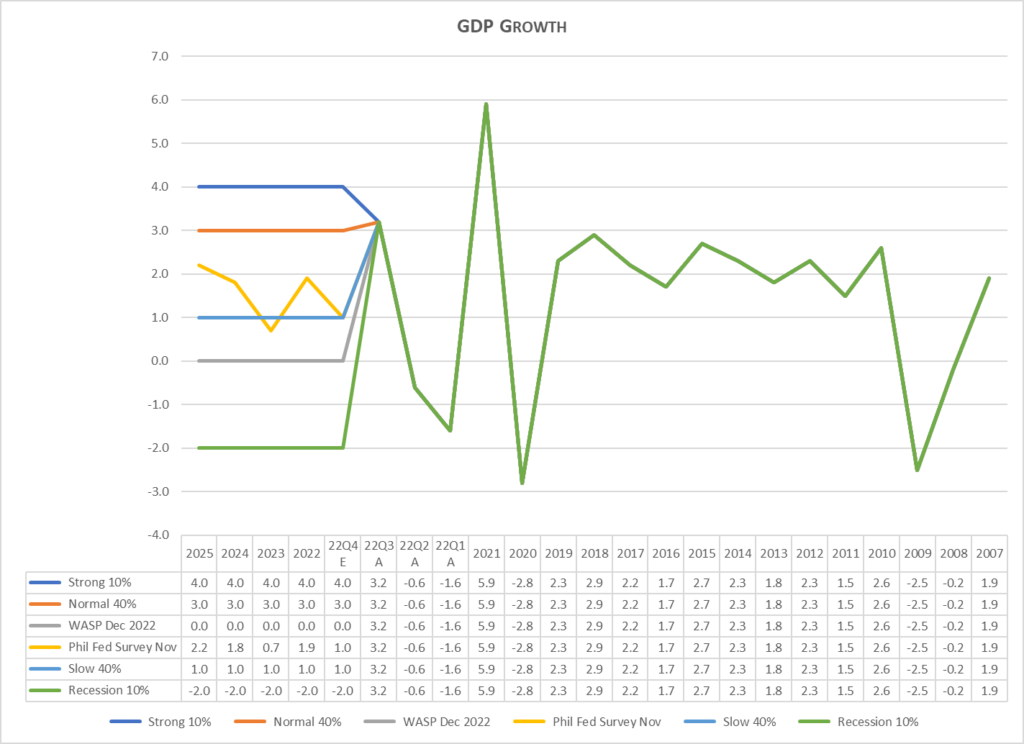
RESOURCES

See our Resources section for links to economic and other resources used in the preparation of this Commentary.

Posted in Economic & Business Chart Room, Economic Outlook, Entrepreneurship, Focus List, Investment Recommendations, Investments, Notes From The Field, Special Situations, Uncategorized, VDI/REEP, Visionary Ideas | Tagged , , , , , , , , , , , , , , , , , , , , , , , , , , , , , , , , , | Comments Off on WEEKLY COMMENTARY February 2, 2021

WEEKLY COMMENTARY January 26, 2021

Should One Consider Moving To Lower Risk Funds Contemplating An Impending Correction Or Reversion To The Mean? 

I had some great feedback from my talk on BrightTalk on January 20, 2021 on the subject of income investing with the title: Developing an Income-Producing Strategy for 2021 and Beyond. You can watch this presentation by registering here. Here is a great question with regards to existing investments.

Question: So, here is a question.  Your guidance is to not “jump in” because of the overvaluation of the market and the current PE ratios.  So, for existing fund investments that are returning at a pretty significant rate, should one consider moving to lower risk funds contemplating an impending correction or reversion to the mean?  Or, as Fidelity’s best investors have done, just forget about it (or die😊) [see the note below about my March 29, 2016 Commentary article: Are the Best Investors Forgetful or Dead?)] and wait for everything to rebound again and play the long game?

Answer (excerpted): Thanks for the question. It’s a great question that requires a bit of discussion.

I believe if you have a fund investment that is doing well, you should stay with it for the long haul. But keep in mind that we have seen and are likely to see more significant volatility in the markets over time.

I am not a market timer by any means and have continuously counseled investors to stay with their long-term investment program, which usually means to periodically invest relatively steady sums into the market (e.g., through monthly savings). Occasionally, the market provides extremely good values after a short-term correction. At those times, one can “jump into the market.” But that is a hard call to make and should always be based on a valuation of the market using P/E ratios and other valuation metrics. One such opportunity occurred for us in February 2016 when we were able to purchase Apple at a significant discount to our estimate of its intrinsic value. By the way, I teach intrinsic value and discounted cash flow analysis (DCF) in my finance classes.

As for the current market valuations, even the most bullish market observers acknowledge that the markets are extremely overvalued. For the most bullish of the crowd, many of them are thinking “it will be different this time.” My answer to them is: “It won’t be different this time – it never is!” History is very clear on that point. For a more detailed discussion on this point of view, please see my December 29, 2020 Commentary in the Intrinsic Value Wealth Report Newsletter.

For more on the market valuation, please see Advisor Perspectives. A recent analysis from Advisor Perspectives suggests “the market is overvalued somewhere in the range of 103% to 233%, depending on the indicator, up from 95% to 217% the previous month” (Jill Mislinski, Advisor Perspectives, January 6, 2021). I run a market valuation model for our Intrinsic Value Wealth Report Newsletter Commentaries. Here is the most recent published valuation (as of 1/8/21): Stock Market Valuations.

I mentioned in my BrightTalk presentation the idea of “reversion toward the mean.” I have been undertaking a fascinating study of this phenomenon over the past year. I have drafted an article on “reversion toward the mean” which I will be publishing in my Forbes column in the near future (as soon as I finish my study). But here is one perspective on reversion toward the mean as it applies to the market: “The stability of real returns [in the stock market] is striking; real stock returns in the nineteenth century do not differ appreciably from the real returns in the twentieth century. Note that stocks fluctuate both below and above the trendline but eventually return to the trend. Economists call this behavior mean reversion, a property that indicates that periods of above-average returns tend to be followed by periods of below-average returns and vice versa” (Siegel, 2014, p.6).

So back to your question about keeping existing fund investments that are performing well. I wouldn’t change things around. As I mentioned, I am not a market timer. We know that the market is overvalued, and we know that it will correct at some point in time. But we don’t know when that will happen and we don’t know how that will happen. As to the “how,” it is possible – though not likely in this current economic environment – that earnings could catch up with the price and correct the P/E ratio that way. As to the “when,” markets can and do stay overvalued for very long periods of time. And the price of staying out of the markets over very long periods of time and missing out on the compounded growth that occurs over time can be greater than the price of some volatility in the interim.

In the December 29, 2020 Commentary in the Intrinsic Value Wealth Report Newsletter, I shared some thoughts I have about the current economic, political, and investment environment. One final thing I would like to share with you is this chart: S&P 500 Forward P/E Ratios and Annualized 10 Year Returns (please sign up for the free account if the PDF chart doesn’t open when you click on the link). This is one of the most important charts I have ever come across to show what happens when one invests in overvalued markets.

So, while I don’t suggest becoming “forgetful or dead” (I wrote a commentary on the Fidelity study on March 29, 2016: Are the Best Investors Forgetful or Dead?), I would suggest hanging on to your funds and just keep investing for the long term.

References

Siegel, J. J. (2014). Stocks for the long run. New York, McGraw Hill.

Economic and Investment Highlights

Last Week

Yellen made the case for more economic aid at her confirmation hearing to be Treasury Secretary.

McConnell cast blame on Trump for the attack on the Capitol for the first time as he is attempting to preserve Republican sway in the Senate.

The U.S. exceeded 400,000 deaths from the pandemic.

An international panel said the WHO was poorly prepared to prevent a pandemic like Covid-19.

Biden was sworn in as the 46th president of the United States and immediately began issuing a broad range of executive orders.

China is facing a resurgence of coronavirus cases.

About 900,000 workers filed for unemployment last week.

A third ETF that invests in SPACs was launched on Wall Street.

BYD, a Warren Buffet-backed Chinese electric vehicle company, raised $3.9 billion.

Schumer said arguments in Trumps impeachment trial would begin the week of February 8th.

The U.S. economy picked up steam at the start of the year, while Europe showed signs of a second recession, according to a survey of purchasing managers.

The U.S. farm belt is experiencing an unexpected recovery.

Home sales hit a 14-year high.

The Dow, the S&P 500, and the Nasdaq all rose for the week. The Dow was up 0.6%; the S&P 500 was up 1.94%; and the Nasdaq was up 4.2%. The 10-year treasury yield ended the week at 1.090%. Gold closed at $1,855.70 for the week. Oil closed at $52.27 for the week.

The Week Ahead

This link takes you to Econoday’s Economic Calendar and Economic Events and Analysis which shows the upcoming economic reporting events scheduled in the week and months ahead.

Summary

Note: The models below may not capture the impact of COVID-19 beyond their impact on GDP source data and relevant economic reports that have already been released. They may not anticipate the impact of COVID-19 on forthcoming economic reports beyond the standard internal dynamics of the models.

Note: The comments that follow are derived from the economic indicators referenced in the Resources section of this newsletter and other sources in this report.

The Aruoba-Diebold-Scotti Business Conditions Index (ALS) had been trending up for several weeks from having dipped in 2019. Recently with the advent of the economic collapse, the index crashed. It has now been generally trending down again, but fluctuating within a narrow band. This is a slightly positive indicator for the economy on a short-term basis.

The GDPNow model estimate for real GDP growth (seasonally adjusted annual rate) in the fourth quarter of 2020 is 7.4 percent. This reading agrees with the ALS model assessment of an improving short-term economic environment.

The New York Fed Staff Nowcast stands at 2.58 percent for 2020:Q4.

The Chicago Fed National Activity Index (CFNAI) showed an increase in economic activity in October. The Chicago Fed National Activity Index (CFNAI) was +0.52 in December, up from +0.31 in November.

All told, these short-term economic indicators are a mixed analysis for the economy, at least on a short-term basis.

Expectations that stock prices will rise over the next six months is now at 42.5% in a recent AAII Sentiment Survey. The historical average is 38.0% for the survey. 23.0% of the investors in the survey described their short-term outlook as neutral and 34.5% were bearish. Please see the AAII Sentiment Survey for the complete results.

The latest Gross Output (GO) reading (December 22, 2020) showed that Gross Output rose significantly in the 3rd quarter 2020.

Advisor Perspectives publishes a monthly market valuation update.

Advisor Perspectives has market valuation and other useful and interesting investment information at this website.

Fourth Quarter 2020 Survey of Professional Forecasters

[Release Date: November 16, 2020] The outlook for real GDP growth in the next few quarters looks weaker now than it did three months ago, according to 37 forecasters surveyed by the Federal Reserve Bank of Philadelphia. The forecasters predict the economy will expand at an annual rate of 4.0 percent this quarter, lower than the prediction of 5.8 percent from the previous survey. On an annual-average over annual-average basis, the forecasters expect real GDP to decrease 3.5 percent this year but to recover and grow at an annual rate of between 2.1 percent to 4.0 percent over each of the following three years.

A downward revision to the projection for the unemployment rate accompanies the outlook for growth. The forecasters predict unemployment will decrease from a projected 7.0 percent this quarter to 5.8 percent in the fourth quarter of 2021. The prediction for the current-quarter unemployment rate is 2.5 percentage points lower than that of the last survey. On an annual-average basis, the panelists predict the unemployment rate will decline from a projected 8.2 percent in 2020 to 4.6 percent in 2023.

On the employment front, the forecasters expect job gains in the current quarter at a rate of 689,800 per month. The employment projections for the current and the following three quarters show upward revisions from those of the previous survey. The projections for the annual-average level of nonfarm payroll employment suggest job losses at a monthly rate of 718,000 in 2020 and job gains at a monthly rate of 321,600 in 2021. (These annual-average estimates are computed as the year-to-year change in the annual-average level of nonfarm payroll employment, converted to a monthly rate.) 

The next survey will be released on February 12, 2021

NABE Surveys

NABE Business Conditions Survey – January 2021

COMMENTS: “Results of the January NABE Business Conditions Survey show that conditions continued to improve during the last quarter of 2020 after the collapse experienced during the first half of last year,” said NABE President Manuel Balmaseda, CBE, chief economist, CEMEX. “Momentum has continued to build, and survey respondents seem much more positive about the future today than in October. Furthermore, expectations regarding GDP growth continue to improve, with 69% of respondents expecting growth in inflation-adjusted gross domestic product over the next year of 3.0% or higher, compared to just 59% in the October survey.” 

HIGHLIGHTS

• Respondents’ views continue to coalesce around an expansionary outlook for growth in inflation-adjusted gross domestic product (real GDP), with 69% of panelists expecting GDP to expand by 3.0% or more. Just 2% of respondents anticipate negative growth over the year ahead (ending in Q4 2021). This compares favorably with results of the July 2020 survey in which nearly 40% of respondents anticipated shrinking output growth over the four quarters ending in Q2 2021, as well as with results in the October 2020 survey in which roughly 10% viewed negative growth as most likely.

• Just over half (51%) of respondents report that sales at their firms increased in Q4 2020, nearly matching the 52% in the October survey who reported an increase in Q3. The share that reports a decrease in sales declined from 20% in October to 13% in the January survey. As a result, the Net Rising Index (NRI) for sales—the percentage of panelists reporting rising sales minus the percentage reporting falling sales—climbed to a two-year high of 38, up from 33 in October and -14 in July. The forward-looking NRI for anticipated sales over the next three months continues to rise, from 31 in October to 38—the highest reading since the April 2019 survey.

• Profit margins reversed course in Q4, with more respondents reporting profits rising than falling. The NRI for profit margins increased 18 points to 14 from -4 in October. The share of respondents reporting rising profit margins increased from 21% in October to 30% in January, while the percentage reporting falling margins declined 9 percentage points— from 25% in October to 16% in January. Of the survey’s four sectors, the goods-producing sector experienced the largest jump in the NRI for profit margins, a 56-point swing from -18 in October to 38 in January.

• The NRI for prices charged is 15, having surged 14 points from October. NRIs by sector, however, vary significantly. The January NRI for goods-producing firms is 71, after registering 21 in October. The index for finance, insurance, and real estate (FIRE) sector firms remains negative at -12, up from -19 in October. Between these extremes are the NRI for service sector firms, with a reading of 8, up from 3 in October, and the NRI of 25 for the transportation, utilities, information, communications (TUIC) sector. The share of respondents expecting price increases in the next three months continues to rise—35% in January compared to 26% in October—resulting in an NRI of 30. Five percent of panelists anticipate falling prices in the next three months.

• The NRI for materials costs accelerated to an NRI of 28, the highest reading since April 2019. All sectors registered positive NRIs, led by goods-producers at 62. The NRI for expected costs rose significantly, from 8 to 34, after having been as low as -21 in April 2020.

• The NRI for wages and salaries rebounded to 19 in the January survey, a clear continuation in the recovery from the depths of the COVID-19 slump during 2020. The upward movement in the index resulted from an increase in the share of respondents citing rising wages—to 28% from 17% in October—and a decrease to 9% from 13% in the share reporting falling wages.

• The NRI for employment rose to 7—the highest reading since October 2019, and the first positive value since April 2020. The share of respondents citing decreased hiring activity fell from 27% to 13%, while 19% report employment increased at their firms compared to 9% in the October survey. All sectors have positive NRIs. The NRI for the services sector rose from -5 in October to 6. The largest increase is in the goods-producing sector, up 54 points to 8 in January. Respondents remain optimistic regarding the near-term outlook for employment, as the forward-looking NRI rose to 21 from 1 in the October survey. Respondents from all sectors expect their firms will add jobs rather than reduce headcount in the near term.

• Fifty-six percent of respondents report there were no shortages of inputs in Q4 2020—slightly smaller than the percentage in the October survey. The largest increase is in the share of respondents reporting shortages in skilled labor—up from 16% in October to 24%. The share reporting shortages of unskilled labor increased from 2% to 7%.

• After negative readings for three straight quarters, the NRI for capital spending bounced back strongly in the fourth quarter, rising from -8 to 15—the highest reading in one year. Twenty-eight percent of respondents report that capital spending at their firms rose during Q4, up from 19% in Q3, with the percentage citing declining investments shrinking from 27% to 13%. Six-in-ten note no change in capital expenditures over the past three months. The forwardlooking NRI for capital spending is strongly positive, rising from 6 in October to 22 in January. The percentage of respondents expecting increased activity jumped from 19% to 34%.

• Businesses continue to make changes to employment and wages in response to COVID-19, albeit less so than in the October survey. Reducing employee headcount was the most common response, cited by 34% of respondents. But this is down from 54% in October and 68% in July.

• Respondents’ near-term outlook is little changed compared to that in the October survey. Thirty-four percent of respondents report a “Better” outlook compared to a month ago, down slightly from 36% in October. Only 6% cite a “Worse” near-term outlook, compared to 8% in the previous survey.

• Sales volumes improved in the fourth quarter of 2020. Fifty-two percent of respondents report sales volumes at “76-100% of pre-crisis level,” up from 46% in the previous survey. Furthermore, 23% indicate that sales at their companies are already above pre-crisis levels, matching the October reading, and led by the TUIC and goods-producing sectors.

• Nearly one-third (32%) of respondents reports that sales volumes have already returned to their normal level of operations, while 36% expect that to happen sometime in 2021.

• Only 5% of respondents report that their firms have either applied or are planning to apply for Main Street Lending programs, up slightly from 3% in the October survey.

• Roughly half (51%) of respondents anticipates that their firms will suspend their stay-at-home policies in the second half of 2021, up from 22% in the October survey.

• Eleven percent of panelists expect that all of the staff at their firms will eventually return to pre-pandemic working arrangements. Those from the services sector account for the largest share holding this view.

• Nearly half of respondents (46%) indicates that the vaccine rollout or new administration will have “No” impact on their firm’s outlook for sales, hiring, capex, etc. Conversely, 37% of respondents indicate “Yes, positive,” while 5% cite “Yes, negative.”

NABE Outlook Survey – December 2020

SUMMARY: “The NABE [National Association for Business Economics] Outlook panel anticipates more moderate growth in economic activity going forward after the sharp rebound during the third quarter,” said NABE President Manuel Balmaseda, CBE, chief economist, CEMEX. “The median forecast calls for a 4.1% annualized growth rate in the fourth quarter of 2020 for inflation-adjusted gross domestic product, or real GDP. In addition to the 33.1% GDP growth in the third quarter of the year, this would reverse much of the 32% annualized decline from the second quarter. However, the panel has become slightly less bullish about 2021. The median real GDP growth estimate for 2021 is 3.4%, slightly less than the 3.6% forecasted in the October survey.” “NABE panelists have become more optimistic, on balance, with nearly one-third revising their outlook higher based on recent news of effective vaccines,” added Survey Chair Holly Wade, executive director, NFIB Research Center. “Seventy-three percent of panelists believe that the economy will have returned to pre-pandemic GDP levels by the second half of 2021, 18% expect it to reach that level in the first half of 2022, and 10% believe it will occur in the second half of 2022 or later. The 73% is a dramatic improvement from the October survey in which 38% of panelists believed that a full recovery would occur before 2022. “Just over one-third of respondents anticipate more downside risk to economic growth in 2021,” continued Wade. “Panelists point to a second wave of COVID-19 cases as their main concern.”

The National Association for Business Economics (NABE) released its October Outlook Survey which is summarized as follows: “The NABE Outlook panel sees a strong rebound in economic activity after the collapse experienced during the second quarter,” said NABE Vice President Manuel Balmaseda, CBE, chief economist, CEMEX. “The median forecast calls for a 25% annualized growth rate in the third quarter of 2020 for inflation-adjusted gross domestic product, or real GDP. That would reverse much of the 31% annualized decline from the second quarter. However, the panel has become less bullish about the fourth quarter of 2020, as well as 2021. The median real GDP growth estimate for 2021 is 3.6%, compared to a 4.8% forecast in the June survey.”

“NABE panelists have become more optimistic, on balance, but remain concerned about a potential second wave of COVID-19,” added Outlook Survey Chair Eugenio Aleman, economist, Wells Fargo Bank. “Thirty-eight percent of panelists believe that the economy will have returned to pre-pandemic GDP levels by the second half of 2021, 32% expect it to reach that level in the first half of 2022, and 30% believe it will occur in the second half of 2022 or later.

“About half of the panelists put the odds of a double-dip recession at 20% or less,” continued Aleman. “In contrast, one out of eight panelists places those odds at 50% or higher.”

Other highlights from the survey:

The median forecast calls for the unemployment rate to average 8.4% in 2020, 2.5 percentage points lower than the median forecast in the previous survey. Panelists expect the unemployment rate to decline each quarter, averaging 6.8% in 2021, compared with the 8% previously forecasted. The unemployment rate averaged 3.7% in 2019.

Panelists look for business investment to drop sharply this year. Real nonresidential fixed investment is forecasted to decline 6%. Panelists anticipate real nonresidential fixed investment to rise only gradually in 2021, increasing 2.4%.

Survey respondents expect inflation—as measured by the GDP price index—to be significantly lower in 2020 and 2021 relative to 2019. Inflation is forecasted to be 1.0% in 2020 and 1.5% in 2021. The index increased 1.8% in 2019.

Panelists expect the consumer price index (CPI) to rise 1.2% in 2020, significantly lower than the actual 1.8% growth in consumer prices in 2019. The 2020 forecast median has increased since the June survey, when panelists saw CPI rising by 0.7%. The panel anticipates consumer price growth will pick up moving forward, with a 1.9% annual average gain in 2021.

Panelists expect corporate profits to contract by 11% in 2020. The median forecast calls for profits to increase by 8.5% in 2021.

Four out of ten panelists indicate that 5% of jobs will be permanently lost due to firms closing. More than half of the panel suggest between 10% and 20% of job losses will be permanent.

Thirty-eight percent of panelists believe that the economy will have returned to pre-pandemic GDP levels by the second half of 2021; only 2% suggest this will occur before the end of 2020, 12% believe GDP will recover in the first half of 2021, and 24% anticipate such a return in the second half of 2021. Thirty-two percent of respondents expect GDP to reach pre-pandemic levels in the first half of 2022, and 22% believe it will occur in the second half of 2022.

For a more in-depth review and analysis of the economy, please see our mini-book on economic analysis and forecasting entitled: Simple and Effective Economic Forecasting.

NABE October Business Conditions Survey

“The October NABE Business Conditions Survey shows that firms are continuing to gain ground since the sharp economic downturn experienced in the first half of the year,” said NABE President Manuel Balmaseda, CBE, chief economist, CEMEX. “This momentum is expected to continue through the rest of 2020. In addition, more respondents than in the July survey anticipate stronger growth in inflation-adjusted gross domestic product over the next year.”  “More respondents in this survey report continued improvements, especially in sales and profit margins, at their firms during the past three months than in the July survey,” added NABE Business Conditions Survey Chair Holly Wade, executive director, NFIB Research Center. “Capital spending is also picking up steam, with more firms investing in their businesses over the past three months, and more planning to do the same in the next three months. “The employment picture is less rosy, with many firms still holding back on wage and staff increases,” continued Wade. “While slightly more respondents report an increase in employment at their firms over the last three months than in the previous survey, more also report a decrease in employment. Most firms are also forgoing raises to control costs with 70% of respondents’ firms reporting unchanged wages and salaries over the last two quarters, the highest reading since January 2014.”

Higlights

• The panel’s consensus outlook for the U.S. economy, measured by year-over-year growth in inflation-adjusted gross domestic product (real GDP), continued to improve in October compared to that in the two previous surveys. Eighty-nine percent of panelists expect real GDP to increase from the third quarter (Q3) of 2020 to Q3 2021. Only 9% of respondents expect the real GDP change to be zero or negative, compared to 31% of respondents who held this view in the July survey when asked about the outlook for the 12 months ending Q2 2021.

• For the first time since April 2019, a majority of respondents’ firms reports increased sales at their firms, with 52% indicating rising sales during Q3. The Net Rising Index (NRI) for sales—the percentage of panelists reporting rising sales minus the percentage reporting falling sales—surged upward, increasing 47 points to 33, up from -14 in July. The forward-looking NRI for anticipated sales over the next three months also rose, adding to the sharp increase reported in the July survey. The NRI for anticipated sales increased 13 points, from 18 in July to 31, with positive readings in three of the four industry sectors.

• Profit-margin increases were more widespread in Q3 2020, but remained less prevalent than decreases among respondents’ firms, with the NRI for profit margins increasing 21 points to -4. The share of respondents reporting rising profit margins increased from 15% in July to 21% in October, while the percentage reporting falling margins declined 15 percentage points—from 40% in July to 25% in October.

• The NRI for prices charged returned to neutral in October—registering +1—following the sharp decline during the first half of 2020, that brought the NRI in July to its lowest level since 1987. NRIs by sector, however, vary significantly. The NRI for goods-producing firms is 21, after registering -40 in July. But the index for finance, insurance, real estate (FIRE) sector firms remains negative with an NRI of -19. Between these extremes are the NRI for services, with a reading of 3, and the NRI of 8 for the transportation, utilities, information, communications (TUIC) sector. The share of respondents expecting price increases in the next three months rebounded from levels in the previous two surveys to 26% in October, resulting in an NRI of 20. Six percent anticipate falling prices in the next three months.

• The NRI for materials costs also rebounded from two quarters of negative readings to a reading of 10. All sectors registered positive NRIs, led by goods-producers at 15, bouncing back from -56 in July. The NRI for expected costs rose modestly, from 1 to 8, having been as low as -21 in April.

• Hiring at respondents’ firms remains depressed. The third-quarter NRI for employment levels over the last three months is -17, compared to -19 in the July survey. Even as the NRI improved, the share of respondents indicating there was decline in employment at their firms rose to 27% from 24% in the July survey. At the same time, 9% report employment increases at their firms, compared to 5% in July. The outlook for employment deteriorated in Q3, as the NRI for hiring expectations declined to just 1, down from 6 in the July survey. Respondents from the goods-producing and TUIC sectors expect their firms will add jobs in the next three months. In the July survey, three of the four sectors had positive NRIs for expected employment change in Q3 2020.

• The NRI for wages and salaries rebounded 13 points to 4 in the October survey. The upward movement in the index reflects an increase to 17% from 11% in July in the share of respondents citing rising wages, and a decrease to 13% from 19% in the share reporting falling wages. The forward-looking NRI for wages and salaries moved from 0 in July to 15 in October.

• Almost two-thirds of respondents report no shortages of inputs in Q3 2020, similar to results from the July survey. The share of respondents reporting shortages is virtually unchanged in the current survey across all inputs, except for a decline in the percentage indicating intermediate input shortages.

• The NRI for capital spending improved, from -19 in July to -8 in October. Fewer respondents report continuing declines in spending, while more indicate their firms’ capital spending increased during Q3 2020. However, service-sector panelists report not much improvement from the prior two readings. The forward-looking NRI for capital spending rose considerably, from -40 in April to 6 in October, as fewer respondents expect declines in spending over the next 3 months.

• In response to COVID-19, businesses continue to adjust employee headcount and wages. Imposing a hiring freeze is the most common response, cited by 69% of respondents.

• Respondents’ near-term outlook improved slightly in October compared to that in the July survey. Thirty-six percent of respondents report a “Better” near-term in October, compared to 34% in July. Only 8% indicate their near-term outlook is “Worse” in October, compared to 12% in July.

• Twenty-three percent of respondents report that sales at their companies are at “more than 100% of pre-crisis level,” an increase from the 15% in the July survey.

• Thirty-one percent of respondents expect sales to return to normal “sometime in 2021,” while 24% do not expect sales to return to normal until sometime in 2022. Only 10% expect sales to return to normal by the end of 2020.

• Only 3% of respondents report that their firms applied, or are planning to apply, for Main Street Lending programs.

• Thirty-five percent of respondents indicate their firms have implemented new work-at-home policies, allowing “all employees” to work from home during the pandemic. Another 33% allow “most employees” to work from home, while 16% only allow “some employees” to work from home.

• Thirty-one percent of respondents report that their firms will wait for “progress regarding COVID-19” before changing their work-from-home policies. Twenty-two percent indicate their companies will wait until the second half of 2021, while 16% of firms plan to suspend work-from-home policies in the first half of 2021.

Stock Market Valuations

Our estimates of the market valuations for two stock market indices, the Dow Jones Industrial Average (DJIA) and the Standard & Poor’s 500 (S&P 500), can be found in the file below:

Conclusion

During this time of global flux due to the coronavirus, I am leaving the Conclusion discussion below the same as was posted on March 23, 2020. The March 23, 2020 discussion still adequately reflects my thinking on the current state of affairs.

Important Note: While I don’t believe it is time to jump back into the stock market in a big way because of the market’s overvaluation, I have been advising the last few of weeks in this Commentary and in my weekly podcast, Intrinsic Value Wealth Report Radio, that investors can continue building their investment portfolios by selecting individual securities that offer growth and value opportunities.

Reprinted from March 23, 2020

Up until the past week, the economy had been in a stable but somewhat vulnerable state. Nonetheless, it had remained fairly strong. In fact, robust consumer spending and strong labor market conditions had given us confidence that the economy, which had been in its tenth year of expansion, could continue to grow. But we were cautious on this outlook. There were several reasons for our caution. U.S. business growth had been mixed. And global economic growth had been mixed as well. The new coronavirus was becoming a global economic threat, although it was still too early to tell how much of an effect it would ultimately have. Debt is at high levels for consumers, businesses, and government (at all levels of government). Finally, this is an election year that will likely have significant consequences either positively or negatively depending on the outcome of the elections. And of course, it is still too early to tell what the outcome of the elections will be.

In just a few days, the coronavirus’s effect on the economy and the markets went from a ripple to a tsunami. Businesses are shuttering, events are being cancelled or postponed, grocery store shelves are empty, and people are being asked or ordered to stay home. The markets are now deep in bear market territory. The effects on the economy, even given the short time that the economy has been retreating, may be with us for a long time. There is now a much greater risk of a recession, and there has even been some talk of a depression. The government, the Fed, Republicans, and Democrats, and pretty much the entire country, is trying to get the virus under control and is coming up with plans to mitigate the long-term economic effects caused by the virus. But the virus has impacted the economy – in a significant way – in just a short time. How long lasting the effects will be no one can tell right now. The economy has been largely shut down and remains so today. It takes time to restart the economy after a situation such as what is occurring at the present time.

Given these events and the rapidly deteriorating situation, as I said last week, I would caution not to panic. The economy and the markets will get better. The situation is bad – there is no doubt about that – but it will turn around. The real question is when will it turn around? No one knows that at the present time. But it will turn around.

For now, review your investment portfolios. It is highly likely that all or most of your stocks are down. You should not consider selling the bulk of your stocks – only consider selling companies that are not sound companies. But do recognize that as the economy deteriorates, even good companies will be affected.

For stock market value hunters, we believe it is still too early to jump back in. We will be closely monitoring the markets using the many tools and models that we have developed over the years to assess the economy and the markets. We will use our best judgement and thoughts to let you know when we believe things are turning around. The turnaround hasn’t happened yet.

We believe it is important to maintain a long-term view toward investing. But for now, just sit tight. Eventually, this means that you should continue building your investment portfolio using the Cassandra Stock Selection Model to select individual securities that offer growth and value opportunities.

Chart for Review and Thought

Existing Home Sales

Simple and Effective Economic Forecasting Model

Note: The table and chart below have not been updated. However, we believe that a recession is quite likely. In the chart below, the bottom green line shows what a recession could look like.

Notes (GDP Growth Chart):

  1. See the July 8, 2019 Commentary for an introduction to this model.
  2. Actual numbers 2007 through 2019; forecasted numbers thereafter.
  3. Normal GDP growth is typically in the 2% to 3% range.
  4. A recession is generally defined as two consecutive quarters of negative economic growth as measured by a country’s gross domestic product (GDP).

Thought for the Week

“The long, long bull market since 2009 has finally matured into a fully-fledged epic bubble. Featuring extreme overvaluation, explosive price increases, frenzied issuance, and hysterically speculative investor behavior, I believe this event will be recorded as one of the great bubbles of financial history, right along with the South Sea bubble, 1929, and 2000.” ~ Jeremy Grantham, Waiting for the Last Dance, January 5, 2021

Announcements

The Intrinsic Value Wealth Report has started a new YouTube channel called Intrinsic Value Wealth Report TV. You can view the YouTube channel at Intrinsic Value Wealth Report TV.

The Intrinsic Value Wealth Report has started a new podcast called Intrinsic Value Wealth Report Radio. You can listen to the podcast at Intrinsic Value Wealth Report Radio.

Dr. Wendee spoke at the Investment Club of America’s annual economic summit, called Econosummit, on Sunday March 1, 2020 in Las Vegas.

Dr. Wendee attended the The National Due Diligence Alliance (TNDDA) investment banking conference, which was held March 6-8, 2020 at the Four Seasons Resort in Dallas, Texas. This is a conference held several times throughout the year for investment bankers and registered investment advisers to learn about new opportunities in the Alternative Investment asset classes.

TNDDA Meeting in Dallas, Texas

We have been researching the use of crowdsourcing for investment ideas. We will be sending a survey out in the next few weeks to get your input on the economy and the markets; and to get any investment ideas that you would like to share. We will compile this input and distribute the results to you and our other subscribers. We have been testing our crowdsourcing models with students and have been having good success and results.

Dr. Wendee has been researching and writing a new theory of economics known as, The Value Creation Theory of the Economy (also known as, Intrinsinomics). The full paper on Intrinsinomics will be published in the near future.

Finance 3350: Personal Finance-Portfolio & Risk Management– Dr. Wendee taught teaching Finance 3350 – Portfolio & Risk Management at California State University, Los Angeles (CSULA) for the Summer term starting May 2020. Dr. Wendee teaches courses in Management and Finance at CSULA.

Business 548: Strategy and Decision Making – Dr. Wendee taught Business 548 – Strategy and Decision Making at California Baptist University (CBU) starting at the end of June 2020. Dr. Wendee teaches courses in Finance, Business, Strategy & Decision Making, and Economics at CBU.

Business 303: Business Finance – Dr. Wendee taught Business 303 – Business Finance at California Baptist University (CBU) starting at the end of August 2020. Dr. Wendee teaches courses in Finance, Business, Strategy & Decision Making, and Economics at CBU.

Business 539: Financial Management – Dr. Wendee is teaching Business 539 – Financial Management at California Baptist University (CBU) which started at the end of October. Dr. Wendee teaches courses in Finance, Business, Strategy & Decision Making, and Economics at CBU.

Business 217: Microeconomics – Dr. Wendee is teaching Business 217 – Microeconomics at California Baptist University (CBU) which started in January 2021. Dr. Wendee teaches courses in Finance, Business, Strategy & Decision Making, and Economics at CBU.

Business 218: Macroeconomics – Dr. Wendee is teaching Business 218 – Macroeconomics at California Baptist University (CBU) which started in January 2021. Dr. Wendee teaches courses in Finance, Business, Strategy & Decision Making, and Economics at CBU.

Finance 430: Risk Management – Dr. Wendee is teaching Finance 430 – Risk Management at California Baptist University (CBU) which started in January 2021. Dr. Wendee teaches courses in Finance, Business, Strategy & Decision Making, and Economics at CBU.

Dr. Wendee presented a paper on his new theory of economics known as, The Value Creation Theory of the Economy (also known as, Intrinsinomics), at the International Leadership Association’s annual global conference which was held in Ottawa, Canada last Fall.

Dr. Wendee presented an updated paper on his new theory of economics known as, The Value Creation Theory of the Economy (also known as, Intrinsinomics), at the International Leadership Association’s annual global conference which was to have been held in San Francisco, California in November, but which was held virtually instead due to the Coronavirus.

Dr. Wendee delivered a talk entitled: Using Alternative Assets to Increase Portfolio Returns and Decrease Risk at the BrightTalk Q4 2020 Outlook Summit on October 28, 2020. You can access additional information on the summit and Dr. Wendee’s presentation here.

Dr. Wendee delivered a talk  at the BrightTalk conference on December 9, 2020 entitled: Emerging Themes and Great Places to Invest for 2021. You can access additional information on the summit and Dr. Wendee’s presentation here.

Dr. Wendee delivered a talk  at the BrightTalk conference on January 20, 2021 entitled: Developing an Income-Producing Strategy for 2021 and Beyond. You can access additional information on the summit and Dr. Wendee’s presentation here.

Dr. Wendee is working on a financial planning modeling program which will be available in the near future. The modeling program is designed to assist anyone in creating a financial plan and is customizable for each person’s unique financial planning goals. A working draft of the model is currently in beta test with students. Click this link, schematic, to go to the clickable document under the subheading Financial Planning Process (Draft) in the Intrinsic Value Wealth Report to see a draft of the schematic for the new financial planning process.

Dr. Wendee has been developing an econometric model specifically designed to monitor and forecast the global economy as this current economic crisis unfolds. This new econometric model is based on other econometric models that he has designed and have used for many years. You can find some of these earlier models in Book # 6 – Simple and Effective Economic Forecasting in the sister website to this website which is called the Intrinsic Value Wealth Report. The new econometric model has been constructed with some additional tools and methods that he has learned and some that he has developed over the last several years. He will be talking more about this new econometric model in this Commentary over the next few months. His comments and forecasts on the economy and the markets going forward will be based to a significant extent on this new model.

We have begun raising capital for our fund-of-funds investment, Northwest Quadrant Opportunity Fund, LLC. The fund engineers and constructs an investment vehicle consisting of Alternative Asset investments. The fund’s objective is to build a diversified portfolio of strong, solid, steady- performing assets, with highly qualified asset managers who have proven track records that meet our underwriting requirements. To learn more about the Northwest Quadrant Opportunity Fund, LLC and to obtain an offering memorandum, please click Northwest Quadrant Opportunity Fund, LLC.

Intrinsic Value Wealth Creation pyramid

We always conclude our commentary with a discussion of the Intrinsic Value Wealth Creation Pyramid. The Intrinsic Value Wealth Creation Pyramid is designed to show some of the major categories for building wealth. It is the result of many years of study of the wealth building process; experience working with clients who have built considerable wealth; and my own personal experience building wealth. Newsletter subscribers should consult the Intrinsic Value Wealth Creation Pyramid as one of many useful investment tools while considering their investment plans.

The chart in this section is an expanded version of the Intrinsic Value Wealth Creation Pyramid Chart referenced in the Forbes.com article entitled, Nine of the Best Ways to Build Wealth.

RESOURCES

See our Resources section for links to economic and other resources used in the preparation of this Commentary.

Posted in Economic & Business Chart Room, Economic Outlook, Entrepreneurship, Focus List, Investment Recommendations, Investments, Notes From The Field, Special Situations, Uncategorized, VDI/REEP, Visionary Ideas | Tagged , , , , , , , , , , , , , , , , , , , , , , , , , , , , , , , , , | Comments Off on WEEKLY COMMENTARY January 26, 2021

WEEKLY COMMENTARY January 19, 2021

Developing an Income-Producing Strategy for 2021 and Beyond

I will be giving a presentation for BrightTalk on January 20, 2021 on the subject of income investing with the title: Developing an Income-Producing Strategy for 2021 and Beyond. You can watch this presentation by registering here.

To begin with, I want to emphasize that investment should always be done in the context of an overall financial plan. No investing, including investing for income, should be done in isolation. Furthermore, it should be noted that the great places to invest for 2021 are the same as they were for 2020, and 2019, and before; and they are the same as they will be in 2022, 2023, and so on into the future. The point is to follow a long-term investment plan that is constructed from sound financial planning and to stay with that plan, making well-thought-out changes as necessary. The Intrinsic Value Wealth Creation Pyramid serves as the foundation for the financial and investment plans. The Intrinsic Value Wealth Creation Pyramid is included at the end of each week’s Commentary so that it is easily accessible and referenced.

Having laid this groundwork, let’s look at developing an income-producing strategy. A recent Barron’s article (Bary, 2021) discussed twelve income investments for 2021 (you can reference this article for more details):

  • Energy pipelines
  • U.S. dividend stocks
  • Overseas dividend stocks
  • Electric Utilities
  • Real estate investment trusts (REITs)
  • Telecommunications
  • Convertibles
  • Junk bonds
  • Tax-exempt municipals
  • Taxable municipals
  • Preferred stocks
  • Treasuries

We have begun raising capital for our fund-of-funds investment, Northwest Quadrant Opportunity Fund, LLC. The fund engineers and constructs an investment vehicle consisting of Alternative Asset investments. The fund’s objective is to build a diversified portfolio of strong, solid, steady- performing assets, with highly qualified asset managers who have proven track records that meet our underwriting requirements. Many of these assets are also good income investments. The following is a listing of some of these assets. Click Northwest Quadrant Opportunity Fund, LLC to learn more about the fund and its investments.

  • Real estate of various types (e.g., multi-family, hotels, single family homes, and other real estate investments)
  • Private equity
  • Notes
  • Mobile home parks
  • Convertible bonds
  • Shipping solutions (e.g., containers and barges)
  • Deep-discounted private investments sold on the secondary market
  • Pre-IPO companies
  • Special situation investments
  • Billboards
  • Cell towers
  • Energy
  • Commodity futures
  • High-yield bonds
  • Emerging technologies
  • Manufactured homes
  • Mortgages
  • Roll-ups
  • Self-storage facilities
  • Special purpose acquisition companies (SPACs)
  • Angel investments
  • Tax liens
  • Opportunity zones
  • Real estate investment trusts (REITs).

Two additional sources of income investments are:

References

Bary, A. (2021). Yield Plays. Barron’s. New York, Dow Jones & Co., January 4, 2021

Economic and Investment Highlights

Last Week

Silicon Valley’s moves to remove Trump from social media are a new display of power challenging free speech. Apple and Amazon halted support of social-media service Parler, a platform that had become popular with conservatives, in another blow to freedom of speech. Facebook said it will remove comments that mention “stop the steal,” a phrase popular with Trump supporters.

House Democrats introduced an article of impeachment against Trump. Pence rejected calls to invoke the 25th Amendment to oust Trump. The House voted to impeach Trump.

Thousands of National Guard troops were ordered to Washington to prevent violence following the attack on the U.S. Capitol last week.

Municipal bond issuance in 2020 was the highest in a decade as municipalities struggle.

Oil prices are extending a recovery in 2021.

The federal budget gap widened in the first three months of the fiscal year.

Initial jobless claims posted their biggest weekly gains since the pandemic started in March.

Fed Chairman Powell warned that the job market has a long way to go before it is strong again.

Biden plans a $1.9 trillion coronavirus relief plan.

China’s exports rose to their highest level on record last year.

Retail sales fell in December, the third straight month of declines.

The Dow, the S&P 500, and the Nasdaq all declined for the week. The Dow was down 0.9%; the S&P 500 was down 1.5%; and the Nasdaq was down 1.5%. The 10-year treasury yield ended the week at 1.097%. Gold closed at $1,829.30 for the week. Oil closed at $52.36 for the week.

The Week Ahead

This link takes you to Econoday’s Economic Calendar and Economic Events and Analysis which shows the upcoming economic reporting events scheduled in the week and months ahead.

Summary

Note: The models below may not capture the impact of COVID-19 beyond their impact on GDP source data and relevant economic reports that have already been released. They may not anticipate the impact of COVID-19 on forthcoming economic reports beyond the standard internal dynamics of the models.

Note: The comments that follow are derived from the economic indicators referenced in the Resources section of this newsletter and other sources in this report.

The Aruoba-Diebold-Scotti Business Conditions Index (ALS) had been trending up for several weeks from having dipped in 2019. Recently with the advent of the economic collapse, the index crashed. It has now been generally trending down again, but fluctuating within a narrow band. This is a slightly positive indicator for the economy on a short-term basis.

The GDPNow model estimate for real GDP growth (seasonally adjusted annual rate) in the fourth quarter of 2020 is 7.4 percent. This reading agrees with the ALS model assessment of an improving short-term economic environment.

The New York Fed Staff Nowcast stands at 2.5 percent for 2020:Q4.

The Chicago Fed National Activity Index (CFNAI) showed an increase in economic activity in October. The Chicago Fed National Activity Index (CFNAI) was  was +0.27 in November, down from +1.01 in October.

All told, these short-term economic indicators are a mixed analysis for the economy, at least on a short-term basis.

Expectations that stock prices will rise over the next six months is now at 45.2% in a recent AAII Sentiment Survey. The historical average is 38.0% for the survey. 23.1% of the investors in the survey described their short-term outlook as neutral and 31.7% were bearish. Please see the AAII Sentiment Survey for the complete results.

The latest Gross Output (GO) reading (July 6, 2020) showed that Gross Output slowed significantly in the first quarter of 2020.

Advisor Perspectives publishes a monthly market valuation update.

Advisor Perspectives has market valuation and other useful and interesting investment information at this website.

Fourth Quarter 2020 Survey of Professional Forecasters

[Release Date: November 16, 2020] The outlook for real GDP growth in the next few quarters looks weaker now than it did three months ago, according to 37 forecasters surveyed by the Federal Reserve Bank of Philadelphia. The forecasters predict the economy will expand at an annual rate of 4.0 percent this quarter, lower than the prediction of 5.8 percent from the previous survey. On an annual-average over annual-average basis, the forecasters expect real GDP to decrease 3.5 percent this year but to recover and grow at an annual rate of between 2.1 percent to 4.0 percent over each of the following three years.

A downward revision to the projection for the unemployment rate accompanies the outlook for growth. The forecasters predict unemployment will decrease from a projected 7.0 percent this quarter to 5.8 percent in the fourth quarter of 2021. The prediction for the current-quarter unemployment rate is 2.5 percentage points lower than that of the last survey. On an annual-average basis, the panelists predict the unemployment rate will decline from a projected 8.2 percent in 2020 to 4.6 percent in 2023.

On the employment front, the forecasters expect job gains in the current quarter at a rate of 689,800 per month. The employment projections for the current and the following three quarters show upward revisions from those of the previous survey. The projections for the annual-average level of nonfarm payroll employment suggest job losses at a monthly rate of 718,000 in 2020 and job gains at a monthly rate of 321,600 in 2021. (These annual-average estimates are computed as the year-to-year change in the annual-average level of nonfarm payroll employment, converted to a monthly rate.) 

The next survey will be released on February 12, 2021

NABE Surveys

NABE Outlook Survey – December 2020

SUMMARY: “The NABE [National Association for Business Economics] Outlook panel anticipates more moderate growth in economic activity going forward after the sharp rebound during the third quarter,” said NABE President Manuel Balmaseda, CBE, chief economist, CEMEX. “The median forecast calls for a 4.1% annualized growth rate in the fourth quarter of 2020 for inflation-adjusted gross domestic product, or real GDP. In addition to the 33.1% GDP growth in the third quarter of the year, this would reverse much of the 32% annualized decline from the second quarter. However, the panel has become slightly less bullish about 2021. The median real GDP growth estimate for 2021 is 3.4%, slightly less than the 3.6% forecasted in the October survey.” “NABE panelists have become more optimistic, on balance, with nearly one-third revising their outlook higher based on recent news of effective vaccines,” added Survey Chair Holly Wade, executive director, NFIB Research Center. “Seventy-three percent of panelists believe that the economy will have returned to pre-pandemic GDP levels by the second half of 2021, 18% expect it to reach that level in the first half of 2022, and 10% believe it will occur in the second half of 2022 or later. The 73% is a dramatic improvement from the October survey in which 38% of panelists believed that a full recovery would occur before 2022. “Just over one-third of respondents anticipate more downside risk to economic growth in 2021,” continued Wade. “Panelists point to a second wave of COVID-19 cases as their main concern.”

The National Association for Business Economics (NABE) released its October Outlook Survey which is summarized as follows: “The NABE Outlook panel sees a strong rebound in economic activity after the collapse experienced during the second quarter,” said NABE Vice President Manuel Balmaseda, CBE, chief economist, CEMEX. “The median forecast calls for a 25% annualized growth rate in the third quarter of 2020 for inflation-adjusted gross domestic product, or real GDP. That would reverse much of the 31% annualized decline from the second quarter. However, the panel has become less bullish about the fourth quarter of 2020, as well as 2021. The median real GDP growth estimate for 2021 is 3.6%, compared to a 4.8% forecast in the June survey.”

“NABE panelists have become more optimistic, on balance, but remain concerned about a potential second wave of COVID-19,” added Outlook Survey Chair Eugenio Aleman, economist, Wells Fargo Bank. “Thirty-eight percent of panelists believe that the economy will have returned to pre-pandemic GDP levels by the second half of 2021, 32% expect it to reach that level in the first half of 2022, and 30% believe it will occur in the second half of 2022 or later.

“About half of the panelists put the odds of a double-dip recession at 20% or less,” continued Aleman. “In contrast, one out of eight panelists places those odds at 50% or higher.”

Other highlights from the survey:

The median forecast calls for the unemployment rate to average 8.4% in 2020, 2.5 percentage points lower than the median forecast in the previous survey. Panelists expect the unemployment rate to decline each quarter, averaging 6.8% in 2021, compared with the 8% previously forecasted. The unemployment rate averaged 3.7% in 2019.

Panelists look for business investment to drop sharply this year. Real nonresidential fixed investment is forecasted to decline 6%. Panelists anticipate real nonresidential fixed investment to rise only gradually in 2021, increasing 2.4%.

Survey respondents expect inflation—as measured by the GDP price index—to be significantly lower in 2020 and 2021 relative to 2019. Inflation is forecasted to be 1.0% in 2020 and 1.5% in 2021. The index increased 1.8% in 2019.

Panelists expect the consumer price index (CPI) to rise 1.2% in 2020, significantly lower than the actual 1.8% growth in consumer prices in 2019. The 2020 forecast median has increased since the June survey, when panelists saw CPI rising by 0.7%. The panel anticipates consumer price growth will pick up moving forward, with a 1.9% annual average gain in 2021.

Panelists expect corporate profits to contract by 11% in 2020. The median forecast calls for profits to increase by 8.5% in 2021.

Four out of ten panelists indicate that 5% of jobs will be permanently lost due to firms closing. More than half of the panel suggest between 10% and 20% of job losses will be permanent.

Thirty-eight percent of panelists believe that the economy will have returned to pre-pandemic GDP levels by the second half of 2021; only 2% suggest this will occur before the end of 2020, 12% believe GDP will recover in the first half of 2021, and 24% anticipate such a return in the second half of 2021. Thirty-two percent of respondents expect GDP to reach pre-pandemic levels in the first half of 2022, and 22% believe it will occur in the second half of 2022.

For a more in-depth review and analysis of the economy, please see our mini-book on economic analysis and forecasting entitled: Simple and Effective Economic Forecasting.

NABE October Business Conditions Survey

“The October NABE Business Conditions Survey shows that firms are continuing to gain ground since the sharp economic downturn experienced in the first half of the year,” said NABE President Manuel Balmaseda, CBE, chief economist, CEMEX. “This momentum is expected to continue through the rest of 2020. In addition, more respondents than in the July survey anticipate stronger growth in inflation-adjusted gross domestic product over the next year.”  “More respondents in this survey report continued improvements, especially in sales and profit margins, at their firms during the past three months than in the July survey,” added NABE Business Conditions Survey Chair Holly Wade, executive director, NFIB Research Center. “Capital spending is also picking up steam, with more firms investing in their businesses over the past three months, and more planning to do the same in the next three months. “The employment picture is less rosy, with many firms still holding back on wage and staff increases,” continued Wade. “While slightly more respondents report an increase in employment at their firms over the last three months than in the previous survey, more also report a decrease in employment. Most firms are also forgoing raises to control costs with 70% of respondents’ firms reporting unchanged wages and salaries over the last two quarters, the highest reading since January 2014.”

Higlights

• The panel’s consensus outlook for the U.S. economy, measured by year-over-year growth in inflation-adjusted gross domestic product (real GDP), continued to improve in October compared to that in the two previous surveys. Eighty-nine percent of panelists expect real GDP to increase from the third quarter (Q3) of 2020 to Q3 2021. Only 9% of respondents expect the real GDP change to be zero or negative, compared to 31% of respondents who held this view in the July survey when asked about the outlook for the 12 months ending Q2 2021.

• For the first time since April 2019, a majority of respondents’ firms reports increased sales at their firms, with 52% indicating rising sales during Q3. The Net Rising Index (NRI) for sales—the percentage of panelists reporting rising sales minus the percentage reporting falling sales—surged upward, increasing 47 points to 33, up from -14 in July. The forward-looking NRI for anticipated sales over the next three months also rose, adding to the sharp increase reported in the July survey. The NRI for anticipated sales increased 13 points, from 18 in July to 31, with positive readings in three of the four industry sectors.

• Profit-margin increases were more widespread in Q3 2020, but remained less prevalent than decreases among respondents’ firms, with the NRI for profit margins increasing 21 points to -4. The share of respondents reporting rising profit margins increased from 15% in July to 21% in October, while the percentage reporting falling margins declined 15 percentage points—from 40% in July to 25% in October.

• The NRI for prices charged returned to neutral in October—registering +1—following the sharp decline during the first half of 2020, that brought the NRI in July to its lowest level since 1987. NRIs by sector, however, vary significantly. The NRI for goods-producing firms is 21, after registering -40 in July. But the index for finance, insurance, real estate (FIRE) sector firms remains negative with an NRI of -19. Between these extremes are the NRI for services, with a reading of 3, and the NRI of 8 for the transportation, utilities, information, communications (TUIC) sector. The share of respondents expecting price increases in the next three months rebounded from levels in the previous two surveys to 26% in October, resulting in an NRI of 20. Six percent anticipate falling prices in the next three months.

• The NRI for materials costs also rebounded from two quarters of negative readings to a reading of 10. All sectors registered positive NRIs, led by goods-producers at 15, bouncing back from -56 in July. The NRI for expected costs rose modestly, from 1 to 8, having been as low as -21 in April.

• Hiring at respondents’ firms remains depressed. The third-quarter NRI for employment levels over the last three months is -17, compared to -19 in the July survey. Even as the NRI improved, the share of respondents indicating there was decline in employment at their firms rose to 27% from 24% in the July survey. At the same time, 9% report employment increases at their firms, compared to 5% in July. The outlook for employment deteriorated in Q3, as the NRI for hiring expectations declined to just 1, down from 6 in the July survey. Respondents from the goods-producing and TUIC sectors expect their firms will add jobs in the next three months. In the July survey, three of the four sectors had positive NRIs for expected employment change in Q3 2020.

• The NRI for wages and salaries rebounded 13 points to 4 in the October survey. The upward movement in the index reflects an increase to 17% from 11% in July in the share of respondents citing rising wages, and a decrease to 13% from 19% in the share reporting falling wages. The forward-looking NRI for wages and salaries moved from 0 in July to 15 in October.

• Almost two-thirds of respondents report no shortages of inputs in Q3 2020, similar to results from the July survey. The share of respondents reporting shortages is virtually unchanged in the current survey across all inputs, except for a decline in the percentage indicating intermediate input shortages.

• The NRI for capital spending improved, from -19 in July to -8 in October. Fewer respondents report continuing declines in spending, while more indicate their firms’ capital spending increased during Q3 2020. However, service-sector panelists report not much improvement from the prior two readings. The forward-looking NRI for capital spending rose considerably, from -40 in April to 6 in October, as fewer respondents expect declines in spending over the next 3 months.

• In response to COVID-19, businesses continue to adjust employee headcount and wages. Imposing a hiring freeze is the most common response, cited by 69% of respondents.

• Respondents’ near-term outlook improved slightly in October compared to that in the July survey. Thirty-six percent of respondents report a “Better” near-term in October, compared to 34% in July. Only 8% indicate their near-term outlook is “Worse” in October, compared to 12% in July.

• Twenty-three percent of respondents report that sales at their companies are at “more than 100% of pre-crisis level,” an increase from the 15% in the July survey.

• Thirty-one percent of respondents expect sales to return to normal “sometime in 2021,” while 24% do not expect sales to return to normal until sometime in 2022. Only 10% expect sales to return to normal by the end of 2020.

• Only 3% of respondents report that their firms applied, or are planning to apply, for Main Street Lending programs.

• Thirty-five percent of respondents indicate their firms have implemented new work-at-home policies, allowing “all employees” to work from home during the pandemic. Another 33% allow “most employees” to work from home, while 16% only allow “some employees” to work from home.

• Thirty-one percent of respondents report that their firms will wait for “progress regarding COVID-19” before changing their work-from-home policies. Twenty-two percent indicate their companies will wait until the second half of 2021, while 16% of firms plan to suspend work-from-home policies in the first half of 2021.

Stock Market Valuations

Our estimates of the market valuations for two stock market indices, the Dow Jones Industrial Average (DJIA) and the Standard & Poor’s 500 (S&P 500), can be found in the file below:

Conclusion

During this time of global flux due to the coronavirus, I am leaving the Conclusion discussion below the same as was posted on March 23, 2020. The March 23, 2020 discussion still adequately reflects my thinking on the current state of affairs.

Important Note: While I don’t believe it is time to jump back into the stock market in a big way because of the market’s overvaluation, I have been advising the last few of weeks in this Commentary and in my weekly podcast, Intrinsic Value Wealth Report Radio, that investors can continue building their investment portfolios by selecting individual securities that offer growth and value opportunities.

Reprinted from March 23, 2020

Up until the past week, the economy had been in a stable but somewhat vulnerable state. Nonetheless, it had remained fairly strong. In fact, robust consumer spending and strong labor market conditions had given us confidence that the economy, which had been in its tenth year of expansion, could continue to grow. But we were cautious on this outlook. There were several reasons for our caution. U.S. business growth had been mixed. And global economic growth had been mixed as well. The new coronavirus was becoming a global economic threat, although it was still too early to tell how much of an effect it would ultimately have. Debt is at high levels for consumers, businesses, and government (at all levels of government). Finally, this is an election year that will likely have significant consequences either positively or negatively depending on the outcome of the elections. And of course, it is still too early to tell what the outcome of the elections will be.

In just a few days, the coronavirus’s effect on the economy and the markets went from a ripple to a tsunami. Businesses are shuttering, events are being cancelled or postponed, grocery store shelves are empty, and people are being asked or ordered to stay home. The markets are now deep in bear market territory. The effects on the economy, even given the short time that the economy has been retreating, may be with us for a long time. There is now a much greater risk of a recession, and there has even been some talk of a depression. The government, the Fed, Republicans, and Democrats, and pretty much the entire country, is trying to get the virus under control and is coming up with plans to mitigate the long-term economic effects caused by the virus. But the virus has impacted the economy – in a significant way – in just a short time. How long lasting the effects will be no one can tell right now. The economy has been largely shut down and remains so today. It takes time to restart the economy after a situation such as what is occurring at the present time.

Given these events and the rapidly deteriorating situation, as I said last week, I would caution not to panic. The economy and the markets will get better. The situation is bad – there is no doubt about that – but it will turn around. The real question is when will it turn around? No one knows that at the present time. But it will turn around.

For now, review your investment portfolios. It is highly likely that all or most of your stocks are down. You should not consider selling the bulk of your stocks – only consider selling companies that are not sound companies. But do recognize that as the economy deteriorates, even good companies will be affected.

For stock market value hunters, we believe it is still too early to jump back in. We will be closely monitoring the markets using the many tools and models that we have developed over the years to assess the economy and the markets. We will use our best judgement and thoughts to let you know when we believe things are turning around. The turnaround hasn’t happened yet.

We believe it is important to maintain a long-term view toward investing. But for now, just sit tight. Eventually, this means that you should continue building your investment portfolio using the Cassandra Stock Selection Model to select individual securities that offer growth and value opportunities.

Chart for Review and Thought

Federal Surplus or Deficit

Simple and Effective Economic Forecasting Model

Note: The table and chart below have not been updated. However, we believe that a recession is quite likely. In the chart below, the bottom green line shows what a recession could look like.

Notes (GDP Growth Chart):

  1. See the July 8, 2019 Commentary for an introduction to this model.
  2. Actual numbers 2007 through 2019; forecasted numbers thereafter.
  3. Normal GDP growth is typically in the 2% to 3% range.
  4. A recession is generally defined as two consecutive quarters of negative economic growth as measured by a country’s gross domestic product (GDP).

Thought for the Week

“Live as if you were to die tomorrow. Learn as if you were to live forever.” ~ Mahatma Gandhi

Announcements

The Intrinsic Value Wealth Report has started a new YouTube channel called Intrinsic Value Wealth Report TV. You can view the YouTube channel at Intrinsic Value Wealth Report TV.

The Intrinsic Value Wealth Report has started a new podcast called Intrinsic Value Wealth Report Radio. You can listen to the podcast at Intrinsic Value Wealth Report Radio.

Dr. Wendee spoke at the Investment Club of America’s annual economic summit, called Econosummit, on Sunday March 1, 2020 in Las Vegas.

Dr. Wendee attended the The National Due Diligence Alliance (TNDDA) investment banking conference, which was held March 6-8, 2020 at the Four Seasons Resort in Dallas, Texas. This is a conference held several times throughout the year for investment bankers and registered investment advisers to learn about new opportunities in the Alternative Investment asset classes.

TNDDA Meeting in Dallas, Texas

We have been researching the use of crowdsourcing for investment ideas. We will be sending a survey out in the next few weeks to get your input on the economy and the markets; and to get any investment ideas that you would like to share. We will compile this input and distribute the results to you and our other subscribers. We have been testing our crowdsourcing models with students and have been having good success and results.

Dr. Wendee has been researching and writing a new theory of economics known as, The Value Creation Theory of the Economy (also known as, Intrinsinomics). The full paper on Intrinsinomics will be published in the near future.

Finance 3350: Personal Finance-Portfolio & Risk Management– Dr. Wendee taught teaching Finance 3350 – Portfolio & Risk Management at California State University, Los Angeles (CSULA) for the Summer term starting May 2020. Dr. Wendee teaches courses in Management and Finance at CSULA.

Business 548: Strategy and Decision Making – Dr. Wendee taught Business 548 – Strategy and Decision Making at California Baptist University (CBU) starting at the end of June 2020. Dr. Wendee teaches courses in Finance, Business, Strategy & Decision Making, and Economics at CBU.

Business 303: Business Finance – Dr. Wendee taught Business 303 – Business Finance at California Baptist University (CBU) starting at the end of August 2020. Dr. Wendee teaches courses in Finance, Business, Strategy & Decision Making, and Economics at CBU.

Business 539: Financial Management – Dr. Wendee is teaching Business 539 – Financial Management at California Baptist University (CBU) which started at the end of October. Dr. Wendee teaches courses in Finance, Business, Strategy & Decision Making, and Economics at CBU.

Dr. Wendee presented a paper on his new theory of economics known as, The Value Creation Theory of the Economy (also known as, Intrinsinomics), at the International Leadership Association’s annual global conference which was held in Ottawa, Canada last Fall.

Dr. Wendee presented an updated paper on his new theory of economics known as, The Value Creation Theory of the Economy (also known as, Intrinsinomics), at the International Leadership Association’s annual global conference which was to have been held in San Francisco, California in November, but which was held virtually instead due to the Coronavirus.

Dr. Wendee delivered a talk entitled: Using Alternative Assets to Increase Portfolio Returns and Decrease Risk at the BrightTalk Q4 2020 Outlook Summit on October 28, 2020. You can access additional information on the summit and Dr. Wendee’s presentation here.

Dr. Wendee delivered a talk  at the BrightTalk conference on December 9, 2020 entitled: Emerging Themes and Great Places to Invest for 2021. You can access additional information on the summit and Dr. Wendee’s presentation here.

Dr. Wendee will be delivering a talk  at the BrightTalk conference on January 20, 2021 entitled: Developing an Income-Producing Strategy for 2021 and Beyond. You can access additional information on the summit and Dr. Wendee’s presentation here.

Dr. Wendee is working on a financial planning modeling program which will be available in the near future. The modeling program is designed to assist anyone in creating a financial plan and is customizable for each person’s unique financial planning goals. A working draft of the model is currently in beta test with students. Click this link, schematic, to go to the clickable document under the subheading Financial Planning Process (Draft) in the Intrinsic Value Wealth Report to see a draft of the schematic for the new financial planning process.

Dr. Wendee has been developing an econometric model specifically designed to monitor and forecast the global economy as this current economic crisis unfolds. This new econometric model is based on other econometric models that he has designed and have used for many years. You can find some of these earlier models in Book # 6 – Simple and Effective Economic Forecasting in the sister website to this website which is called the Intrinsic Value Wealth Report. The new econometric model has been constructed with some additional tools and methods that he has learned and some that he has developed over the last several years. He will be talking more about this new econometric model in this Commentary over the next few months. His comments and forecasts on the economy and the markets going forward will be based to a significant extent on this new model.

We have begun raising capital for our fund-of-funds investment, Northwest Quadrant Opportunity Fund, LLC. The fund engineers and constructs an investment vehicle consisting of Alternative Asset investments. The fund’s objective is to build a diversified portfolio of strong, solid, steady- performing assets, with highly qualified asset managers who have proven track records that meet our underwriting requirements. To learn more about the Northwest Quadrant Opportunity Fund, LLC and to obtain an offering memorandum, please click Northwest Quadrant Opportunity Fund, LLC.

Intrinsic Value Wealth Creation pyramid

We always conclude our commentary with a discussion of the Intrinsic Value Wealth Creation Pyramid. The Intrinsic Value Wealth Creation Pyramid is designed to show some of the major categories for building wealth. It is the result of many years of study of the wealth building process; experience working with clients who have built considerable wealth; and my own personal experience building wealth. Newsletter subscribers should consult the Intrinsic Value Wealth Creation Pyramid as one of many useful investment tools while considering their investment plans.

The chart in this section is an expanded version of the Intrinsic Value Wealth Creation Pyramid Chart referenced in the Forbes.com article entitled, Nine of the Best Ways to Build Wealth.

RESOURCES

See our Resources section for links to economic and other resources used in the preparation of this Commentary.

Posted in Economic & Business Chart Room, Economic Outlook, Entrepreneurship, Focus List, Investment Recommendations, Investments, Notes From The Field, Special Situations, Uncategorized, VDI/REEP, Visionary Ideas | Tagged , , , , , , , , , , , , , , , , , , , , , , , , , , , , , , , , , | Comments Off on WEEKLY COMMENTARY January 19, 2021

WEEKLY COMMENTARY January 12, 2021

Northwest Quadrant Opportunity Fund, LLC

We have begun raising capital for our fund-of-funds investment, Northwest Quadrant Opportunity Fund, LLC. The fund engineers and constructs an investment vehicle consisting of Alternative Asset investments. The fund’s objective is to build a diversified portfolio of strong, solid, steady- performing assets, with highly qualified asset managers who have proven track records that meet our underwriting requirements.

Northwest Quadrant Opportunity Fund, LLC engineers and constructs an investment vehicle consisting of Alternative Asset investments.

We do this with our Double Alpha Strategy of:

1.Picking highly qualified asset managers; and

2.Diversifying across asset classes, individual assets, and asset managers.

The Goals of the Northwest Quadrant Opportunity Fund, LLC are:

• Generation of Cash Flow

• Preservation of Capital

• Asset Appreciation

• Potential to Reduce Overall Portfolio Risk with Non-Correlated and Low-Correlated Assets

• Achieving Potential Tax Benefits

To learn more about the Northwest Quadrant Opportunity Fund, LLC and to obtain an offering memorandum, please click Northwest Quadrant Opportunity Fund, LLC.

Disclaimer: This is not an offer to sell or a solicitation of an offer to buy securities. Information about the offering described herein is subject to change and the information contained herein is qualified in its entirety by each confidential private placement memorandum for the security (the “Memorandum”). All investments involve risk. All potential investors must read the applicable memorandum, including the “Risk Factors,” prior to purchasing any securities. Any offerings or investments hereunder are being offered under SEC Regulation D, 506c. The aforementioned website is intended solely for the use of accredited investors only.

Economic and Investment Highlights

Last Week

Carl Icahn sold over half of his stake in Herbalife and relinquished his board seats.

Pelosi won a fourth term as House Speaker.

Factories in the U.S., Europe, and Asia boosted output as 2020 closed out the year.

A group of Google employees formed a union, a rare move in Silicon Valley.

Saudi Arabia is unilaterally cutting 1 million barrels a day of crude production starting next month, signaling a concern about the global economic recovery.

The World Bank lowered its projection for global economic growth between 2020 and 2029.

Several auto makers reported relatively brisk U.S. sales to finish 2020.

The yield on the 10-year Treasury note rose above 1% for the first time since March.

A mob stormed the U.S. Capitol.

Democrats gained control of the U.S. Senate in a Georgia runoff election.

Workers continued to apply for unemployment benefits at record levels to conclude 2020. The U.S. labor market slowed in December, with employers cutting 140,000 jobs in December.

The November U.S. trade deficit set another record high.

Elon Musk become the world’s richest person, based on the value of Tesla stock. He overtook Jeff Bezos of Amazon who held that position previously.

Facebook and Twitter blocked Trump from posting indefinitely.

Democrats plan to impeach Trump over the U.S. Capitol affair.

The Dow, the S&P 500, and the Nasdaq all rose for the week. The Dow was up 1.6%; the S&P 500 was up 1.83%; and the Nasdaq was up 2.4%. The 10-year treasury yield ended the week at 1.105%. Gold closed at $1,834.10 for the week. Oil closed at $52.24 for the week.

The Week Ahead

This link takes you to Econoday’s Economic Calendar and Economic Events and Analysis which shows the upcoming economic reporting events scheduled in the week and months ahead.

Summary

Note: The models below may not capture the impact of COVID-19 beyond their impact on GDP source data and relevant economic reports that have already been released. They may not anticipate the impact of COVID-19 on forthcoming economic reports beyond the standard internal dynamics of the models.

Note: The comments that follow are derived from the economic indicators referenced in the Resources section of this newsletter and other sources in this report.

The Aruoba-Diebold-Scotti Business Conditions Index (ALS) had been trending up for several weeks from having dipped in 2019. Recently with the advent of the economic collapse, the index crashed. It has now been generally trending down again, but fluctuating within a narrow band. This is a slightly positive indicator for the economy on a short-term basis.

The GDPNow model estimate for real GDP growth (seasonally adjusted annual rate) in the fourth quarter of 2020 is 7.4 percent. This reading agrees with the ALS model assessment of an improving short-term economic environment.

The New York Fed Staff Nowcast stands at 2.22 percent for 2020:Q4.

The Chicago Fed National Activity Index (CFNAI) showed an increase in economic activity in October. The Chicago Fed National Activity Index (CFNAI) was  was +0.27 in November, down from +1.01 in October.

All told, these short-term economic indicators are a mixed analysis for the economy, at least on a short-term basis.

Expectations that stock prices will rise over the next six months is now at 45.2% in a recent AAII Sentiment Survey. The historical average is 38.0% for the survey. 23.1% of the investors in the survey described their short-term outlook as neutral and 31.7% were bearish. Please see the AAII Sentiment Survey for the complete results.

The latest Gross Output (GO) reading (July 6, 2020) showed that Gross Output slowed significantly in the first quarter of 2020.

Advisor Perspectives publishes a monthly market valuation update.

Advisor Perspectives has market valuation and other useful and interesting investment information at this website.

Fourth Quarter 2020 Survey of Professional Forecasters

[Release Date: November 16, 2020] The outlook for real GDP growth in the next few quarters looks weaker now than it did three months ago, according to 37 forecasters surveyed by the Federal Reserve Bank of Philadelphia. The forecasters predict the economy will expand at an annual rate of 4.0 percent this quarter, lower than the prediction of 5.8 percent from the previous survey. On an annual-average over annual-average basis, the forecasters expect real GDP to decrease 3.5 percent this year but to recover and grow at an annual rate of between 2.1 percent to 4.0 percent over each of the following three years.

A downward revision to the projection for the unemployment rate accompanies the outlook for growth. The forecasters predict unemployment will decrease from a projected 7.0 percent this quarter to 5.8 percent in the fourth quarter of 2021. The prediction for the current-quarter unemployment rate is 2.5 percentage points lower than that of the last survey. On an annual-average basis, the panelists predict the unemployment rate will decline from a projected 8.2 percent in 2020 to 4.6 percent in 2023.

On the employment front, the forecasters expect job gains in the current quarter at a rate of 689,800 per month. The employment projections for the current and the following three quarters show upward revisions from those of the previous survey. The projections for the annual-average level of nonfarm payroll employment suggest job losses at a monthly rate of 718,000 in 2020 and job gains at a monthly rate of 321,600 in 2021. (These annual-average estimates are computed as the year-to-year change in the annual-average level of nonfarm payroll employment, converted to a monthly rate.) 

NABE Surveys

NABE Outlook Survey – December 2020

SUMMARY: “The NABE [National Association for Business Economics] Outlook panel anticipates more moderate growth in economic activity going forward after the sharp rebound during the third quarter,” said NABE President Manuel Balmaseda, CBE, chief economist, CEMEX. “The median forecast calls for a 4.1% annualized growth rate in the fourth quarter of 2020 for inflation-adjusted gross domestic product, or real GDP. In addition to the 33.1% GDP growth in the third quarter of the year, this would reverse much of the 32% annualized decline from the second quarter. However, the panel has become slightly less bullish about 2021. The median real GDP growth estimate for 2021 is 3.4%, slightly less than the 3.6% forecasted in the October survey.” “NABE panelists have become more optimistic, on balance, with nearly one-third revising their outlook higher based on recent news of effective vaccines,” added Survey Chair Holly Wade, executive director, NFIB Research Center. “Seventy-three percent of panelists believe that the economy will have returned to pre-pandemic GDP levels by the second half of 2021, 18% expect it to reach that level in the first half of 2022, and 10% believe it will occur in the second half of 2022 or later. The 73% is a dramatic improvement from the October survey in which 38% of panelists believed that a full recovery would occur before 2022. “Just over one-third of respondents anticipate more downside risk to economic growth in 2021,” continued Wade. “Panelists point to a second wave of COVID-19 cases as their main concern.”

The National Association for Business Economics (NABE) released its October Outlook Survey which is summarized as follows: “The NABE Outlook panel sees a strong rebound in economic activity after the collapse experienced during the second quarter,” said NABE Vice President Manuel Balmaseda, CBE, chief economist, CEMEX. “The median forecast calls for a 25% annualized growth rate in the third quarter of 2020 for inflation-adjusted gross domestic product, or real GDP. That would reverse much of the 31% annualized decline from the second quarter. However, the panel has become less bullish about the fourth quarter of 2020, as well as 2021. The median real GDP growth estimate for 2021 is 3.6%, compared to a 4.8% forecast in the June survey.”

“NABE panelists have become more optimistic, on balance, but remain concerned about a potential second wave of COVID-19,” added Outlook Survey Chair Eugenio Aleman, economist, Wells Fargo Bank. “Thirty-eight percent of panelists believe that the economy will have returned to pre-pandemic GDP levels by the second half of 2021, 32% expect it to reach that level in the first half of 2022, and 30% believe it will occur in the second half of 2022 or later.

“About half of the panelists put the odds of a double-dip recession at 20% or less,” continued Aleman. “In contrast, one out of eight panelists places those odds at 50% or higher.”

Other highlights from the survey:

The median forecast calls for the unemployment rate to average 8.4% in 2020, 2.5 percentage points lower than the median forecast in the previous survey. Panelists expect the unemployment rate to decline each quarter, averaging 6.8% in 2021, compared with the 8% previously forecasted. The unemployment rate averaged 3.7% in 2019.

Panelists look for business investment to drop sharply this year. Real nonresidential fixed investment is forecasted to decline 6%. Panelists anticipate real nonresidential fixed investment to rise only gradually in 2021, increasing 2.4%.

Survey respondents expect inflation—as measured by the GDP price index—to be significantly lower in 2020 and 2021 relative to 2019. Inflation is forecasted to be 1.0% in 2020 and 1.5% in 2021. The index increased 1.8% in 2019.

Panelists expect the consumer price index (CPI) to rise 1.2% in 2020, significantly lower than the actual 1.8% growth in consumer prices in 2019. The 2020 forecast median has increased since the June survey, when panelists saw CPI rising by 0.7%. The panel anticipates consumer price growth will pick up moving forward, with a 1.9% annual average gain in 2021.

Panelists expect corporate profits to contract by 11% in 2020. The median forecast calls for profits to increase by 8.5% in 2021.

Four out of ten panelists indicate that 5% of jobs will be permanently lost due to firms closing. More than half of the panel suggest between 10% and 20% of job losses will be permanent.

Thirty-eight percent of panelists believe that the economy will have returned to pre-pandemic GDP levels by the second half of 2021; only 2% suggest this will occur before the end of 2020, 12% believe GDP will recover in the first half of 2021, and 24% anticipate such a return in the second half of 2021. Thirty-two percent of respondents expect GDP to reach pre-pandemic levels in the first half of 2022, and 22% believe it will occur in the second half of 2022.

For a more in-depth review and analysis of the economy, please see our mini-book on economic analysis and forecasting entitled: Simple and Effective Economic Forecasting.

NABE October Business Conditions Survey

“The October NABE Business Conditions Survey shows that firms are continuing to gain ground since the sharp economic downturn experienced in the first half of the year,” said NABE President Manuel Balmaseda, CBE, chief economist, CEMEX. “This momentum is expected to continue through the rest of 2020. In addition, more respondents than in the July survey anticipate stronger growth in inflation-adjusted gross domestic product over the next year.”  “More respondents in this survey report continued improvements, especially in sales and profit margins, at their firms during the past three months than in the July survey,” added NABE Business Conditions Survey Chair Holly Wade, executive director, NFIB Research Center. “Capital spending is also picking up steam, with more firms investing in their businesses over the past three months, and more planning to do the same in the next three months. “The employment picture is less rosy, with many firms still holding back on wage and staff increases,” continued Wade. “While slightly more respondents report an increase in employment at their firms over the last three months than in the previous survey, more also report a decrease in employment. Most firms are also forgoing raises to control costs with 70% of respondents’ firms reporting unchanged wages and salaries over the last two quarters, the highest reading since January 2014.”

Higlights

• The panel’s consensus outlook for the U.S. economy, measured by year-over-year growth in inflation-adjusted gross domestic product (real GDP), continued to improve in October compared to that in the two previous surveys. Eighty-nine percent of panelists expect real GDP to increase from the third quarter (Q3) of 2020 to Q3 2021. Only 9% of respondents expect the real GDP change to be zero or negative, compared to 31% of respondents who held this view in the July survey when asked about the outlook for the 12 months ending Q2 2021.

• For the first time since April 2019, a majority of respondents’ firms reports increased sales at their firms, with 52% indicating rising sales during Q3. The Net Rising Index (NRI) for sales—the percentage of panelists reporting rising sales minus the percentage reporting falling sales—surged upward, increasing 47 points to 33, up from -14 in July. The forward-looking NRI for anticipated sales over the next three months also rose, adding to the sharp increase reported in the July survey. The NRI for anticipated sales increased 13 points, from 18 in July to 31, with positive readings in three of the four industry sectors.

• Profit-margin increases were more widespread in Q3 2020, but remained less prevalent than decreases among respondents’ firms, with the NRI for profit margins increasing 21 points to -4. The share of respondents reporting rising profit margins increased from 15% in July to 21% in October, while the percentage reporting falling margins declined 15 percentage points—from 40% in July to 25% in October.

• The NRI for prices charged returned to neutral in October—registering +1—following the sharp decline during the first half of 2020, that brought the NRI in July to its lowest level since 1987. NRIs by sector, however, vary significantly. The NRI for goods-producing firms is 21, after registering -40 in July. But the index for finance, insurance, real estate (FIRE) sector firms remains negative with an NRI of -19. Between these extremes are the NRI for services, with a reading of 3, and the NRI of 8 for the transportation, utilities, information, communications (TUIC) sector. The share of respondents expecting price increases in the next three months rebounded from levels in the previous two surveys to 26% in October, resulting in an NRI of 20. Six percent anticipate falling prices in the next three months.

• The NRI for materials costs also rebounded from two quarters of negative readings to a reading of 10. All sectors registered positive NRIs, led by goods-producers at 15, bouncing back from -56 in July. The NRI for expected costs rose modestly, from 1 to 8, having been as low as -21 in April.

• Hiring at respondents’ firms remains depressed. The third-quarter NRI for employment levels over the last three months is -17, compared to -19 in the July survey. Even as the NRI improved, the share of respondents indicating there was decline in employment at their firms rose to 27% from 24% in the July survey. At the same time, 9% report employment increases at their firms, compared to 5% in July. The outlook for employment deteriorated in Q3, as the NRI for hiring expectations declined to just 1, down from 6 in the July survey. Respondents from the goods-producing and TUIC sectors expect their firms will add jobs in the next three months. In the July survey, three of the four sectors had positive NRIs for expected employment change in Q3 2020.

• The NRI for wages and salaries rebounded 13 points to 4 in the October survey. The upward movement in the index reflects an increase to 17% from 11% in July in the share of respondents citing rising wages, and a decrease to 13% from 19% in the share reporting falling wages. The forward-looking NRI for wages and salaries moved from 0 in July to 15 in October.

• Almost two-thirds of respondents report no shortages of inputs in Q3 2020, similar to results from the July survey. The share of respondents reporting shortages is virtually unchanged in the current survey across all inputs, except for a decline in the percentage indicating intermediate input shortages.

• The NRI for capital spending improved, from -19 in July to -8 in October. Fewer respondents report continuing declines in spending, while more indicate their firms’ capital spending increased during Q3 2020. However, service-sector panelists report not much improvement from the prior two readings. The forward-looking NRI for capital spending rose considerably, from -40 in April to 6 in October, as fewer respondents expect declines in spending over the next 3 months.

• In response to COVID-19, businesses continue to adjust employee headcount and wages. Imposing a hiring freeze is the most common response, cited by 69% of respondents.

• Respondents’ near-term outlook improved slightly in October compared to that in the July survey. Thirty-six percent of respondents report a “Better” near-term in October, compared to 34% in July. Only 8% indicate their near-term outlook is “Worse” in October, compared to 12% in July.

• Twenty-three percent of respondents report that sales at their companies are at “more than 100% of pre-crisis level,” an increase from the 15% in the July survey.

• Thirty-one percent of respondents expect sales to return to normal “sometime in 2021,” while 24% do not expect sales to return to normal until sometime in 2022. Only 10% expect sales to return to normal by the end of 2020.

• Only 3% of respondents report that their firms applied, or are planning to apply, for Main Street Lending programs.

• Thirty-five percent of respondents indicate their firms have implemented new work-at-home policies, allowing “all employees” to work from home during the pandemic. Another 33% allow “most employees” to work from home, while 16% only allow “some employees” to work from home.

• Thirty-one percent of respondents report that their firms will wait for “progress regarding COVID-19” before changing their work-from-home policies. Twenty-two percent indicate their companies will wait until the second half of 2021, while 16% of firms plan to suspend work-from-home policies in the first half of 2021.

Stock Market Valuations

Our estimates of the market valuations for two stock market indices, the Dow Jones Industrial Average (DJIA) and the Standard & Poor’s 500 (S&P 500), can be found in the file below:

Conclusion

During this time of global flux due to the coronavirus, I am leaving the Conclusion discussion below the same as was posted on March 23, 2020. The March 23, 2020 discussion still adequately reflects my thinking on the current state of affairs.

Important Note: While I don’t believe it is time to jump back into the stock market in a big way because of the market’s overvaluation, I have been advising the last few of weeks in this Commentary and in my weekly podcast, Intrinsic Value Wealth Report Radio, that investors can continue building their investment portfolios by selecting individual securities that offer growth and value opportunities.

Reprinted from March 23, 2020

Up until the past week, the economy had been in a stable but somewhat vulnerable state. Nonetheless, it had remained fairly strong. In fact, robust consumer spending and strong labor market conditions had given us confidence that the economy, which had been in its tenth year of expansion, could continue to grow. But we were cautious on this outlook. There were several reasons for our caution. U.S. business growth had been mixed. And global economic growth had been mixed as well. The new coronavirus was becoming a global economic threat, although it was still too early to tell how much of an effect it would ultimately have. Debt is at high levels for consumers, businesses, and government (at all levels of government). Finally, this is an election year that will likely have significant consequences either positively or negatively depending on the outcome of the elections. And of course, it is still too early to tell what the outcome of the elections will be.

In just a few days, the coronavirus’s effect on the economy and the markets went from a ripple to a tsunami. Businesses are shuttering, events are being cancelled or postponed, grocery store shelves are empty, and people are being asked or ordered to stay home. The markets are now deep in bear market territory. The effects on the economy, even given the short time that the economy has been retreating, may be with us for a long time. There is now a much greater risk of a recession, and there has even been some talk of a depression. The government, the Fed, Republicans, and Democrats, and pretty much the entire country, is trying to get the virus under control and is coming up with plans to mitigate the long-term economic effects caused by the virus. But the virus has impacted the economy – in a significant way – in just a short time. How long lasting the effects will be no one can tell right now. The economy has been largely shut down and remains so today. It takes time to restart the economy after a situation such as what is occurring at the present time.

Given these events and the rapidly deteriorating situation, as I said last week, I would caution not to panic. The economy and the markets will get better. The situation is bad – there is no doubt about that – but it will turn around. The real question is when will it turn around? No one knows that at the present time. But it will turn around.

For now, review your investment portfolios. It is highly likely that all or most of your stocks are down. You should not consider selling the bulk of your stocks – only consider selling companies that are not sound companies. But do recognize that as the economy deteriorates, even good companies will be affected.

For stock market value hunters, we believe it is still too early to jump back in. We will be closely monitoring the markets using the many tools and models that we have developed over the years to assess the economy and the markets. We will use our best judgement and thoughts to let you know when we believe things are turning around. The turnaround hasn’t happened yet.

We believe it is important to maintain a long-term view toward investing. But for now, just sit tight. Eventually, this means that you should continue building your investment portfolio using the Cassandra Stock Selection Model to select individual securities that offer growth and value opportunities.

Chart for Review and Thought

10-Year Treasury Constant Maturity Rate

Simple and Effective Economic Forecasting Model

Note: The table and chart below have not been updated. However, we believe that a recession is quite likely. In the chart below, the bottom green line shows what a recession could look like.

Notes (GDP Growth Chart):

  1. See the July 8, 2019 Commentary for an introduction to this model.
  2. Actual numbers 2007 through 2019; forecasted numbers thereafter.
  3. Normal GDP growth is typically in the 2% to 3% range.
  4. A recession is generally defined as two consecutive quarters of negative economic growth as measured by a country’s gross domestic product (GDP).

Thought for the Week

“If voting made any difference they wouldn’t let us do it.” ~ Mark Twain

Announcements

The Intrinsic Value Wealth Report has started a new YouTube channel called Intrinsic Value Wealth Report TV. You can view the YouTube channel at Intrinsic Value Wealth Report TV.

The Intrinsic Value Wealth Report has started a new podcast called Intrinsic Value Wealth Report Radio. You can listen to the podcast at Intrinsic Value Wealth Report Radio.

Dr. Wendee spoke at the Investment Club of America’s annual economic summit, called Econosummit, on Sunday March 1, 2020 in Las Vegas.

Dr. Wendee attended the The National Due Diligence Alliance (TNDDA) investment banking conference, which was held March 6-8, 2020 at the Four Seasons Resort in Dallas, Texas. This is a conference held several times throughout the year for investment bankers and registered investment advisers to learn about new opportunities in the Alternative Investment asset classes.

TNDDA Meeting in Dallas, Texas

We have been researching the use of crowdsourcing for investment ideas. We will be sending a survey out in the next few weeks to get your input on the economy and the markets; and to get any investment ideas that you would like to share. We will compile this input and distribute the results to you and our other subscribers. We have been testing our crowdsourcing models with students and have been having good success and results.

Dr. Wendee has been researching and writing a new theory of economics known as, The Value Creation Theory of the Economy (also known as, Intrinsinomics). The full paper on Intrinsinomics will be published in the near future.

Finance 3350: Personal Finance-Portfolio & Risk Management– Dr. Wendee taught teaching Finance 3350 – Portfolio & Risk Management at California State University, Los Angeles (CSULA) for the Summer term starting May 2020. Dr. Wendee teaches courses in Management and Finance at CSULA.

Business 548: Strategy and Decision Making – Dr. Wendee taught Business 548 – Strategy and Decision Making at California Baptist University (CBU) starting at the end of June 2020. Dr. Wendee teaches courses in Finance, Business, Strategy & Decision Making, and Economics at CBU.

Business 303: Business Finance – Dr. Wendee taught Business 303 – Business Finance at California Baptist University (CBU) starting at the end of August 2020. Dr. Wendee teaches courses in Finance, Business, Strategy & Decision Making, and Economics at CBU.

Business 539: Financial Management – Dr. Wendee is teaching Business 539 – Financial Management at California Baptist University (CBU) which started at the end of October. Dr. Wendee teaches courses in Finance, Business, Strategy & Decision Making, and Economics at CBU.

Dr. Wendee presented a paper on his new theory of economics known as, The Value Creation Theory of the Economy (also known as, Intrinsinomics), at the International Leadership Association’s annual global conference which was held in Ottawa, Canada last Fall.

Dr. Wendee presented an updated paper on his new theory of economics known as, The Value Creation Theory of the Economy (also known as, Intrinsinomics), at the International Leadership Association’s annual global conference which was to have been held in San Francisco, California in November, but which was held virtually instead due to the Coronavirus.

Dr. Wendee delivered a talk entitled: Using Alternative Assets to Increase Portfolio Returns and Decrease Risk at the BrightTalk Q4 2020 Outlook Summit on October 28, 2020. You can access additional information on the summit and Dr. Wendee’s presentation here.

Dr. Wendee delivered a talk  at the BrightTalk conference on December 9, 2020 entitled: Emerging Themes and Great Places to Invest for 2021. You can access additional information on the summit and Dr. Wendee’s presentation here.

Dr. Wendee will be delivering a talk  at the BrightTalk conference on January 20, 2021 entitled: Developing an Income-Producing Strategy for 2021 and Beyond. You can access additional information on the summit and Dr. Wendee’s presentation here.

Dr. Wendee is working on a financial planning modeling program which will be available in the near future. The modeling program is designed to assist anyone in creating a financial plan and is customizable for each person’s unique financial planning goals. A working draft of the model is currently in beta test with students. Click this link, schematic, to go to the clickable document under the subheading Financial Planning Process (Draft) in the Intrinsic Value Wealth Report to see a draft of the schematic for the new financial planning process.

Dr. Wendee has been developing an econometric model specifically designed to monitor and forecast the global economy as this current economic crisis unfolds. This new econometric model is based on other econometric models that he has designed and have used for many years. You can find some of these earlier models in Book # 6 – Simple and Effective Economic Forecasting in the sister website to this website which is called the Intrinsic Value Wealth Report. The new econometric model has been constructed with some additional tools and methods that he has learned and some that he has developed over the last several years. He will be talking more about this new econometric model in this Commentary over the next few months. His comments and forecasts on the economy and the markets going forward will be based to a significant extent on this new model.

We have begun raising capital for our fund-of-funds investment, Northwest Quadrant Opportunity Fund, LLC. The fund engineers and constructs an investment vehicle consisting of Alternative Asset investments. The fund’s objective is to build a diversified portfolio of strong, solid, steady- performing assets, with highly qualified asset managers who have proven track records that meet our underwriting requirements. To learn more about the Northwest Quadrant Opportunity Fund, LLC and to obtain an offering memorandum, please click Northwest Quadrant Opportunity Fund, LLC.

Intrinsic Value Wealth Creation pyramid

We always conclude our commentary with a discussion of the Intrinsic Value Wealth Creation Pyramid. The Intrinsic Value Wealth Creation Pyramid is designed to show some of the major categories for building wealth. It is the result of many years of study of the wealth building process; experience working with clients who have built considerable wealth; and my own personal experience building wealth. Newsletter subscribers should consult the Intrinsic Value Wealth Creation Pyramid as one of many useful investment tools while considering their investment plans.

The chart in this section is an expanded version of the Intrinsic Value Wealth Creation Pyramid Chart referenced in the Forbes.com article entitled, Nine of the Best Ways to Build Wealth.

RESOURCES

See our Resources section for links to economic and other resources used in the preparation of this Commentary.

Posted in Economic & Business Chart Room, Economic Outlook, Entrepreneurship, Focus List, Investment Recommendations, Investments, Notes From The Field, Special Situations, Uncategorized, VDI/REEP, Visionary Ideas | Tagged , , , , , , , , , , , , , , , , , , , , , , , , , , , , , , , , , | Comments Off on WEEKLY COMMENTARY January 12, 2021

WEEKLY COMMENTARY January 5, 2021

Financial Planning Services Now Being Offered to More Investors

We have been offering comprehensive financial planning services since 1982 to select investors. Beginning in 2021, we have decided to offer our financial planning services to more investors and to expand our suite of services. The services we now offer include:

  1. Comprehensive Financial Planning
  2. Wealth Management
  3. Retirement Planning
  4. Business Consulting
  5. Succession Planning

Dr. Wendee has been a Certified Financial Planner (TM) Professional since 1986. Please see his registration with the Certified Financial Planner Board. Please also see our Form ADV Part 2A and Part 2B.

If you would like more information about our services or would like to discuss your financial planning needs, please contact us at: Phone 949-218-7942 or email pwendee@pmwassoc.com.

Economic and Investment Highlights

Last Week

Consumer product companies are expanding factories and revamping production.

U.S. retail sales rose 2.4% between November 1st and Christmas Eve compared to the same period last year; but that was below a predicted level. Online sales grew 47.2%.

The economic impact of the current wave of the pandemic in the West has been less that the impact from the initial wave.

America’s colleges and universities issued a record amount of bonds in 2020 due to the deterioration in their finances.

Covid-19 cases in the U.S. exceeded 19 million.

Assets for oil companies have been written down across the board.

Global IT spending is expected to rise 4.3% next year.

Margin debt has reached a new high level, the first time in two years.

American Airlines put passengers back on the Boeing 737 MAX for the first time since the deadly crashes.

Colorado reported the first case in the U.S. of the new Coronavirus strain. California reported the second case in the U.S.

IPOs raised a record $167.2 billion in 454 offerings on U.S. exchanges in 2020.

China had its tenth straight month of expansion in its manufacturing sector.

The U.K. officially left the EU.

The S&P 500 and the Dow ended 2020 at record levels, rising 16.3% and 7.2%, respectively. The NASDAQ rose 4.4% in its best year since 2009.

The Dow, the S&P 500, and the Nasdaq all rose for the week. The Dow was up 1.3%; the S&P 500 was up 1.43%; and the Nasdaq was up 0.7%. The 10-year treasury yield ended the week at 0.913%. Gold closed at $1,893.10 for the week. Oil closed at $48.52 for the week.

The Week Ahead

This link takes you to Econoday’s Economic Calendar and Economic Events and Analysis which shows the upcoming economic reporting events scheduled in the week and months ahead.

Summary

Note: The models below may not capture the impact of COVID-19 beyond their impact on GDP source data and relevant economic reports that have already been released. They may not anticipate the impact of COVID-19 on forthcoming economic reports beyond the standard internal dynamics of the models.

Note: The comments that follow are derived from the economic indicators referenced in the Resources section of this newsletter and other sources in this report.

The Aruoba-Diebold-Scotti Business Conditions Index (ALS) had been trending up for several weeks from having dipped in 2019. Recently with the advent of the economic collapse, the index crashed. It has now been generally trending down again, but fluctuating within a narrow band. This is a slightly positive indicator for the economy on a short-term basis.

The GDPNow model estimate for real GDP growth (seasonally adjusted annual rate) in the fourth quarter of 2020 is 8.5 percent. This reading agrees with the ALS model assessment of an improving short-term economic environment.

The New York Fed Staff Nowcast stands at 2.05 percent for 2020:Q4.

The Chicago Fed National Activity Index (CFNAI) showed an increase in economic activity in October. The Chicago Fed National Activity Index (CFNAI) was  was +0.27 in November, down from +1.01 in October.

All told, these short-term economic indicators are a mixed analysis for the economy, at least on a short-term basis.

Expectations that stock prices will rise over the next six months is now at 46.1% in a recent AAII Sentiment Survey. The historical average is 38.0% for the survey. 27.1% of the investors in the survey described their short-term outlook as neutral and 26.8% were bearish. Please see the AAII Sentiment Survey for the complete results.

The latest Gross Output (GO) reading (July 6, 2020) showed that Gross Output slowed significantly in the first quarter of 2020.

Advisor Perspectives publishes a monthly market valuation update.

Advisor Perspectives has market valuation and other useful and interesting investment information at this website.

Fourth Quarter 2020 Survey of Professional Forecasters

[Release Date: November 16, 2020] The outlook for real GDP growth in the next few quarters looks weaker now than it did three months ago, according to 37 forecasters surveyed by the Federal Reserve Bank of Philadelphia. The forecasters predict the economy will expand at an annual rate of 4.0 percent this quarter, lower than the prediction of 5.8 percent from the previous survey. On an annual-average over annual-average basis, the forecasters expect real GDP to decrease 3.5 percent this year but to recover and grow at an annual rate of between 2.1 percent to 4.0 percent over each of the following three years.

A downward revision to the projection for the unemployment rate accompanies the outlook for growth. The forecasters predict unemployment will decrease from a projected 7.0 percent this quarter to 5.8 percent in the fourth quarter of 2021. The prediction for the current-quarter unemployment rate is 2.5 percentage points lower than that of the last survey. On an annual-average basis, the panelists predict the unemployment rate will decline from a projected 8.2 percent in 2020 to 4.6 percent in 2023.

On the employment front, the forecasters expect job gains in the current quarter at a rate of 689,800 per month. The employment projections for the current and the following three quarters show upward revisions from those of the previous survey. The projections for the annual-average level of nonfarm payroll employment suggest job losses at a monthly rate of 718,000 in 2020 and job gains at a monthly rate of 321,600 in 2021. (These annual-average estimates are computed as the year-to-year change in the annual-average level of nonfarm payroll employment, converted to a monthly rate.) 

NABE Surveys

NABE Outlook Survey – December 2020

SUMMARY: “The NABE [National Association for Business Economics] Outlook panel anticipates more moderate growth in economic activity going forward after the sharp rebound during the third quarter,” said NABE President Manuel Balmaseda, CBE, chief economist, CEMEX. “The median forecast calls for a 4.1% annualized growth rate in the fourth quarter of 2020 for inflation-adjusted gross domestic product, or real GDP. In addition to the 33.1% GDP growth in the third quarter of the year, this would reverse much of the 32% annualized decline from the second quarter. However, the panel has become slightly less bullish about 2021. The median real GDP growth estimate for 2021 is 3.4%, slightly less than the 3.6% forecasted in the October survey.” “NABE panelists have become more optimistic, on balance, with nearly one-third revising their outlook higher based on recent news of effective vaccines,” added Survey Chair Holly Wade, executive director, NFIB Research Center. “Seventy-three percent of panelists believe that the economy will have returned to pre-pandemic GDP levels by the second half of 2021, 18% expect it to reach that level in the first half of 2022, and 10% believe it will occur in the second half of 2022 or later. The 73% is a dramatic improvement from the October survey in which 38% of panelists believed that a full recovery would occur before 2022. “Just over one-third of respondents anticipate more downside risk to economic growth in 2021,” continued Wade. “Panelists point to a second wave of COVID-19 cases as their main concern.”

The National Association for Business Economics (NABE) released its October Outlook Survey which is summarized as follows: “The NABE Outlook panel sees a strong rebound in economic activity after the collapse experienced during the second quarter,” said NABE Vice President Manuel Balmaseda, CBE, chief economist, CEMEX. “The median forecast calls for a 25% annualized growth rate in the third quarter of 2020 for inflation-adjusted gross domestic product, or real GDP. That would reverse much of the 31% annualized decline from the second quarter. However, the panel has become less bullish about the fourth quarter of 2020, as well as 2021. The median real GDP growth estimate for 2021 is 3.6%, compared to a 4.8% forecast in the June survey.”

“NABE panelists have become more optimistic, on balance, but remain concerned about a potential second wave of COVID-19,” added Outlook Survey Chair Eugenio Aleman, economist, Wells Fargo Bank. “Thirty-eight percent of panelists believe that the economy will have returned to pre-pandemic GDP levels by the second half of 2021, 32% expect it to reach that level in the first half of 2022, and 30% believe it will occur in the second half of 2022 or later.

“About half of the panelists put the odds of a double-dip recession at 20% or less,” continued Aleman. “In contrast, one out of eight panelists places those odds at 50% or higher.”

Other highlights from the survey:

The median forecast calls for the unemployment rate to average 8.4% in 2020, 2.5 percentage points lower than the median forecast in the previous survey. Panelists expect the unemployment rate to decline each quarter, averaging 6.8% in 2021, compared with the 8% previously forecasted. The unemployment rate averaged 3.7% in 2019.

Panelists look for business investment to drop sharply this year. Real nonresidential fixed investment is forecasted to decline 6%. Panelists anticipate real nonresidential fixed investment to rise only gradually in 2021, increasing 2.4%.

Survey respondents expect inflation—as measured by the GDP price index—to be significantly lower in 2020 and 2021 relative to 2019. Inflation is forecasted to be 1.0% in 2020 and 1.5% in 2021. The index increased 1.8% in 2019.

Panelists expect the consumer price index (CPI) to rise 1.2% in 2020, significantly lower than the actual 1.8% growth in consumer prices in 2019. The 2020 forecast median has increased since the June survey, when panelists saw CPI rising by 0.7%. The panel anticipates consumer price growth will pick up moving forward, with a 1.9% annual average gain in 2021.

Panelists expect corporate profits to contract by 11% in 2020. The median forecast calls for profits to increase by 8.5% in 2021.

Four out of ten panelists indicate that 5% of jobs will be permanently lost due to firms closing. More than half of the panel suggest between 10% and 20% of job losses will be permanent.

Thirty-eight percent of panelists believe that the economy will have returned to pre-pandemic GDP levels by the second half of 2021; only 2% suggest this will occur before the end of 2020, 12% believe GDP will recover in the first half of 2021, and 24% anticipate such a return in the second half of 2021. Thirty-two percent of respondents expect GDP to reach pre-pandemic levels in the first half of 2022, and 22% believe it will occur in the second half of 2022.

For a more in-depth review and analysis of the economy, please see our mini-book on economic analysis and forecasting entitled: Simple and Effective Economic Forecasting.

NABE October Business Conditions Survey

“The October NABE Business Conditions Survey shows that firms are continuing to gain ground since the sharp economic downturn experienced in the first half of the year,” said NABE President Manuel Balmaseda, CBE, chief economist, CEMEX. “This momentum is expected to continue through the rest of 2020. In addition, more respondents than in the July survey anticipate stronger growth in inflation-adjusted gross domestic product over the next year.”  “More respondents in this survey report continued improvements, especially in sales and profit margins, at their firms during the past three months than in the July survey,” added NABE Business Conditions Survey Chair Holly Wade, executive director, NFIB Research Center. “Capital spending is also picking up steam, with more firms investing in their businesses over the past three months, and more planning to do the same in the next three months. “The employment picture is less rosy, with many firms still holding back on wage and staff increases,” continued Wade. “While slightly more respondents report an increase in employment at their firms over the last three months than in the previous survey, more also report a decrease in employment. Most firms are also forgoing raises to control costs with 70% of respondents’ firms reporting unchanged wages and salaries over the last two quarters, the highest reading since January 2014.”

Higlights

• The panel’s consensus outlook for the U.S. economy, measured by year-over-year growth in inflation-adjusted gross domestic product (real GDP), continued to improve in October compared to that in the two previous surveys. Eighty-nine percent of panelists expect real GDP to increase from the third quarter (Q3) of 2020 to Q3 2021. Only 9% of respondents expect the real GDP change to be zero or negative, compared to 31% of respondents who held this view in the July survey when asked about the outlook for the 12 months ending Q2 2021.

• For the first time since April 2019, a majority of respondents’ firms reports increased sales at their firms, with 52% indicating rising sales during Q3. The Net Rising Index (NRI) for sales—the percentage of panelists reporting rising sales minus the percentage reporting falling sales—surged upward, increasing 47 points to 33, up from -14 in July. The forward-looking NRI for anticipated sales over the next three months also rose, adding to the sharp increase reported in the July survey. The NRI for anticipated sales increased 13 points, from 18 in July to 31, with positive readings in three of the four industry sectors.

• Profit-margin increases were more widespread in Q3 2020, but remained less prevalent than decreases among respondents’ firms, with the NRI for profit margins increasing 21 points to -4. The share of respondents reporting rising profit margins increased from 15% in July to 21% in October, while the percentage reporting falling margins declined 15 percentage points—from 40% in July to 25% in October.

• The NRI for prices charged returned to neutral in October—registering +1—following the sharp decline during the first half of 2020, that brought the NRI in July to its lowest level since 1987. NRIs by sector, however, vary significantly. The NRI for goods-producing firms is 21, after registering -40 in July. But the index for finance, insurance, real estate (FIRE) sector firms remains negative with an NRI of -19. Between these extremes are the NRI for services, with a reading of 3, and the NRI of 8 for the transportation, utilities, information, communications (TUIC) sector. The share of respondents expecting price increases in the next three months rebounded from levels in the previous two surveys to 26% in October, resulting in an NRI of 20. Six percent anticipate falling prices in the next three months.

• The NRI for materials costs also rebounded from two quarters of negative readings to a reading of 10. All sectors registered positive NRIs, led by goods-producers at 15, bouncing back from -56 in July. The NRI for expected costs rose modestly, from 1 to 8, having been as low as -21 in April.

• Hiring at respondents’ firms remains depressed. The third-quarter NRI for employment levels over the last three months is -17, compared to -19 in the July survey. Even as the NRI improved, the share of respondents indicating there was decline in employment at their firms rose to 27% from 24% in the July survey. At the same time, 9% report employment increases at their firms, compared to 5% in July. The outlook for employment deteriorated in Q3, as the NRI for hiring expectations declined to just 1, down from 6 in the July survey. Respondents from the goods-producing and TUIC sectors expect their firms will add jobs in the next three months. In the July survey, three of the four sectors had positive NRIs for expected employment change in Q3 2020.

• The NRI for wages and salaries rebounded 13 points to 4 in the October survey. The upward movement in the index reflects an increase to 17% from 11% in July in the share of respondents citing rising wages, and a decrease to 13% from 19% in the share reporting falling wages. The forward-looking NRI for wages and salaries moved from 0 in July to 15 in October.

• Almost two-thirds of respondents report no shortages of inputs in Q3 2020, similar to results from the July survey. The share of respondents reporting shortages is virtually unchanged in the current survey across all inputs, except for a decline in the percentage indicating intermediate input shortages.

• The NRI for capital spending improved, from -19 in July to -8 in October. Fewer respondents report continuing declines in spending, while more indicate their firms’ capital spending increased during Q3 2020. However, service-sector panelists report not much improvement from the prior two readings. The forward-looking NRI for capital spending rose considerably, from -40 in April to 6 in October, as fewer respondents expect declines in spending over the next 3 months.

• In response to COVID-19, businesses continue to adjust employee headcount and wages. Imposing a hiring freeze is the most common response, cited by 69% of respondents.

• Respondents’ near-term outlook improved slightly in October compared to that in the July survey. Thirty-six percent of respondents report a “Better” near-term in October, compared to 34% in July. Only 8% indicate their near-term outlook is “Worse” in October, compared to 12% in July.

• Twenty-three percent of respondents report that sales at their companies are at “more than 100% of pre-crisis level,” an increase from the 15% in the July survey.

• Thirty-one percent of respondents expect sales to return to normal “sometime in 2021,” while 24% do not expect sales to return to normal until sometime in 2022. Only 10% expect sales to return to normal by the end of 2020.

• Only 3% of respondents report that their firms applied, or are planning to apply, for Main Street Lending programs.

• Thirty-five percent of respondents indicate their firms have implemented new work-at-home policies, allowing “all employees” to work from home during the pandemic. Another 33% allow “most employees” to work from home, while 16% only allow “some employees” to work from home.

• Thirty-one percent of respondents report that their firms will wait for “progress regarding COVID-19” before changing their work-from-home policies. Twenty-two percent indicate their companies will wait until the second half of 2021, while 16% of firms plan to suspend work-from-home policies in the first half of 2021.

Stock Market Valuations

Our estimates of the market valuations for two stock market indices, the Dow Jones Industrial Average (DJIA) and the Standard & Poor’s 500 (S&P 500), can be found in the file below:

Conclusion

During this time of global flux due to the coronavirus, I am leaving the Conclusion discussion below the same as was posted on March 23, 2020. The March 23, 2020 discussion still adequately reflects my thinking on the current state of affairs.

Important Note: While I don’t believe it is time to jump back into the stock market in a big way because of the market’s overvaluation, I have been advising the last few of weeks in this Commentary and in my weekly podcast, Intrinsic Value Wealth Report Radio, that investors can continue building their investment portfolios by selecting individual securities that offer growth and value opportunities.

Reprinted from March 23, 2020

Up until the past week, the economy had been in a stable but somewhat vulnerable state. Nonetheless, it had remained fairly strong. In fact, robust consumer spending and strong labor market conditions had given us confidence that the economy, which had been in its tenth year of expansion, could continue to grow. But we were cautious on this outlook. There were several reasons for our caution. U.S. business growth had been mixed. And global economic growth had been mixed as well. The new coronavirus was becoming a global economic threat, although it was still too early to tell how much of an effect it would ultimately have. Debt is at high levels for consumers, businesses, and government (at all levels of government). Finally, this is an election year that will likely have significant consequences either positively or negatively depending on the outcome of the elections. And of course, it is still too early to tell what the outcome of the elections will be.

In just a few days, the coronavirus’s effect on the economy and the markets went from a ripple to a tsunami. Businesses are shuttering, events are being cancelled or postponed, grocery store shelves are empty, and people are being asked or ordered to stay home. The markets are now deep in bear market territory. The effects on the economy, even given the short time that the economy has been retreating, may be with us for a long time. There is now a much greater risk of a recession, and there has even been some talk of a depression. The government, the Fed, Republicans, and Democrats, and pretty much the entire country, is trying to get the virus under control and is coming up with plans to mitigate the long-term economic effects caused by the virus. But the virus has impacted the economy – in a significant way – in just a short time. How long lasting the effects will be no one can tell right now. The economy has been largely shut down and remains so today. It takes time to restart the economy after a situation such as what is occurring at the present time.

Given these events and the rapidly deteriorating situation, as I said last week, I would caution not to panic. The economy and the markets will get better. The situation is bad – there is no doubt about that – but it will turn around. The real question is when will it turn around? No one knows that at the present time. But it will turn around.

For now, review your investment portfolios. It is highly likely that all or most of your stocks are down. You should not consider selling the bulk of your stocks – only consider selling companies that are not sound companies. But do recognize that as the economy deteriorates, even good companies will be affected.

For stock market value hunters, we believe it is still too early to jump back in. We will be closely monitoring the markets using the many tools and models that we have developed over the years to assess the economy and the markets. We will use our best judgement and thoughts to let you know when we believe things are turning around. The turnaround hasn’t happened yet.

We believe it is important to maintain a long-term view toward investing. But for now, just sit tight. Eventually, this means that you should continue building your investment portfolio using the Cassandra Stock Selection Model to select individual securities that offer growth and value opportunities.

Chart for Review and Thought

S & P 500

Simple and Effective Economic Forecasting Model

Note: The table and chart below have not been updated. However, we believe that a recession is quite likely. In the chart below, the bottom green line shows what a recession could look like.

Notes (GDP Growth Chart):

  1. See the July 8, 2019 Commentary for an introduction to this model.
  2. Actual numbers 2007 through 2019; forecasted numbers thereafter.
  3. Normal GDP growth is typically in the 2% to 3% range.
  4. A recession is generally defined as two consecutive quarters of negative economic growth as measured by a country’s gross domestic product (GDP).

Thought for the Week

“If you want to get the right answer, you have to ask the right question.” ~ Dr. Paul M. Wendee

Announcements

The Intrinsic Value Wealth Report has started a new YouTube channel called Intrinsic Value Wealth Report TV. You can view the YouTube channel at Intrinsic Value Wealth Report TV.

The Intrinsic Value Wealth Report has started a new podcast called Intrinsic Value Wealth Report Radio. You can listen to the podcast at Intrinsic Value Wealth Report Radio.

Dr. Wendee spoke at the Investment Club of America’s annual economic summit, called Econosummit, on Sunday March 1, 2020 in Las Vegas.

Dr. Wendee attended the The National Due Diligence Alliance (TNDDA) investment banking conference, which was held March 6-8, 2020 at the Four Seasons Resort in Dallas, Texas. This is a conference held several times throughout the year for investment bankers and registered investment advisers to learn about new opportunities in the Alternative Investment asset classes.

TNDDA Meeting in Dallas, Texas

We have been researching the use of crowdsourcing for investment ideas. We will be sending a survey out in the next few weeks to get your input on the economy and the markets; and to get any investment ideas that you would like to share. We will compile this input and distribute the results to you and our other subscribers. We have been testing our crowdsourcing models with students and have been having good success and results.

Dr. Wendee has been researching and writing a new theory of economics known as, The Value Creation Theory of the Economy (also known as, Intrinsinomics). The full paper on Intrinsinomics will be published in the near future.

Finance 3350: Personal Finance-Portfolio & Risk Management– Dr. Wendee taught teaching Finance 3350 – Portfolio & Risk Management at California State University, Los Angeles (CSULA) for the Summer term starting May 2020. Dr. Wendee teaches courses in Management and Finance at CSULA.

Business 548: Strategy and Decision Making – Dr. Wendee taught Business 548 – Strategy and Decision Making at California Baptist University (CBU) starting at the end of June 2020. Dr. Wendee teaches courses in Finance, Business, Strategy & Decision Making, and Economics at CBU.

Business 303: Business Finance – Dr. Wendee taught Business 303 – Business Finance at California Baptist University (CBU) starting at the end of August 2020. Dr. Wendee teaches courses in Finance, Business, Strategy & Decision Making, and Economics at CBU.

Business 539: Financial Management – Dr. Wendee is teaching Business 539 – Financial Management at California Baptist University (CBU) which started at the end of October. Dr. Wendee teaches courses in Finance, Business, Strategy & Decision Making, and Economics at CBU.

Dr. Wendee presented a paper on his new theory of economics known as, The Value Creation Theory of the Economy (also known as, Intrinsinomics), at the International Leadership Association’s annual global conference which was held in Ottawa, Canada last Fall.

Dr. Wendee presented an updated paper on his new theory of economics known as, The Value Creation Theory of the Economy (also known as, Intrinsinomics), at the International Leadership Association’s annual global conference which was to have been held in San Francisco, California in November, but which was held virtually instead due to the Coronavirus.

Dr. Wendee delivered a talk entitled: Using Alternative Assets to Increase Portfolio Returns and Decrease Risk at the BrightTalk Q4 2020 Outlook Summit on October 28, 2020. You can access additional information on the summit and Dr. Wendee’s presentation here.

Dr. Wendee delivered a talk  at the BrightTalk conference on December 9, 2020 entitled: Emerging Themes and Great Places to Invest for 2021. You can access additional information on the summit and Dr. Wendee’s presentation here.

Dr. Wendee is working on a financial planning modeling program which will be available in the near future. The modeling program is designed to assist anyone in creating a financial plan and is customizable for each person’s unique financial planning goals. A working draft of the model is currently in beta test with students. Click this link, schematic, to go to the clickable document under the subheading Financial Planning Process (Draft) in the Intrinsic Value Wealth Report to see a draft of the schematic for the new financial planning process.

Dr. Wendee has been developing an econometric model specifically designed to monitor and forecast the global economy as this current economic crisis unfolds. This new econometric model is based on other econometric models that he has designed and have used for many years. You can find some of these earlier models in Book # 6 – Simple and Effective Economic Forecasting in the sister website to this website which is called the Intrinsic Value Wealth Report. The new econometric model has been constructed with some additional tools and methods that he has learned and some that he has developed over the last several years. He will be talking more about this new econometric model in this Commentary over the next few months. His comments and forecasts on the economy and the markets going forward will be based to a significant extent on this new model.

We have begun raising capital for our fund-of-funds investment, Northwest Quadrant Opportunity Fund, LLC. The fund engineers and constructs an investment vehicle consisting of Alternative Asset investments. The fund’s objective is to build a diversified portfolio of strong, solid, steady- performing assets, with highly qualified asset managers who have proven track records that meet our underwriting requirements. To learn more about the Northwest Quadrant Opportunity Fund, LLC and to obtain an offering memorandum, please click Northwest Quadrant Opportunity Fund, LLC.

Intrinsic Value Wealth Creation pyramid

We always conclude our commentary with a discussion of the Intrinsic Value Wealth Creation Pyramid. The Intrinsic Value Wealth Creation Pyramid is designed to show some of the major categories for building wealth. It is the result of many years of study of the wealth building process; experience working with clients who have built considerable wealth; and my own personal experience building wealth. Newsletter subscribers should consult the Intrinsic Value Wealth Creation Pyramid as one of many useful investment tools while considering their investment plans.

The chart in this section is an expanded version of the Intrinsic Value Wealth Creation Pyramid Chart referenced in the Forbes.com article entitled, Nine of the Best Ways to Build Wealth.

RESOURCES

See our Resources section for links to economic and other resources used in the preparation of this Commentary.

Posted in Economic & Business Chart Room, Economic Outlook, Entrepreneurship, Focus List, Investment Recommendations, Investments, Notes From The Field, Special Situations, Uncategorized, VDI/REEP, Visionary Ideas | Tagged , , , , , , , , , , , , , , , , , , , , , , , , , , , , , , , , , | Comments Off on WEEKLY COMMENTARY January 5, 2021

WEEKLY COMMENTARY December 29, 2020

It’s Not Different This Time – End-of-Year 2020 Thoughts

As I am writing this year-end commentary, I am reflecting on the year 2020 that is passing and the new year of 2021 on the horizon. I am seeing, like everyone else, the flood of predictions, forecasts, and places to invest in 2021 from any number of pundits who really have no idea what is going to happen; but feel the need to make these ridiculous 2021 predictions. I feel something tugging at me to do the same, lest I am left out of the prediction game. But I am not going to succumb to these animal instincts, or “animal spirits,” as Keynes (1936) called them. Instead, I am going to tell you what you need to hear – not what you want to hear. I am not here to entertain you. I am here to give you sound investment advice. If I have a few less people reading my newsletter, so be it! The ones who do read it and take to heart what I say will be much better prepared for 2021 and far beyond. Here is what you need to hear (these are not predictions – they are just realities).

First, and perhaps most importantly, we are in a very overvalued market. According to Advisor Perspectives (2021): “Our monthly market valuation updates have long had the same conclusion: US stock indexes are significantly overvalued, which suggests cautious expectations on investment returns. In a “normal” market environment — one with conventional business cycles, Federal Reserve policy, interest rates and inflation — current valuation levels would be a serious concern.”

The P/E ratio, while not the only good valuation metric, is often used for market valuation. It also has a lot of research behind it. When P/E ratios get high, as they are now, they revert to the mean. This can happen in one of two ways: (1) earnings improve; and/or (2) the price drops. As our discussion below on the economy suggests, earnings improvement may be difficult to achieve given the current economic climate. That leaves the price having to drop for the current market PE ratios to revert. Now as for predictions, I can’t tell you when that will happen. It may not even happen in 2021. But the P/E ratio will correct at some point in time. The historical record on that is well established.

We are currently quite likely in a financial bubble in many markets. Unfortunately, most people don’t realize when they are in a financial bubble and they keep investing as if it will be different this time. It won’t be different this time! It never is – history is very clear on this point.

The economy has been struggling to recover, but it keeps hitting headwinds as the pandemic surges on. I have written extensively on the economy in these commentaries this past year, so I won’t go into details here (you can review the past commentaries and upcoming commentaries in this newsletter to see our analysis). But as a quick summary, the U.S. and global economies have been severely impacted since the pandemic began in March and it will take quite some time for them to recover. The U.S. government is heavily in debt as a result of extraordinary stimulus efforts and the effects of the pandemic. Businesses and consumers are also heavily in debt. The debt situation is not new to the pandemic, but has been exasperated significantly since March. A Democratic Party dominated government going into 2021 poses, among other things, the risk of a pickup in inflation and further rising debt levels. Many economists, including some at the Fed, suggest it could take a decade or longer for the U.S. economy to fully recover. Any recovery will be hampered by high debt and inflation.

The pandemic continues to surge in countries around the world, especially in the U.S. The world now has two vaccines with more vaccines on the way. There are some delivery and distribution problems – science has been better at developing vaccines than governments have been at figuring out how to get the vaccines distributed to their populations (no surprise there!). Nonetheless, global economies won’t begin to recover in any significant way until the spread of the coronavirus is stopped. And most people and governments around the globe have shown that they are not capable of stopping the virus using social distancing and other common-sense measures. It will take the vaccines, and the widespread acceptance of the vaccines, to stop the virus. People and governments have shown that they can’t be relied upon to exercise the self-restraint necessary to curb the pandemic. Vaccines will have to save people from themselves.

There is a new administration in American politics. The Biden-Harris Administration appears to be shaping up as having a left-of-center to progressive-left focus. How that plays out in the financial markets is anyone’s guess. This is one area where I am going to particularly stay away from making any predictions. History has not been conclusive in its assessment of how different political regimes affect the markets.

So, how should we invest? The answer is to stay the course! The market is overvalued; the economy is struggling; the pandemic is still surging; and there is much uncertainty with a new U.S. political administration. What does stay the course mean? As I have been advising since the pandemic started, stay the course means to continue with your regular investing program if you have one – but don’t jump into overvalued markets in a big way. If you don’t have a regular investing program – start one. But again, go into the markets easy – don’t jump into overvalued markets in a big way.

When you are investing, be careful in your stock selection. You can find good values in good companies in any market; but there are of course more values to be found in undervalued markets. Unfortunately, we can’t pick our markets. We can only be prudent when investing in the markets that are given to us. A good rule to follow when investing in individual companies is to use what I call the Warren Buffett’s Three Rights – the Right company, with the Right people, at the Right price (see our August 18, 2020 Commentary for a discussion of this investment philosophy).

Remember also that what matters most in the long run for your investment program’s success is asset allocation. Asset allocation is what asset classes you invest in. Your investment results will be influenced more by what asset classes you are invested in (i.e., stocks, bonds, real estate, cash, etc.) and less by what individual companies you invested in, as long as you are well diversified.

Finally, I am reflecting on what two of the greatest investors of all time would do, and perhaps advise, in this market environment. The two investors I am talking about are Warrant Buffett and Philip Fisher. Both of these legendary investors are very long-term oriented investors and tend to hold good companies for very long periods of time. I watched an interview with Buffett (1996) recently with one of my MBA classes I teach in which Buffett explained why he keeps companies in which he invests so long: it is because it is so hard to find a good company, that he wants to hold onto a good company once he finds one.

Philip Fisher had a similar philosophy. Ken Fisher is Philip’s son and a legendary investor in his own right. I was reviewing Philip Fisher’s book, Common Stocks and Uncommon Profits (2003), the other night and noted what Ken said about his father’s philosophy on the markets. In Ken’s words: “Would he [his father] have worried about the myriad of other negatives in contemporary media, like corporate integrity, double-dip recession possibilities, high market price-earnings ratios, the risk of Brazil defaulting, or whatever? No, not much. He would have used this time while others focused on the wrong things to refocus on the basic fundamentals of the firms he owned and to see if he should still own them.”

References

Buffett, W. (1996). Warren Buffett: MBA Talk at University of North Carolina. University of North Carolina, University of North Carolina.

Fisher, P. A. (2003). Common stocks and uncommon profits. Hoboken, New Jersey, John Wiley & Sons.

Keynes, J. M. (1936). The general theory of employment, interest, and money. London, Macmillan.

Mislinski, J. (2021). “December 2020: Market valuation, inflation, and treasury yields.”  https://www.advisorperspectives.com/dshort/updates/2021/01/05/december-2020-market-valuation-inflation-and-treasury-yields.

Economic and Investment Highlights

Last Week

Small businesses are finding it difficult to get loans from banks.

Shell said it is writing down the value of its assets by as much as $4.5 billion and warned it would have poor earnings in Q4.

The Covid-19 vaccine from Pfizer and BioNTech was approved by the EU’s drug agency.

Airlines are planning to call back workers that had been laid off due to the coronavirus after Congress approved assistance to cover payrolls through the end of March.

Existing home sales fell 2.5% in November, the first decline in 6 months.

Household spending fell in November for the first time in seven months. Layoffs remain at high levels.

States and cities have instituted some of the most stringent curbs on business and social gatherings since spring to try to curb the spread of the virus.

The Dow and the Nasdaq rose for the week while the S&P 500 declined. The Dow was up 0.1%; the S&P 500 was down 0.17%; and the Nasdaq was up 0.4%. The 10-year treasury yield ended the week at 0.933%. Gold closed at $1,879.90 for the week. Oil closed at $48.23 for the week.

The Week Ahead

This link takes you to Econoday’s Economic Calendar and Economic Events and Analysis which shows the upcoming economic reporting events scheduled in the week and months ahead.

Summary

Note: The models below may not capture the impact of COVID-19 beyond their impact on GDP source data and relevant economic reports that have already been released. They may not anticipate the impact of COVID-19 on forthcoming economic reports beyond the standard internal dynamics of the models.

Note: The comments that follow are derived from the economic indicators referenced in the Resources section of this newsletter and other sources in this report.

The Aruoba-Diebold-Scotti Business Conditions Index (ALS) had been trending up for several weeks from having dipped in 2019. Recently with the advent of the economic collapse, the index crashed. It has now been generally trending down again, but fluctuating within a narrow band. This is a slightly positive indicator for the economy on a short-term basis.

The GDPNow model estimate for real GDP growth (seasonally adjusted annual rate) in the fourth quarter of 2020 is 8.5 percent. This reading agrees with the ALS model assessment of an improving short-term economic environment.

The New York Fed Staff Nowcast stands at 1.96 percent for 2020:Q4.

The Chicago Fed National Activity Index (CFNAI) showed an increase in economic activity in October. The Chicago Fed National Activity Index (CFNAI) was  was +0.27 in November, down from +1.01 in October.

All told, these short-term economic indicators are a mixed analysis for the economy, at least on a short-term basis.

Expectations that stock prices will rise over the next six months is now at 43.6% in a recent AAII Sentiment Survey. The historical average is 38.0% for the survey. 34.4% of the investors in the survey described their short-term outlook as neutral and 22.0% were bearish. Please see the AAII Sentiment Survey for the complete results.

The latest Gross Output (GO) reading (July 6, 2020) showed that Gross Output slowed significantly in the first quarter of 2020.

Advisor Perspectives publishes a monthly market valuation update.

Advisor Perspectives has market valuation and other useful and interesting investment information at this website.

Fourth Quarter 2020 Survey of Professional Forecasters

[Release Date: November 16, 2020] The outlook for real GDP growth in the next few quarters looks weaker now than it did three months ago, according to 37 forecasters surveyed by the Federal Reserve Bank of Philadelphia. The forecasters predict the economy will expand at an annual rate of 4.0 percent this quarter, lower than the prediction of 5.8 percent from the previous survey. On an annual-average over annual-average basis, the forecasters expect real GDP to decrease 3.5 percent this year but to recover and grow at an annual rate of between 2.1 percent to 4.0 percent over each of the following three years.

A downward revision to the projection for the unemployment rate accompanies the outlook for growth. The forecasters predict unemployment will decrease from a projected 7.0 percent this quarter to 5.8 percent in the fourth quarter of 2021. The prediction for the current-quarter unemployment rate is 2.5 percentage points lower than that of the last survey. On an annual-average basis, the panelists predict the unemployment rate will decline from a projected 8.2 percent in 2020 to 4.6 percent in 2023.

On the employment front, the forecasters expect job gains in the current quarter at a rate of 689,800 per month. The employment projections for the current and the following three quarters show upward revisions from those of the previous survey. The projections for the annual-average level of nonfarm payroll employment suggest job losses at a monthly rate of 718,000 in 2020 and job gains at a monthly rate of 321,600 in 2021. (These annual-average estimates are computed as the year-to-year change in the annual-average level of nonfarm payroll employment, converted to a monthly rate.) 

NABE Surveys

NABE Outlook Survey – December 2020

SUMMARY: “The NABE [National Association for Business Economics] Outlook panel anticipates more moderate growth in economic activity going forward after the sharp rebound during the third quarter,” said NABE President Manuel Balmaseda, CBE, chief economist, CEMEX. “The median forecast calls for a 4.1% annualized growth rate in the fourth quarter of 2020 for inflation-adjusted gross domestic product, or real GDP. In addition to the 33.1% GDP growth in the third quarter of the year, this would reverse much of the 32% annualized decline from the second quarter. However, the panel has become slightly less bullish about 2021. The median real GDP growth estimate for 2021 is 3.4%, slightly less than the 3.6% forecasted in the October survey.” “NABE panelists have become more optimistic, on balance, with nearly one-third revising their outlook higher based on recent news of effective vaccines,” added Survey Chair Holly Wade, executive director, NFIB Research Center. “Seventy-three percent of panelists believe that the economy will have returned to pre-pandemic GDP levels by the second half of 2021, 18% expect it to reach that level in the first half of 2022, and 10% believe it will occur in the second half of 2022 or later. The 73% is a dramatic improvement from the October survey in which 38% of panelists believed that a full recovery would occur before 2022. “Just over one-third of respondents anticipate more downside risk to economic growth in 2021,” continued Wade. “Panelists point to a second wave of COVID-19 cases as their main concern.”

The National Association for Business Economics (NABE) released its October Outlook Survey which is summarized as follows: “The NABE Outlook panel sees a strong rebound in economic activity after the collapse experienced during the second quarter,” said NABE Vice President Manuel Balmaseda, CBE, chief economist, CEMEX. “The median forecast calls for a 25% annualized growth rate in the third quarter of 2020 for inflation-adjusted gross domestic product, or real GDP. That would reverse much of the 31% annualized decline from the second quarter. However, the panel has become less bullish about the fourth quarter of 2020, as well as 2021. The median real GDP growth estimate for 2021 is 3.6%, compared to a 4.8% forecast in the June survey.”

“NABE panelists have become more optimistic, on balance, but remain concerned about a potential second wave of COVID-19,” added Outlook Survey Chair Eugenio Aleman, economist, Wells Fargo Bank. “Thirty-eight percent of panelists believe that the economy will have returned to pre-pandemic GDP levels by the second half of 2021, 32% expect it to reach that level in the first half of 2022, and 30% believe it will occur in the second half of 2022 or later.

“About half of the panelists put the odds of a double-dip recession at 20% or less,” continued Aleman. “In contrast, one out of eight panelists places those odds at 50% or higher.”

Other highlights from the survey:

The median forecast calls for the unemployment rate to average 8.4% in 2020, 2.5 percentage points lower than the median forecast in the previous survey. Panelists expect the unemployment rate to decline each quarter, averaging 6.8% in 2021, compared with the 8% previously forecasted. The unemployment rate averaged 3.7% in 2019.

Panelists look for business investment to drop sharply this year. Real nonresidential fixed investment is forecasted to decline 6%. Panelists anticipate real nonresidential fixed investment to rise only gradually in 2021, increasing 2.4%.

Survey respondents expect inflation—as measured by the GDP price index—to be significantly lower in 2020 and 2021 relative to 2019. Inflation is forecasted to be 1.0% in 2020 and 1.5% in 2021. The index increased 1.8% in 2019.

Panelists expect the consumer price index (CPI) to rise 1.2% in 2020, significantly lower than the actual 1.8% growth in consumer prices in 2019. The 2020 forecast median has increased since the June survey, when panelists saw CPI rising by 0.7%. The panel anticipates consumer price growth will pick up moving forward, with a 1.9% annual average gain in 2021.

Panelists expect corporate profits to contract by 11% in 2020. The median forecast calls for profits to increase by 8.5% in 2021.

Four out of ten panelists indicate that 5% of jobs will be permanently lost due to firms closing. More than half of the panel suggest between 10% and 20% of job losses will be permanent.

Thirty-eight percent of panelists believe that the economy will have returned to pre-pandemic GDP levels by the second half of 2021; only 2% suggest this will occur before the end of 2020, 12% believe GDP will recover in the first half of 2021, and 24% anticipate such a return in the second half of 2021. Thirty-two percent of respondents expect GDP to reach pre-pandemic levels in the first half of 2022, and 22% believe it will occur in the second half of 2022.

For a more in-depth review and analysis of the economy, please see our mini-book on economic analysis and forecasting entitled: Simple and Effective Economic Forecasting.

NABE October Business Conditions Survey

“The October NABE Business Conditions Survey shows that firms are continuing to gain ground since the sharp economic downturn experienced in the first half of the year,” said NABE President Manuel Balmaseda, CBE, chief economist, CEMEX. “This momentum is expected to continue through the rest of 2020. In addition, more respondents than in the July survey anticipate stronger growth in inflation-adjusted gross domestic product over the next year.”  “More respondents in this survey report continued improvements, especially in sales and profit margins, at their firms during the past three months than in the July survey,” added NABE Business Conditions Survey Chair Holly Wade, executive director, NFIB Research Center. “Capital spending is also picking up steam, with more firms investing in their businesses over the past three months, and more planning to do the same in the next three months. “The employment picture is less rosy, with many firms still holding back on wage and staff increases,” continued Wade. “While slightly more respondents report an increase in employment at their firms over the last three months than in the previous survey, more also report a decrease in employment. Most firms are also forgoing raises to control costs with 70% of respondents’ firms reporting unchanged wages and salaries over the last two quarters, the highest reading since January 2014.”

Higlights

• The panel’s consensus outlook for the U.S. economy, measured by year-over-year growth in inflation-adjusted gross domestic product (real GDP), continued to improve in October compared to that in the two previous surveys. Eighty-nine percent of panelists expect real GDP to increase from the third quarter (Q3) of 2020 to Q3 2021. Only 9% of respondents expect the real GDP change to be zero or negative, compared to 31% of respondents who held this view in the July survey when asked about the outlook for the 12 months ending Q2 2021.

• For the first time since April 2019, a majority of respondents’ firms reports increased sales at their firms, with 52% indicating rising sales during Q3. The Net Rising Index (NRI) for sales—the percentage of panelists reporting rising sales minus the percentage reporting falling sales—surged upward, increasing 47 points to 33, up from -14 in July. The forward-looking NRI for anticipated sales over the next three months also rose, adding to the sharp increase reported in the July survey. The NRI for anticipated sales increased 13 points, from 18 in July to 31, with positive readings in three of the four industry sectors.

• Profit-margin increases were more widespread in Q3 2020, but remained less prevalent than decreases among respondents’ firms, with the NRI for profit margins increasing 21 points to -4. The share of respondents reporting rising profit margins increased from 15% in July to 21% in October, while the percentage reporting falling margins declined 15 percentage points—from 40% in July to 25% in October.

• The NRI for prices charged returned to neutral in October—registering +1—following the sharp decline during the first half of 2020, that brought the NRI in July to its lowest level since 1987. NRIs by sector, however, vary significantly. The NRI for goods-producing firms is 21, after registering -40 in July. But the index for finance, insurance, real estate (FIRE) sector firms remains negative with an NRI of -19. Between these extremes are the NRI for services, with a reading of 3, and the NRI of 8 for the transportation, utilities, information, communications (TUIC) sector. The share of respondents expecting price increases in the next three months rebounded from levels in the previous two surveys to 26% in October, resulting in an NRI of 20. Six percent anticipate falling prices in the next three months.

• The NRI for materials costs also rebounded from two quarters of negative readings to a reading of 10. All sectors registered positive NRIs, led by goods-producers at 15, bouncing back from -56 in July. The NRI for expected costs rose modestly, from 1 to 8, having been as low as -21 in April.

• Hiring at respondents’ firms remains depressed. The third-quarter NRI for employment levels over the last three months is -17, compared to -19 in the July survey. Even as the NRI improved, the share of respondents indicating there was decline in employment at their firms rose to 27% from 24% in the July survey. At the same time, 9% report employment increases at their firms, compared to 5% in July. The outlook for employment deteriorated in Q3, as the NRI for hiring expectations declined to just 1, down from 6 in the July survey. Respondents from the goods-producing and TUIC sectors expect their firms will add jobs in the next three months. In the July survey, three of the four sectors had positive NRIs for expected employment change in Q3 2020.

• The NRI for wages and salaries rebounded 13 points to 4 in the October survey. The upward movement in the index reflects an increase to 17% from 11% in July in the share of respondents citing rising wages, and a decrease to 13% from 19% in the share reporting falling wages. The forward-looking NRI for wages and salaries moved from 0 in July to 15 in October.

• Almost two-thirds of respondents report no shortages of inputs in Q3 2020, similar to results from the July survey. The share of respondents reporting shortages is virtually unchanged in the current survey across all inputs, except for a decline in the percentage indicating intermediate input shortages.

• The NRI for capital spending improved, from -19 in July to -8 in October. Fewer respondents report continuing declines in spending, while more indicate their firms’ capital spending increased during Q3 2020. However, service-sector panelists report not much improvement from the prior two readings. The forward-looking NRI for capital spending rose considerably, from -40 in April to 6 in October, as fewer respondents expect declines in spending over the next 3 months.

• In response to COVID-19, businesses continue to adjust employee headcount and wages. Imposing a hiring freeze is the most common response, cited by 69% of respondents.

• Respondents’ near-term outlook improved slightly in October compared to that in the July survey. Thirty-six percent of respondents report a “Better” near-term in October, compared to 34% in July. Only 8% indicate their near-term outlook is “Worse” in October, compared to 12% in July.

• Twenty-three percent of respondents report that sales at their companies are at “more than 100% of pre-crisis level,” an increase from the 15% in the July survey.

• Thirty-one percent of respondents expect sales to return to normal “sometime in 2021,” while 24% do not expect sales to return to normal until sometime in 2022. Only 10% expect sales to return to normal by the end of 2020.

• Only 3% of respondents report that their firms applied, or are planning to apply, for Main Street Lending programs.

• Thirty-five percent of respondents indicate their firms have implemented new work-at-home policies, allowing “all employees” to work from home during the pandemic. Another 33% allow “most employees” to work from home, while 16% only allow “some employees” to work from home.

• Thirty-one percent of respondents report that their firms will wait for “progress regarding COVID-19” before changing their work-from-home policies. Twenty-two percent indicate their companies will wait until the second half of 2021, while 16% of firms plan to suspend work-from-home policies in the first half of 2021.

Stock Market Valuations

Our estimates of the market valuations for two stock market indices, the Dow Jones Industrial Average (DJIA) and the Standard & Poor’s 500 (S&P 500), can be found in the file below:

Conclusion

During this time of global flux due to the coronavirus, I am leaving the Conclusion discussion below the same as was posted on March 23, 2020. The March 23, 2020 discussion still adequately reflects my thinking on the current state of affairs.

Important Note: While I don’t believe it is time to jump back into the stock market in a big way because of the market’s overvaluation, I have been advising the last few of weeks in this Commentary and in my weekly podcast, Intrinsic Value Wealth Report Radio, that investors can continue building their investment portfolios by selecting individual securities that offer growth and value opportunities.

Reprinted from March 23, 2020

Up until the past week, the economy had been in a stable but somewhat vulnerable state. Nonetheless, it had remained fairly strong. In fact, robust consumer spending and strong labor market conditions had given us confidence that the economy, which had been in its tenth year of expansion, could continue to grow. But we were cautious on this outlook. There were several reasons for our caution. U.S. business growth had been mixed. And global economic growth had been mixed as well. The new coronavirus was becoming a global economic threat, although it was still too early to tell how much of an effect it would ultimately have. Debt is at high levels for consumers, businesses, and government (at all levels of government). Finally, this is an election year that will likely have significant consequences either positively or negatively depending on the outcome of the elections. And of course, it is still too early to tell what the outcome of the elections will be.

In just a few days, the coronavirus’s effect on the economy and the markets went from a ripple to a tsunami. Businesses are shuttering, events are being cancelled or postponed, grocery store shelves are empty, and people are being asked or ordered to stay home. The markets are now deep in bear market territory. The effects on the economy, even given the short time that the economy has been retreating, may be with us for a long time. There is now a much greater risk of a recession, and there has even been some talk of a depression. The government, the Fed, Republicans, and Democrats, and pretty much the entire country, is trying to get the virus under control and is coming up with plans to mitigate the long-term economic effects caused by the virus. But the virus has impacted the economy – in a significant way – in just a short time. How long lasting the effects will be no one can tell right now. The economy has been largely shut down and remains so today. It takes time to restart the economy after a situation such as what is occurring at the present time.

Given these events and the rapidly deteriorating situation, as I said last week, I would caution not to panic. The economy and the markets will get better. The situation is bad – there is no doubt about that – but it will turn around. The real question is when will it turn around? No one knows that at the present time. But it will turn around.

For now, review your investment portfolios. It is highly likely that all or most of your stocks are down. You should not consider selling the bulk of your stocks – only consider selling companies that are not sound companies. But do recognize that as the economy deteriorates, even good companies will be affected.

For stock market value hunters, we believe it is still too early to jump back in. We will be closely monitoring the markets using the many tools and models that we have developed over the years to assess the economy and the markets. We will use our best judgement and thoughts to let you know when we believe things are turning around. The turnaround hasn’t happened yet.

We believe it is important to maintain a long-term view toward investing. But for now, just sit tight. Eventually, this means that you should continue building your investment portfolio using the Cassandra Stock Selection Model to select individual securities that offer growth and value opportunities.

Chart for Review and Thought

Federal Debt: Total Public Debt

Simple and Effective Economic Forecasting Model

Note: The table and chart below have not been updated. However, we believe that a recession is quite likely. In the chart below, the bottom green line shows what a recession could look like.

Notes (GDP Growth Chart):

  1. See the July 8, 2019 Commentary for an introduction to this model.
  2. Actual numbers 2007 through 2019; forecasted numbers thereafter.
  3. Normal GDP growth is typically in the 2% to 3% range.
  4. A recession is generally defined as two consecutive quarters of negative economic growth as measured by a country’s gross domestic product (GDP).

Thought for the Week

“Wendee’s Law of the Big Picture: Get the big picture first, then fill in the details” ~ Dr. Paul M. Wendee

Announcements

The Intrinsic Value Wealth Report has started a new YouTube channel called Intrinsic Value Wealth Report TV. You can view the YouTube channel at Intrinsic Value Wealth Report TV.

The Intrinsic Value Wealth Report has started a new podcast called Intrinsic Value Wealth Report Radio. You can listen to the podcast at Intrinsic Value Wealth Report Radio.

Dr. Wendee spoke at the Investment Club of America’s annual economic summit, called Econosummit, on Sunday March 1, 2020 in Las Vegas.

Dr. Wendee attended the The National Due Diligence Alliance (TNDDA) investment banking conference, which was held March 6-8, 2020 at the Four Seasons Resort in Dallas, Texas. This is a conference held several times throughout the year for investment bankers and registered investment advisers to learn about new opportunities in the Alternative Investment asset classes.

TNDDA Meeting in Dallas, Texas

We have been researching the use of crowdsourcing for investment ideas. We will be sending a survey out in the next few weeks to get your input on the economy and the markets; and to get any investment ideas that you would like to share. We will compile this input and distribute the results to you and our other subscribers. We have been testing our crowdsourcing models with students and have been having good success and results.

Dr. Wendee has been researching and writing a new theory of economics known as, The Value Creation Theory of the Economy (also known as, Intrinsinomics). The full paper on Intrinsinomics will be published in the near future.

Finance 3350: Personal Finance-Portfolio & Risk Management– Dr. Wendee taught teaching Finance 3350 – Portfolio & Risk Management at California State University, Los Angeles (CSULA) for the Summer term starting May 2020. Dr. Wendee teaches courses in Management and Finance at CSULA.

Business 548: Strategy and Decision Making – Dr. Wendee taught Business 548 – Strategy and Decision Making at California Baptist University (CBU) starting at the end of June 2020. Dr. Wendee teaches courses in Finance, Business, Strategy & Decision Making, and Economics at CBU.

Business 303: Business Finance – Dr. Wendee taught Business 303 – Business Finance at California Baptist University (CBU) starting at the end of August 2020. Dr. Wendee teaches courses in Finance, Business, Strategy & Decision Making, and Economics at CBU.

Business 539: Financial Management – Dr. Wendee is teaching Business 539 – Financial Management at California Baptist University (CBU) which started at the end of October. Dr. Wendee teaches courses in Finance, Business, Strategy & Decision Making, and Economics at CBU.

Dr. Wendee presented a paper on his new theory of economics known as, The Value Creation Theory of the Economy (also known as, Intrinsinomics), at the International Leadership Association’s annual global conference which was held in Ottawa, Canada last Fall.

Dr. Wendee presented an updated paper on his new theory of economics known as, The Value Creation Theory of the Economy (also known as, Intrinsinomics), at the International Leadership Association’s annual global conference which was to have been held in San Francisco, California in November, but which was held virtually instead due to the Coronavirus.

Dr. Wendee delivered a talk entitled: Using Alternative Assets to Increase Portfolio Returns and Decrease Risk at the BrightTalk Q4 2020 Outlook Summit on October 28, 2020. You can access additional information on the summit and Dr. Wendee’s presentation here.

Dr. Wendee delivered a talk  at the BrightTalk conference on December 9, 2020 entitled: Emerging Themes and Great Places to Invest for 2021. You can access additional information on the summit and Dr. Wendee’s presentation here.

Dr. Wendee is working on a financial planning modeling program which will be available in the near future. The modeling program is designed to assist anyone in creating a financial plan and is customizable for each person’s unique financial planning goals. A working draft of the model is currently in beta test with students. Click this link, schematic, to go to the clickable document under the subheading Financial Planning Process (Draft) in the Intrinsic Value Wealth Report to see a draft of the schematic for the new financial planning process.

Dr. Wendee has been developing an econometric model specifically designed to monitor and forecast the global economy as this current economic crisis unfolds. This new econometric model is based on other econometric models that he has designed and have used for many years. You can find some of these earlier models in Book # 6 – Simple and Effective Economic Forecasting in the sister website to this website which is called the Intrinsic Value Wealth Report. The new econometric model has been constructed with some additional tools and methods that he has learned and some that he has developed over the last several years. He will be talking more about this new econometric model in this Commentary over the next few months. His comments and forecasts on the economy and the markets going forward will be based to a significant extent on this new model.

We have begun raising capital for our fund-of-funds investment, Northwest Quadrant Opportunity Fund, LLC. The fund engineers and constructs an investment vehicle consisting of Alternative Asset investments. The fund’s objective is to build a diversified portfolio of strong, solid, steady- performing assets, with highly qualified asset managers who have proven track records that meet our underwriting requirements. To learn more about the Northwest Quadrant Opportunity Fund, LLC and to obtain an offering memorandum, please click Northwest Quadrant Opportunity Fund, LLC.

Intrinsic Value Wealth Creation pyramid

We always conclude our commentary with a discussion of the Intrinsic Value Wealth Creation Pyramid. The Intrinsic Value Wealth Creation Pyramid is designed to show some of the major categories for building wealth. It is the result of many years of study of the wealth building process; experience working with clients who have built considerable wealth; and my own personal experience building wealth. Newsletter subscribers should consult the Intrinsic Value Wealth Creation Pyramid as one of many useful investment tools while considering their investment plans.

The chart in this section is an expanded version of the Intrinsic Value Wealth Creation Pyramid Chart referenced in the Forbes.com article entitled, Nine of the Best Ways to Build Wealth.

RESOURCES

See our Resources section for links to economic and other resources used in the preparation of this Commentary.

Posted in Economic & Business Chart Room, Economic Outlook, Entrepreneurship, Focus List, Investment Recommendations, Investments, Notes From The Field, Special Situations, Uncategorized, VDI/REEP, Visionary Ideas | Tagged , , , , , , , , , , , , , , , , , , , , , , , , , , , , , , , , , | Comments Off on WEEKLY COMMENTARY December 29, 2020

WEEKLY COMMENTARY December 22, 2020

Convertible Securities

Last week, we announced that we have resumed coverage of convertible securities. The following is a brief discussion of convertible bonds.

Characteristics

Convertible securities include financial instruments such as convertible bonds, convertible preferred stocks, and warrants. Convertible securities can be converted into common stock at the holder’s option. Because of the convertibility feature, these “hybrid” securities reflect movements in both stock prices and interest rates.

Convertibles often follow a pattern shown in the chart shown below (see file):

Source: Adapted from Knecht & McCowin (1989)

Convertibles, when initially issued to the market, often trade in the Hybrid Region of the chart (the region between approximately Stock Price 15 to 37 as shown on this chart). In the Hybrid Region, convertibles are sensitive to both interest rates and the price of the underlying equity. The distance between the equity value of the convertible and the market value of the convertible is the premium that is paid for the conversion option. As the common stock price rises in the market, the market price of the convertible will tend to be dominated by the movement of the underlying stock in the stock market. Conversely, as the stock market price of the equity declines, the market price of the convertible will be dominated more by the prices of fixed income securities. The prices of fixed income securities that are equivalent to the fixed income component of the convertible will tend to put a floor on the market price of the convertible. The floor value is the price at which a non-convertible bond with similar features to the fixed income component of the convertible bond will trade. The floor value will, of course, fluctuate along with general interest rates, the credit quality of the convertible issuer, and other factors.

Periodically, we choose a convertible security to highlight in this newsletter. The stocks underlying the convertibles we review are ranked by the Cassandra Model in the same manner as other stocks in our Cassandra Stock Selection Model Candidate List. We also use other models to evaluate convertibles as discussed below. You can find our convertible securities listings in the Investment tab of the Intrinsic Value Wealth Report Newsletter.

Advantages and Disadvantages

The following are some of the key advantages and disadvantages to convertible bonds for the investor:

Advantages

  1. Convertibles share characteristics with both bonds and stocks, giving investors the opportunity to participate in the stock appreciation when stock prices rise but having a floor of the bond value if stock prices decline.
  2. Convertibles typically have low correlation with other asset classes, including both stocks and bonds, because of their hybrid nature.
  3. Convertible bonds rank ahead of common stock and preferred stock in company liquidations, but usually are subordinated to other senior debt in the company.
  4. Convertible securities have generally performed well over time. According to the Wall Street Journal (2020), “Convertible bonds in the Reuters Qualified Global Convertible Index are up almost 22% this year [as of November 3, 2020].”

Disadvantages

  1. Investors often pay a premium over the value of the underlying common stock and often have to accept less fixed income yield as the cost of having the conversion feature.
  2. Convertible prices may drop below the initially expected bond floor price if the credit quality of the issuer deteriorates, as often happens when stock prices decline because company performance is deteriorating.
  3. Convertibles are often issued by riskier companies such as newer companies and companies that are experiencing financial hardship.

Our Models

We use an extensive array of investment analysis models to evaluate the convertible securities in our universe. The following are some of the key models that we use:

  1. Cassandra Model – our proprietary stock-picking model.
  2. Break-Even and Other Convertible Analysis Models – standard convertible securities models used by professionals who evaluate convertible securities.
  3. Black Scholes Option Pricing Model – because convertible securities are a fixed income security with an attached option (warrant) to convert to the commons stock, the Black Scholes model is used to price the conversion option of convertibles.
  4. Binomial Option Pricing Model – because convertible securities are a fixed income security with an attached option (warrant) to convert to the commons stock, the Binomial model is used to price the conversion option of convertibles. The Black Scholes model is a special case of the Binomial model. We use both the Black Scholes and the Binomial models in our convertible securities research.

Convertible Funds

For most investors, we believe that they would be best served by investing in convertible securities funds. This is because convertible securities are complex financial instruments that are difficult for the average investor to understand and evaluate on their own. It is also difficult to find good convertible securities in which to invest, as the convertible securities market is dominated by institutional investors (mutual funds, hedge funds, pension funds, etc.) and many of the better convertible securities are not available to individual investors.

We provide the individual securities in this report for the more sophisticated investors who choose to buy individual securities for their portfolios and who have the knowledge and experience to evaluate and monitor the convertible ideas that we present in this report. It is important to remember that investors in individual securities must continue to monitor their convertibles after purchase for such things as credit quality changes, call provisions, etc. For these reasons and others, we suggest that most investors should invest in good quality convertible securities funds where they can benefit from the expertise and experience of the fund managers.

Accordingly, we also include in the Intrinsic Value Wealth Report Newsletter a listing of convertible securities funds that we believe should be considered by investors who want to invest in this important segment of the investment market.

References and Further Reading

Knecht, L. and McCowin, M. (1989). Valuing Convertible Securities. In Fabozzi, F. (Ed), Advances & Innovations in the Bond and Mortgage Markets (pp. 97-116). Chicago: Probus.

Ostroff, C. and P. J. Davies (2020). Convertible-bond issuance soars as investors enjoy solid returns. The Wall Street Journal. New York, Dow Jones. November 3, 2020 p. B1.

Ritchie, J. C. (1991). Convertible securities and warrants. The Handbook of Fixed Income Securities. F. J. Fabozzi. Homewood, Illinois, Business One Irwin: 300-318.

Economic and Investment Highlights

Last Week

Valuations of recent IPOs are at their highest levels since the dot-com bubble.

Spy novelist, John le Carre, died. He was 89 years old.

The Electoral College affirmed Joe Biden’s presidential victory.

Consumer spending in the U.S. was muted in November.

Bitcoin rose above $20,000 for the first time in its 12-year history.

Robinhood agreed to pay $65 million in fines to settle SEC claims on nondisclosure of business activities.

Coca-Cola will lay off 2,200 employees globally, including 1,200 in the U.S,

Coinbase Global has filed with the SEC for an IPO, the first major bitcoin company to do so.

French President Macron tested positive for Covid-19.

Jobless claims continue to climb in the U.S.

Tesla will join the S&P 500 on Monday.

The FDA authorized use of Moderna’s Covid-19 vaccine. It joins the Pfizer vaccine as the second of the first two vaccines for Covid-19 in the U.S.

Trump signed a two-day spending bill to prevent a partial government shutdown.

The Fed warned of the potential impact to the economy from the coronavirus crisis.

The Dow, the S&P 500, and the Nasdaq all rose for the week. The Dow was up 0.4%; the S&P 500 was up 1.25%; and the Nasdaq was up 3.1%. The 10-year treasury yield ended the week at 0.947%. Gold closed at $1,885.70 for the week. Oil closed at $49.10 for the week.

The Week Ahead

This link takes you to Econoday’s Economic Calendar and Economic Events and Analysis which shows the upcoming economic reporting events scheduled in the week and months ahead.

Summary

Note: The models below may not capture the impact of COVID-19 beyond their impact on GDP source data and relevant economic reports that have already been released. They may not anticipate the impact of COVID-19 on forthcoming economic reports beyond the standard internal dynamics of the models.

Note: The comments that follow are derived from the economic indicators referenced in the Resources section of this newsletter and other sources in this report.

The Aruoba-Diebold-Scotti Business Conditions Index (ALS) had been trending up for several weeks from having dipped in 2019. Recently with the advent of the economic collapse, the index crashed. It has now been generally trending down again, but fluctuating within a narrow band. This is a slightly positive indicator for the economy on a short-term basis.

The GDPNow model estimate for real GDP growth (seasonally adjusted annual rate) in the fourth quarter of 2020 is 11.2 percent. This reading agrees with the ALS model assessment of an improving short-term economic environment.

The New York Fed Staff Nowcast stands at 2.45 percent for 2020:Q4.

The Chicago Fed National Activity Index (CFNAI) showed an increase in economic activity in October. The Chicago Fed National Activity Index (CFNAI) was  was +0.83 in October, up from +0.32 in September.

All told, these short-term economic indicators are a mixed analysis for the economy, at least on a short-term basis.

Expectations that stock prices will rise over the next six months is now at 48.1% in a recent AAII Sentiment Survey. The historical average is 38.0% for the survey. 25.1% of the investors in the survey described their short-term outlook as neutral and 26.9% were bearish. Please see the AAII Sentiment Survey for the complete results.

The latest Gross Output (GO) reading (July 6, 2020) showed that Gross Output slowed significantly in the first quarter of 2020.

Advisor Perspectives publishes a monthly market valuation update.

Advisor Perspectives has market valuation and other useful and interesting investment information at this website.

Fourth Quarter 2020 Survey of Professional Forecasters

[Release Date: November 16, 2020] The outlook for real GDP growth in the next few quarters looks weaker now than it did three months ago, according to 37 forecasters surveyed by the Federal Reserve Bank of Philadelphia. The forecasters predict the economy will expand at an annual rate of 4.0 percent this quarter, lower than the prediction of 5.8 percent from the previous survey. On an annual-average over annual-average basis, the forecasters expect real GDP to decrease 3.5 percent this year but to recover and grow at an annual rate of between 2.1 percent to 4.0 percent over each of the following three years.

A downward revision to the projection for the unemployment rate accompanies the outlook for growth. The forecasters predict unemployment will decrease from a projected 7.0 percent this quarter to 5.8 percent in the fourth quarter of 2021. The prediction for the current-quarter unemployment rate is 2.5 percentage points lower than that of the last survey. On an annual-average basis, the panelists predict the unemployment rate will decline from a projected 8.2 percent in 2020 to 4.6 percent in 2023.

On the employment front, the forecasters expect job gains in the current quarter at a rate of 689,800 per month. The employment projections for the current and the following three quarters show upward revisions from those of the previous survey. The projections for the annual-average level of nonfarm payroll employment suggest job losses at a monthly rate of 718,000 in 2020 and job gains at a monthly rate of 321,600 in 2021. (These annual-average estimates are computed as the year-to-year change in the annual-average level of nonfarm payroll employment, converted to a monthly rate.) 

NABE Surveys

NABE Outlook Survey – December 2020

SUMMARY: “The NABE [National Association for Business Economics] Outlook panel anticipates more moderate growth in economic activity going forward after the sharp rebound during the third quarter,” said NABE President Manuel Balmaseda, CBE, chief economist, CEMEX. “The median forecast calls for a 4.1% annualized growth rate in the fourth quarter of 2020 for inflation-adjusted gross domestic product, or real GDP. In addition to the 33.1% GDP growth in the third quarter of the year, this would reverse much of the 32% annualized decline from the second quarter. However, the panel has become slightly less bullish about 2021. The median real GDP growth estimate for 2021 is 3.4%, slightly less than the 3.6% forecasted in the October survey.” “NABE panelists have become more optimistic, on balance, with nearly one-third revising their outlook higher based on recent news of effective vaccines,” added Survey Chair Holly Wade, executive director, NFIB Research Center. “Seventy-three percent of panelists believe that the economy will have returned to pre-pandemic GDP levels by the second half of 2021, 18% expect it to reach that level in the first half of 2022, and 10% believe it will occur in the second half of 2022 or later. The 73% is a dramatic improvement from the October survey in which 38% of panelists believed that a full recovery would occur before 2022. “Just over one-third of respondents anticipate more downside risk to economic growth in 2021,” continued Wade. “Panelists point to a second wave of COVID-19 cases as their main concern.”

The National Association for Business Economics (NABE) released its October Outlook Survey which is summarized as follows: “The NABE Outlook panel sees a strong rebound in economic activity after the collapse experienced during the second quarter,” said NABE Vice President Manuel Balmaseda, CBE, chief economist, CEMEX. “The median forecast calls for a 25% annualized growth rate in the third quarter of 2020 for inflation-adjusted gross domestic product, or real GDP. That would reverse much of the 31% annualized decline from the second quarter. However, the panel has become less bullish about the fourth quarter of 2020, as well as 2021. The median real GDP growth estimate for 2021 is 3.6%, compared to a 4.8% forecast in the June survey.”

“NABE panelists have become more optimistic, on balance, but remain concerned about a potential second wave of COVID-19,” added Outlook Survey Chair Eugenio Aleman, economist, Wells Fargo Bank. “Thirty-eight percent of panelists believe that the economy will have returned to pre-pandemic GDP levels by the second half of 2021, 32% expect it to reach that level in the first half of 2022, and 30% believe it will occur in the second half of 2022 or later.

“About half of the panelists put the odds of a double-dip recession at 20% or less,” continued Aleman. “In contrast, one out of eight panelists places those odds at 50% or higher.”

Other highlights from the survey:

The median forecast calls for the unemployment rate to average 8.4% in 2020, 2.5 percentage points lower than the median forecast in the previous survey. Panelists expect the unemployment rate to decline each quarter, averaging 6.8% in 2021, compared with the 8% previously forecasted. The unemployment rate averaged 3.7% in 2019.

Panelists look for business investment to drop sharply this year. Real nonresidential fixed investment is forecasted to decline 6%. Panelists anticipate real nonresidential fixed investment to rise only gradually in 2021, increasing 2.4%.

Survey respondents expect inflation—as measured by the GDP price index—to be significantly lower in 2020 and 2021 relative to 2019. Inflation is forecasted to be 1.0% in 2020 and 1.5% in 2021. The index increased 1.8% in 2019.

Panelists expect the consumer price index (CPI) to rise 1.2% in 2020, significantly lower than the actual 1.8% growth in consumer prices in 2019. The 2020 forecast median has increased since the June survey, when panelists saw CPI rising by 0.7%. The panel anticipates consumer price growth will pick up moving forward, with a 1.9% annual average gain in 2021.

Panelists expect corporate profits to contract by 11% in 2020. The median forecast calls for profits to increase by 8.5% in 2021.

Four out of ten panelists indicate that 5% of jobs will be permanently lost due to firms closing. More than half of the panel suggest between 10% and 20% of job losses will be permanent.

Thirty-eight percent of panelists believe that the economy will have returned to pre-pandemic GDP levels by the second half of 2021; only 2% suggest this will occur before the end of 2020, 12% believe GDP will recover in the first half of 2021, and 24% anticipate such a return in the second half of 2021. Thirty-two percent of respondents expect GDP to reach pre-pandemic levels in the first half of 2022, and 22% believe it will occur in the second half of 2022.

For a more in-depth review and analysis of the economy, please see our mini-book on economic analysis and forecasting entitled: Simple and Effective Economic Forecasting.

NABE October Business Conditions Survey

“The October NABE Business Conditions Survey shows that firms are continuing to gain ground since the sharp economic downturn experienced in the first half of the year,” said NABE President Manuel Balmaseda, CBE, chief economist, CEMEX. “This momentum is expected to continue through the rest of 2020. In addition, more respondents than in the July survey anticipate stronger growth in inflation-adjusted gross domestic product over the next year.”  “More respondents in this survey report continued improvements, especially in sales and profit margins, at their firms during the past three months than in the July survey,” added NABE Business Conditions Survey Chair Holly Wade, executive director, NFIB Research Center. “Capital spending is also picking up steam, with more firms investing in their businesses over the past three months, and more planning to do the same in the next three months. “The employment picture is less rosy, with many firms still holding back on wage and staff increases,” continued Wade. “While slightly more respondents report an increase in employment at their firms over the last three months than in the previous survey, more also report a decrease in employment. Most firms are also forgoing raises to control costs with 70% of respondents’ firms reporting unchanged wages and salaries over the last two quarters, the highest reading since January 2014.”

Higlights

• The panel’s consensus outlook for the U.S. economy, measured by year-over-year growth in inflation-adjusted gross domestic product (real GDP), continued to improve in October compared to that in the two previous surveys. Eighty-nine percent of panelists expect real GDP to increase from the third quarter (Q3) of 2020 to Q3 2021. Only 9% of respondents expect the real GDP change to be zero or negative, compared to 31% of respondents who held this view in the July survey when asked about the outlook for the 12 months ending Q2 2021.

• For the first time since April 2019, a majority of respondents’ firms reports increased sales at their firms, with 52% indicating rising sales during Q3. The Net Rising Index (NRI) for sales—the percentage of panelists reporting rising sales minus the percentage reporting falling sales—surged upward, increasing 47 points to 33, up from -14 in July. The forward-looking NRI for anticipated sales over the next three months also rose, adding to the sharp increase reported in the July survey. The NRI for anticipated sales increased 13 points, from 18 in July to 31, with positive readings in three of the four industry sectors.

• Profit-margin increases were more widespread in Q3 2020, but remained less prevalent than decreases among respondents’ firms, with the NRI for profit margins increasing 21 points to -4. The share of respondents reporting rising profit margins increased from 15% in July to 21% in October, while the percentage reporting falling margins declined 15 percentage points—from 40% in July to 25% in October.

• The NRI for prices charged returned to neutral in October—registering +1—following the sharp decline during the first half of 2020, that brought the NRI in July to its lowest level since 1987. NRIs by sector, however, vary significantly. The NRI for goods-producing firms is 21, after registering -40 in July. But the index for finance, insurance, real estate (FIRE) sector firms remains negative with an NRI of -19. Between these extremes are the NRI for services, with a reading of 3, and the NRI of 8 for the transportation, utilities, information, communications (TUIC) sector. The share of respondents expecting price increases in the next three months rebounded from levels in the previous two surveys to 26% in October, resulting in an NRI of 20. Six percent anticipate falling prices in the next three months.

• The NRI for materials costs also rebounded from two quarters of negative readings to a reading of 10. All sectors registered positive NRIs, led by goods-producers at 15, bouncing back from -56 in July. The NRI for expected costs rose modestly, from 1 to 8, having been as low as -21 in April.

• Hiring at respondents’ firms remains depressed. The third-quarter NRI for employment levels over the last three months is -17, compared to -19 in the July survey. Even as the NRI improved, the share of respondents indicating there was decline in employment at their firms rose to 27% from 24% in the July survey. At the same time, 9% report employment increases at their firms, compared to 5% in July. The outlook for employment deteriorated in Q3, as the NRI for hiring expectations declined to just 1, down from 6 in the July survey. Respondents from the goods-producing and TUIC sectors expect their firms will add jobs in the next three months. In the July survey, three of the four sectors had positive NRIs for expected employment change in Q3 2020.

• The NRI for wages and salaries rebounded 13 points to 4 in the October survey. The upward movement in the index reflects an increase to 17% from 11% in July in the share of respondents citing rising wages, and a decrease to 13% from 19% in the share reporting falling wages. The forward-looking NRI for wages and salaries moved from 0 in July to 15 in October.

• Almost two-thirds of respondents report no shortages of inputs in Q3 2020, similar to results from the July survey. The share of respondents reporting shortages is virtually unchanged in the current survey across all inputs, except for a decline in the percentage indicating intermediate input shortages.

• The NRI for capital spending improved, from -19 in July to -8 in October. Fewer respondents report continuing declines in spending, while more indicate their firms’ capital spending increased during Q3 2020. However, service-sector panelists report not much improvement from the prior two readings. The forward-looking NRI for capital spending rose considerably, from -40 in April to 6 in October, as fewer respondents expect declines in spending over the next 3 months.

• In response to COVID-19, businesses continue to adjust employee headcount and wages. Imposing a hiring freeze is the most common response, cited by 69% of respondents.

• Respondents’ near-term outlook improved slightly in October compared to that in the July survey. Thirty-six percent of respondents report a “Better” near-term in October, compared to 34% in July. Only 8% indicate their near-term outlook is “Worse” in October, compared to 12% in July.

• Twenty-three percent of respondents report that sales at their companies are at “more than 100% of pre-crisis level,” an increase from the 15% in the July survey.

• Thirty-one percent of respondents expect sales to return to normal “sometime in 2021,” while 24% do not expect sales to return to normal until sometime in 2022. Only 10% expect sales to return to normal by the end of 2020.

• Only 3% of respondents report that their firms applied, or are planning to apply, for Main Street Lending programs.

• Thirty-five percent of respondents indicate their firms have implemented new work-at-home policies, allowing “all employees” to work from home during the pandemic. Another 33% allow “most employees” to work from home, while 16% only allow “some employees” to work from home.

• Thirty-one percent of respondents report that their firms will wait for “progress regarding COVID-19” before changing their work-from-home policies. Twenty-two percent indicate their companies will wait until the second half of 2021, while 16% of firms plan to suspend work-from-home policies in the first half of 2021.

Stock Market Valuations

Our estimates of the market valuations for two stock market indices, the Dow Jones Industrial Average (DJIA) and the Standard & Poor’s 500 (S&P 500), can be found in the file below:

Conclusion

During this time of global flux due to the coronavirus, I am leaving the Conclusion discussion below the same as was posted on March 23, 2020. The March 23, 2020 discussion still adequately reflects my thinking on the current state of affairs.

Important Note: While I don’t believe it is time to jump back into the stock market in a big way because of the market’s overvaluation, I have been advising the last few of weeks in this Commentary and in my weekly podcast, Intrinsic Value Wealth Report Radio, that investors can continue building their investment portfolios by selecting individual securities that offer growth and value opportunities.

Reprinted from March 23, 2020

Up until the past week, the economy had been in a stable but somewhat vulnerable state. Nonetheless, it had remained fairly strong. In fact, robust consumer spending and strong labor market conditions had given us confidence that the economy, which had been in its tenth year of expansion, could continue to grow. But we were cautious on this outlook. There were several reasons for our caution. U.S. business growth had been mixed. And global economic growth had been mixed as well. The new coronavirus was becoming a global economic threat, although it was still too early to tell how much of an effect it would ultimately have. Debt is at high levels for consumers, businesses, and government (at all levels of government). Finally, this is an election year that will likely have significant consequences either positively or negatively depending on the outcome of the elections. And of course, it is still too early to tell what the outcome of the elections will be.

In just a few days, the coronavirus’s effect on the economy and the markets went from a ripple to a tsunami. Businesses are shuttering, events are being cancelled or postponed, grocery store shelves are empty, and people are being asked or ordered to stay home. The markets are now deep in bear market territory. The effects on the economy, even given the short time that the economy has been retreating, may be with us for a long time. There is now a much greater risk of a recession, and there has even been some talk of a depression. The government, the Fed, Republicans, and Democrats, and pretty much the entire country, is trying to get the virus under control and is coming up with plans to mitigate the long-term economic effects caused by the virus. But the virus has impacted the economy – in a significant way – in just a short time. How long lasting the effects will be no one can tell right now. The economy has been largely shut down and remains so today. It takes time to restart the economy after a situation such as what is occurring at the present time.

Given these events and the rapidly deteriorating situation, as I said last week, I would caution not to panic. The economy and the markets will get better. The situation is bad – there is no doubt about that – but it will turn around. The real question is when will it turn around? No one knows that at the present time. But it will turn around.

For now, review your investment portfolios. It is highly likely that all or most of your stocks are down. You should not consider selling the bulk of your stocks – only consider selling companies that are not sound companies. But do recognize that as the economy deteriorates, even good companies will be affected.

For stock market value hunters, we believe it is still too early to jump back in. We will be closely monitoring the markets using the many tools and models that we have developed over the years to assess the economy and the markets. We will use our best judgement and thoughts to let you know when we believe things are turning around. The turnaround hasn’t happened yet.

We believe it is important to maintain a long-term view toward investing. But for now, just sit tight. Eventually, this means that you should continue building your investment portfolio using the Cassandra Stock Selection Model to select individual securities that offer growth and value opportunities.

Chart for Review and Thought

Unemployment Rate

Simple and Effective Economic Forecasting Model

Note: The table and chart below have not been updated. However, we believe that a recession is quite likely. In the chart below, the bottom green line shows what a recession could look like.

Notes (GDP Growth Chart):

  1. See the July 8, 2019 Commentary for an introduction to this model.
  2. Actual numbers 2007 through 2019; forecasted numbers thereafter.
  3. Normal GDP growth is typically in the 2% to 3% range.
  4. A recession is generally defined as two consecutive quarters of negative economic growth as measured by a country’s gross domestic product (GDP).

Thought for the Week

“We cannot direct the wind, but we can adjust the sail” ~ Anonymous

Announcements

The Intrinsic Value Wealth Report has started a new YouTube channel called Intrinsic Value Wealth Report TV. You can view the YouTube channel at Intrinsic Value Wealth Report TV.

The Intrinsic Value Wealth Report has started a new podcast called Intrinsic Value Wealth Report Radio. You can listen to the podcast at Intrinsic Value Wealth Report Radio.

Dr. Wendee spoke at the Investment Club of America’s annual economic summit, called Econosummit, on Sunday March 1, 2020 in Las Vegas.

Dr. Wendee attended the The National Due Diligence Alliance (TNDDA) investment banking conference, which was held March 6-8, 2020 at the Four Seasons Resort in Dallas, Texas. This is a conference held several times throughout the year for investment bankers and registered investment advisers to learn about new opportunities in the Alternative Investment asset classes.

TNDDA Meeting in Dallas, Texas

We have been researching the use of crowdsourcing for investment ideas. We will be sending a survey out in the next few weeks to get your input on the economy and the markets; and to get any investment ideas that you would like to share. We will compile this input and distribute the results to you and our other subscribers. We have been testing our crowdsourcing models with students and have been having good success and results.

Dr. Wendee has been researching and writing a new theory of economics known as, The Value Creation Theory of the Economy (also known as, Intrinsinomics). The full paper on Intrinsinomics will be published in the near future.

Finance 3350: Personal Finance-Portfolio & Risk Management– Dr. Wendee taught teaching Finance 3350 – Portfolio & Risk Management at California State University, Los Angeles (CSULA) for the Summer term starting May 2020. Dr. Wendee teaches courses in Management and Finance at CSULA.

Business 548: Strategy and Decision Making – Dr. Wendee taught Business 548 – Strategy and Decision Making at California Baptist University (CBU) starting at the end of June 2020. Dr. Wendee teaches courses in Finance, Business, Strategy & Decision Making, and Economics at CBU.

Business 303: Business Finance – Dr. Wendee taught Business 303 – Business Finance at California Baptist University (CBU) starting at the end of August 2020. Dr. Wendee teaches courses in Finance, Business, Strategy & Decision Making, and Economics at CBU.

Business 539: Financial Management – Dr. Wendee is teaching Business 539 – Financial Management at California Baptist University (CBU) which started at the end of October. Dr. Wendee teaches courses in Finance, Business, Strategy & Decision Making, and Economics at CBU.

Dr. Wendee presented a paper on his new theory of economics known as, The Value Creation Theory of the Economy (also known as, Intrinsinomics), at the International Leadership Association’s annual global conference which was held in Ottawa, Canada last Fall.

Dr. Wendee presented an updated paper on his new theory of economics known as, The Value Creation Theory of the Economy (also known as, Intrinsinomics), at the International Leadership Association’s annual global conference which was to have been held in San Francisco, California in November, but which was held virtually instead due to the Coronavirus.

Dr. Wendee delivered a talk entitled: Using Alternative Assets to Increase Portfolio Returns and Decrease Risk at the BrightTalk Q4 2020 Outlook Summit on October 28, 2020. You can access additional information on the summit and Dr. Wendee’s presentation here.

Dr. Wendee delivered a talk  at the BrightTalk conference on December 9, 2020 entitled: Emerging Themes and Great Places to Invest for 2021. You can access additional information on the summit and Dr. Wendee’s presentation here.

Dr. Wendee is working on a financial planning modeling program which will be available in the near future. The modeling program is designed to assist anyone in creating a financial plan and is customizable for each person’s unique financial planning goals. A working draft of the model is currently in beta test with students. Click this link, schematic, to go to the clickable document under the subheading Financial Planning Process (Draft) in the Intrinsic Value Wealth Report to see a draft of the schematic for the new financial planning process.

Dr. Wendee has been developing an econometric model specifically designed to monitor and forecast the global economy as this current economic crisis unfolds. This new econometric model is based on other econometric models that he has designed and have used for many years. You can find some of these earlier models in Book # 6 – Simple and Effective Economic Forecasting in the sister website to this website which is called the Intrinsic Value Wealth Report. The new econometric model has been constructed with some additional tools and methods that he has learned and some that he has developed over the last several years. He will be talking more about this new econometric model in this Commentary over the next few months. His comments and forecasts on the economy and the markets going forward will be based to a significant extent on this new model.

We have begun raising capital for our fund-of-funds investment, Northwest Quadrant Opportunity Fund, LLC. The fund engineers and constructs an investment vehicle consisting of Alternative Asset investments. The fund’s objective is to build a diversified portfolio of strong, solid, steady- performing assets, with highly qualified asset managers who have proven track records that meet our underwriting requirements. To learn more about the Northwest Quadrant Opportunity Fund, LLC and to obtain an offering memorandum, please click Northwest Quadrant Opportunity Fund, LLC.

Intrinsic Value Wealth Creation pyramid

We always conclude our commentary with a discussion of the Intrinsic Value Wealth Creation Pyramid. The Intrinsic Value Wealth Creation Pyramid is designed to show some of the major categories for building wealth. It is the result of many years of study of the wealth building process; experience working with clients who have built considerable wealth; and my own personal experience building wealth. Newsletter subscribers should consult the Intrinsic Value Wealth Creation Pyramid as one of many useful investment tools while considering their investment plans.

The chart in this section is an expanded version of the Intrinsic Value Wealth Creation Pyramid Chart referenced in the Forbes.com article entitled, Nine of the Best Ways to Build Wealth.

RESOURCES

See our Resources section for links to economic and other resources used in the preparation of this Commentary.

Posted in Economic & Business Chart Room, Economic Outlook, Entrepreneurship, Focus List, Investment Recommendations, Investments, Notes From The Field, Special Situations, Uncategorized, VDI/REEP, Visionary Ideas | Tagged , , , , , , , , , , , , , , , , , , , , , , , , , , , , , , , , , | Comments Off on WEEKLY COMMENTARY December 22, 2020