
Rising Yield Spread Signals Caution for the Economy
In yet another troubling sign for the health of the economy, investors have been selling junk bonds raising the rate that those bonds must pay to attract new investors. Since March, the extra yield over safe government bonds that triple-C rated corporate debt must pay has risen 0.64 percent versus a decline of 0.09 percent in extra yield for higher ranked B-rated bonds.
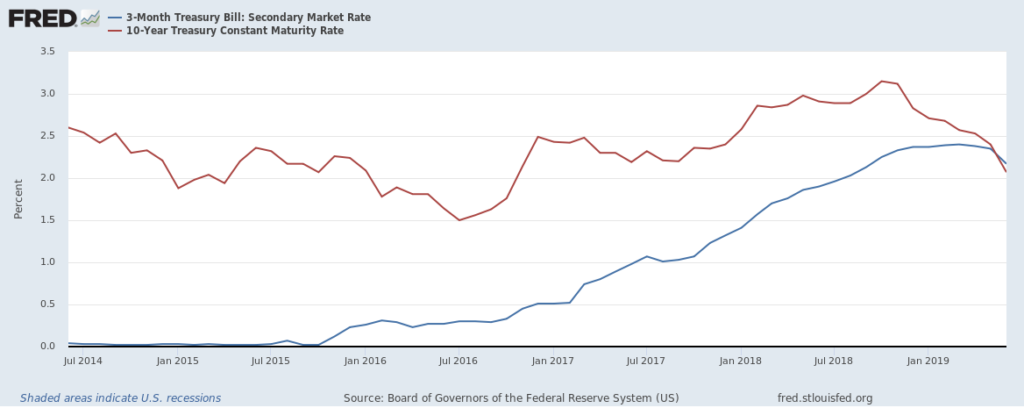
Rising junk bond yields is often an indicator of deteriorating economic health. At the same time, the inverted yield curve (see chart below) that we discussed in our July 1, 2019 Commentary signals a possible recession. Taken together, both the rising yield spread and the inverted yield curve are a strong cautionary signal on the overall health of the economy.
Economic and Investment Highlights
Last Week
U.S. investment funds, which typically represent individual investors, have bought this year 54% of the new government notes and bonds sold at auction through May 31.
Large IPOs, those valued at $10 billion or more, have set a record in the first half of this year for the most number of large IPOs since the dot.com boom of 2000.
Richard Branson’s Virgin Galactic plans to go public later this year making it the first publicly listed human spaceflight company.
Federal Reserve Chairman Jerome Powell signaled that the Fed may cut interest rates this month. In his testimony on Capitol Hill on Wednesday Powell cited slower global growth, trade tensions, and weak inflation as reasons for a possible rate cut. Despite these concerns, the labor market and consumer spending have remained strong.
U.S. manufacturers are increasingly shifting production out of China.
Corporate earnings are forecast to decline by 3% from a year earlier in this reporting season. So far, more than 80 S&P 500 companies have warned that their second quarter results will be weaker than initially expected.
It is reported that more than a dozen European junk bonds offer negative yields. Normally, junk bonds offer very high yields.
The S&P 500 closed above the 3,000 level for the first time on Friday. The Dow closed above the 27,000 level for the first time on Thursday. The Dow Jones Industrial Average, the S&P 500 and the Nasdaq all rose slightly for the week, 1.5% for the Dow, 0.78% for the S&P 500 and 1.0% for the Nasdaq. The 10-year treasury yield ended the week at 2.106%.
The Week Ahead
This link takes you to Econoday’s Economic Calendar and Economic Events and Analysis which shows the upcoming economic reporting events scheduled in the week and months ahead.
Summary
Note: The comments that follow are derived from the economic indicators referenced in the Resources section of this newsletter and other sources in this report.
The Aruoba-Diebold-Scotti Business Conditions Index (ALS) has been trending up the last several weeks and has now crossed over the zero line into positive territory. The ALS Index was relatively flat this past week. This is a very positive indicator for the economy on a short-term basis.
The GDPNow model estimate for real GDP growth (seasonally adjusted annual rate) in the second quarter of 2019 is 1.6 percent. This slight adjustment continues to support the ALS model assessment of an improving short-term economic environment.
The New York Fed Staff Nowcast stands at 1.5% for 2019:Q2 and 1.8% for 2019:Q3.
The Chicago Fed National Activity Index (CFNAI) showed an increase in economic activity in May. The Chicago Fed National Activity Index (CFNAI) was –0.05 in May, up from –0.48 in April.
All told, these short-term economic indicators are a neutral to positive analysis for the economy, at least on a short-term basis.
Expectations that stock prices will rise over the next six months rose this past week and is now at 33.6%, an unusually low level, in the latest AAII Sentiment Survey. The historical average is 38.5% for the survey. Please see the AAII Sentiment Survey for the complete results.
The latest Gross output (GO) reading suggests slow economic growth as we enter 2019.
On a longer-term basis, the forecasters in the Philadelphia Fed’s Survey of Professional Forecasters (as of May 10, 2019) predict real GDP will grow at an annual rate of 1.9 percent this quarter and 2.1 percent next quarter. On an annual-average over annual-average basis, the forecasters predict real GDP to grow 2.6 percent in 2019, 2.0 percent in 2020, 1.9 percent in 2021 and 2.3 percent in 2022. The forecasters predict the unemployment rate will average 3.7 percent in 2019, 3.6 percent in 2020, 3.7 percent in 2021, and 3.9 percent in 2022.
For a more in-depth review and analysis of the economy, please see our mini-book on economic analysis and forecasting entitled: Simple and Effective Economic Forecasting.
Stock Market Valuations
Our estimates of the market valuations for two stock market indices, the Dow Jones Industrial Average (DJIA) and the Standard & Poor’s 500 (S&P 500), can be found in the file below:
Conclusion
We continue to believe the economy is in a stable but now more vulnerable state. Recent economic reports have been showing signs of weakening. Nonetheless, the economy has remained fairly strong. In fact, the extremely strong first quarter GDP showing and the strong labor market conditions still give us confidence that the economy, now in its tenth year of expansion, can continue to grow. But we are cautious on this outlook! Please see our complete Economic and Investment Review in the Spring 2019 quarterly issue of the Intrinsic Value Wealth Report Newsletter.
The broad market remains overvalued, although the Dow Jones Industrial Average looks more fairly valued than the broad market. But that does not mean that a market correction is imminent. Markets can and do stay overvalued for long periods of time. As discussed above and in the Economic and Investment Highlights section of this Commentary, we believe the economy is in a stable but vulnerable state that is showing signs of weakening. If the economy remains strong, the markets will likely remain strong. If the economy deteriorates, the markets may well correct. There are other events that could trigger a market correction, of course, but economic conditions are the most likely and foreseeable events that could make that happen.
We believe it is important to maintain a long-term view toward investing. This means that you should continue building your investment portfolio using the Cassandra Stock Selection Model to select individual securities that offer growth and value opportunities.
Chart for Review and Thought
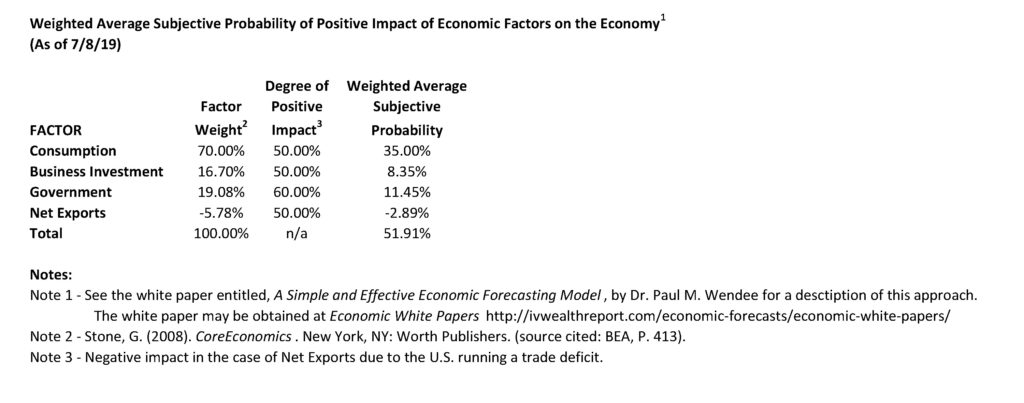
Simple and Effective Economic Forecasting Model
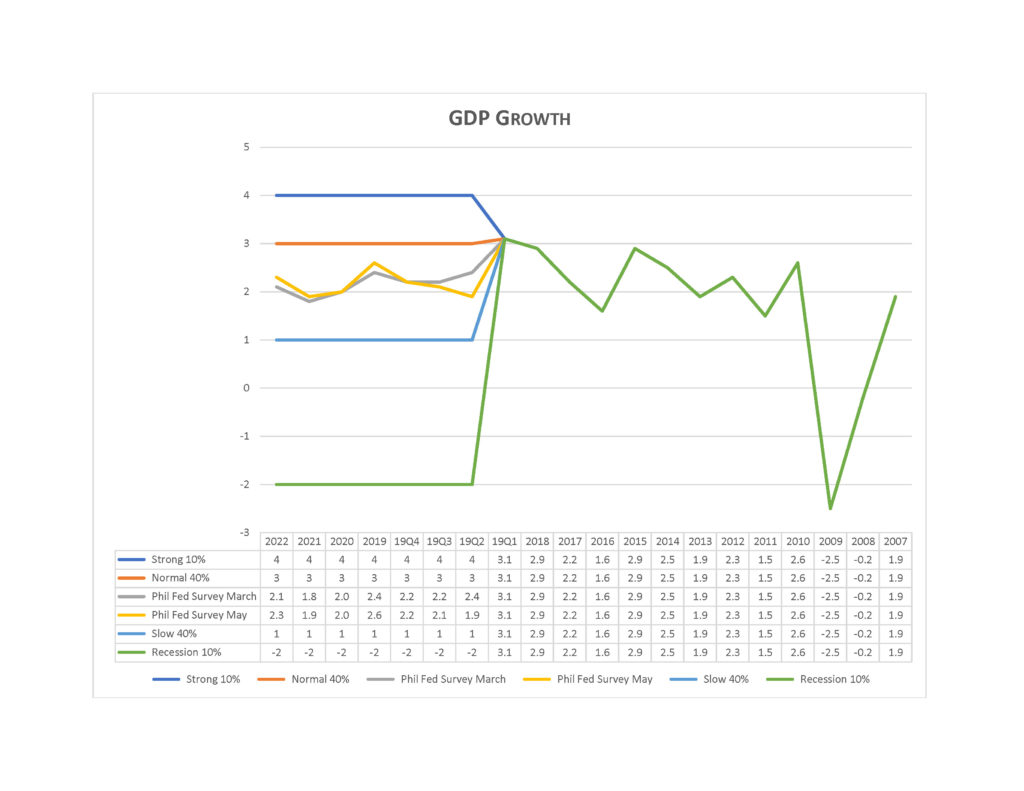
Notes (GDP Growth Chart):
- See the July 8, 2019 Commentary for an introduction to this model.
- Actual numbers 2007 through Q1 2019; forecasted numbers thereafter.
- Normal GDP growth is typically in the 2% to 3% range.
- A recession is generally defined as two consecutive quarters of negative economic growth as measured by a country’s gross domestic product (GDP).
Announcements
We have been researching the use of crowdsourcing for investment ideas. We will be sending a survey out in the next few weeks to get your input on the economy and the markets; and to get any investment ideas that you would like to share. We will compile this input and distribute the results to you and our other subscribers.
Dr. Wendee will be speaking at FreedomFest during its annual conference in Las Vegas, July 17 – 20, 2019.
Business 539 – Financial Management – On July 1, 2019, Dr. Wendee started teaching Business 539 – Financial Management at California Baptist University (CBU). Dr. Wendee teaches courses in Finance and Economics at CBU.
Management 3080 – Business Responsibility in Society – Dr. Wendee will be teaching Management 3080 – Business Responsibility in Society at California State University, Los Angeles (CSULA) starting August 22, 2019. Dr. Wendee teaches courses in Management at CSULA.
Business 217 – Microeconomics – Dr. Wendee will be teaching Business 217 – Microeconomics at California Baptist University (CBU) starting September 4, 2019. Dr. Wendee teaches courses in Finance and Economics at CBU.
Business 218 – Macroeconomics – Dr. Wendee will be teaching Business 218 – Macroeconomics at California Baptist University (CBU) starting September 4, 2019. Dr. Wendee teaches courses in Finance and Economics at CBU.
Dr. Wendee will be presenting a paper on enterprise value creation at the International Leadership Association’s annual global conference which is being held in Ottawa, Canada this Fall.
Intrinsic Value Wealth Creation pyramid
We always conclude our commentary with a discussion of the Intrinsic Value Wealth Creation Pyramid. The Intrinsic Value Wealth Creation Pyramid is designed to show some of the major categories for building wealth. It is the result of many years of study of the wealth building process; experience working with clients who have built considerable wealth; and my own personal experience building wealth. Newsletter subscribers should consult the Intrinsic Value Wealth Creation Pyramid as one of many useful investment tools while considering their investment plans.
The chart in this section is an expanded version of the Intrinsic Value Wealth Creation Pyramid Chart referenced in the Forbes.com article entitled, Nine Of The Best Ways To Build Wealth.
RESOURCES
See our Resources section for links to economic and other resources used in the preparation of this Commentary.